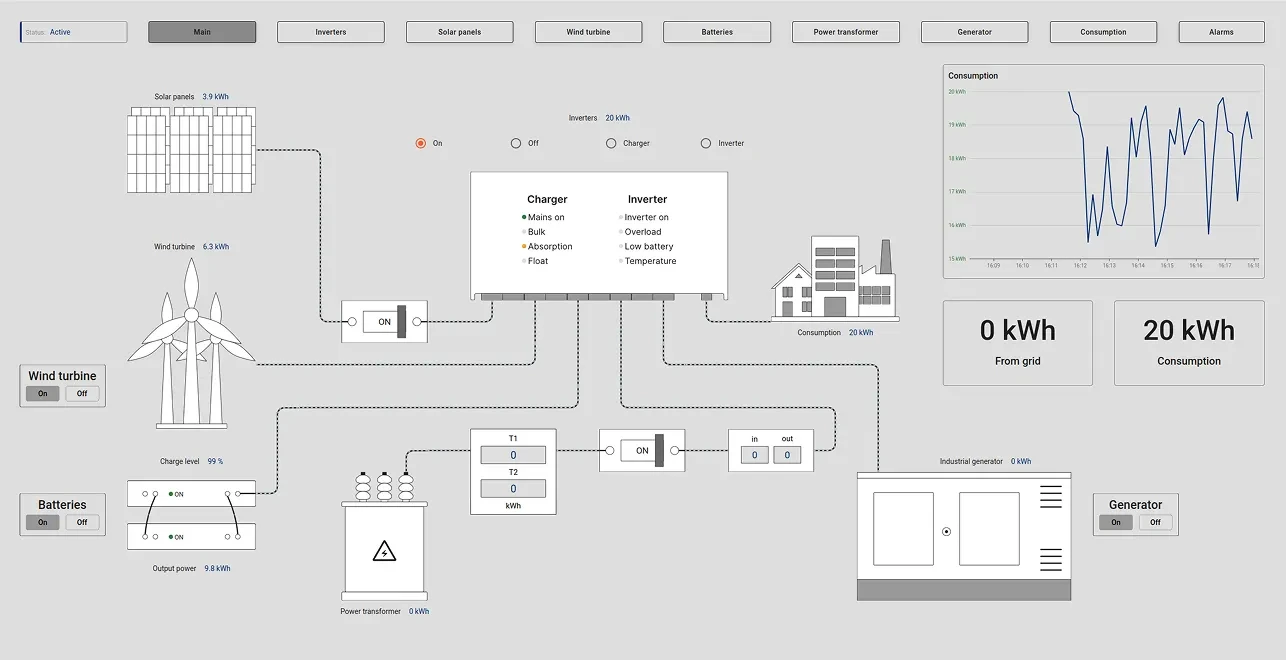
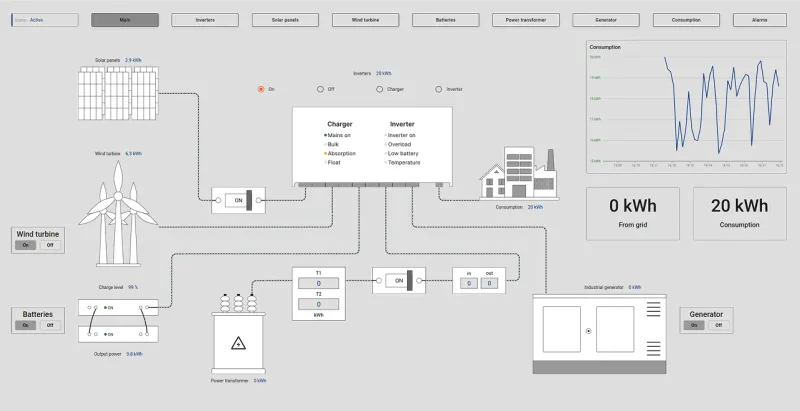
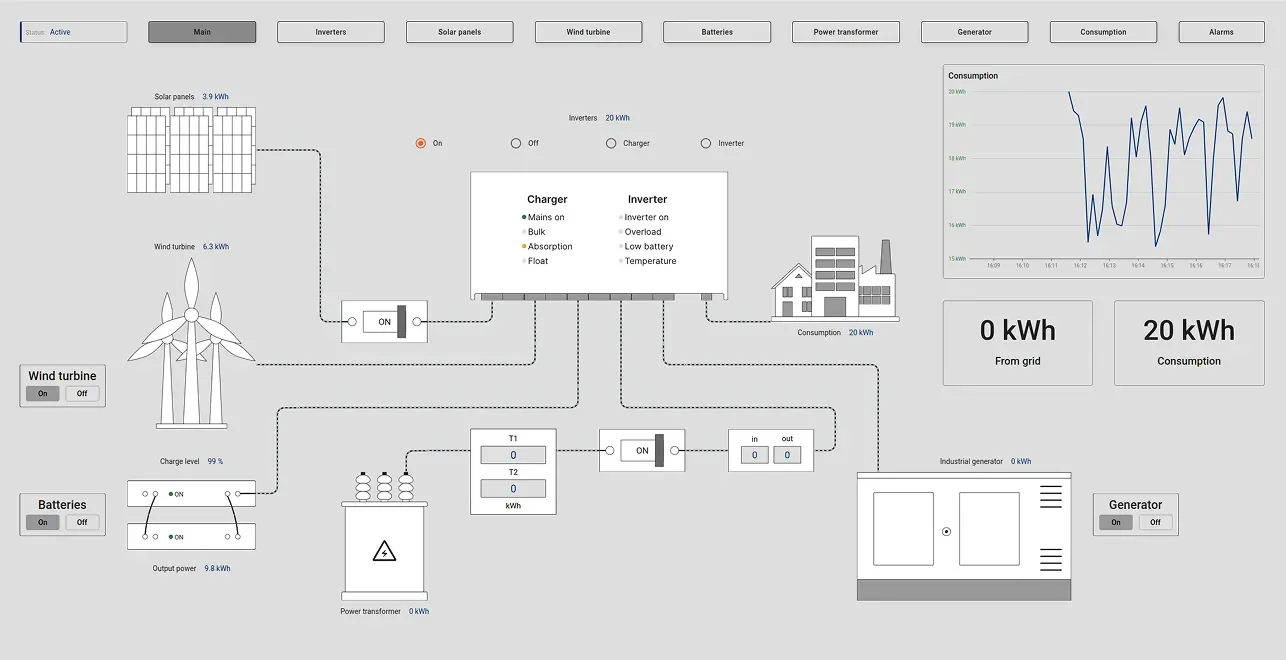
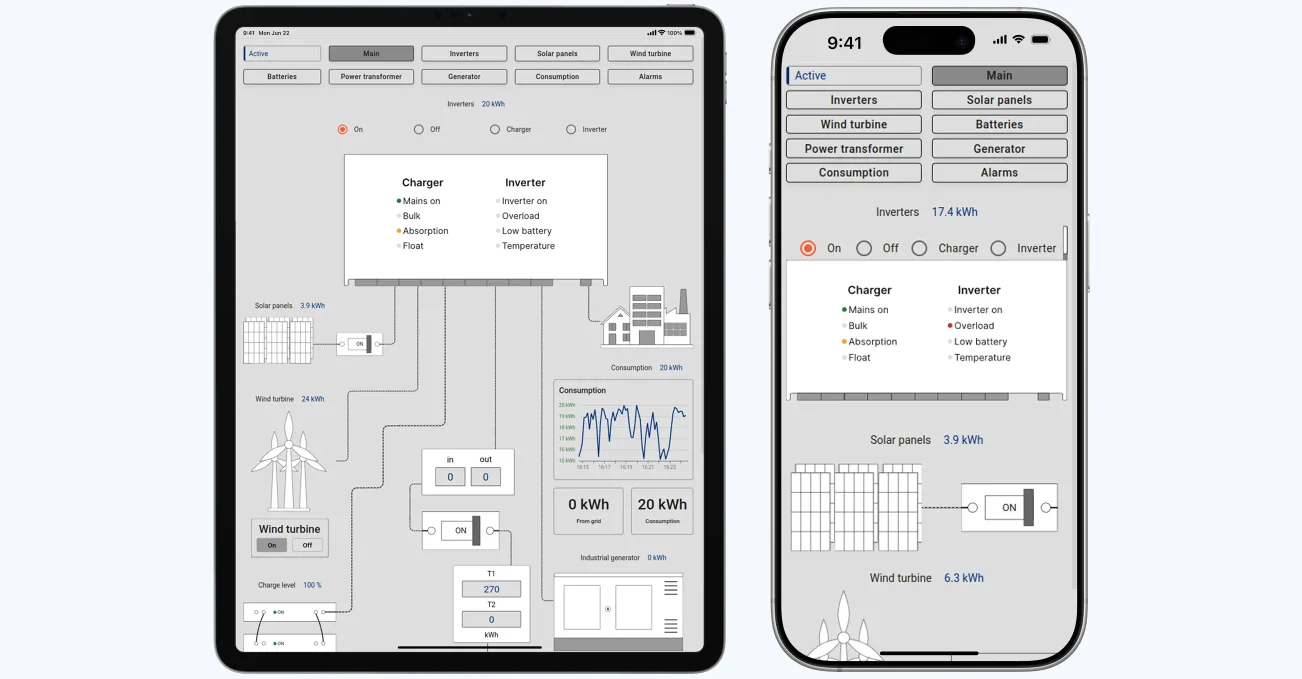
The main dashboard provides an overview of the energy system, showing the status of power sources, energy flow, and real-time consumption. It includes data from solar panels, wind turbines, batteries, power transformers, and generators. The dashboard displays key parameters such as power consumption, grid input, and battery charge levels, along with interactive controls for managing energy sources.
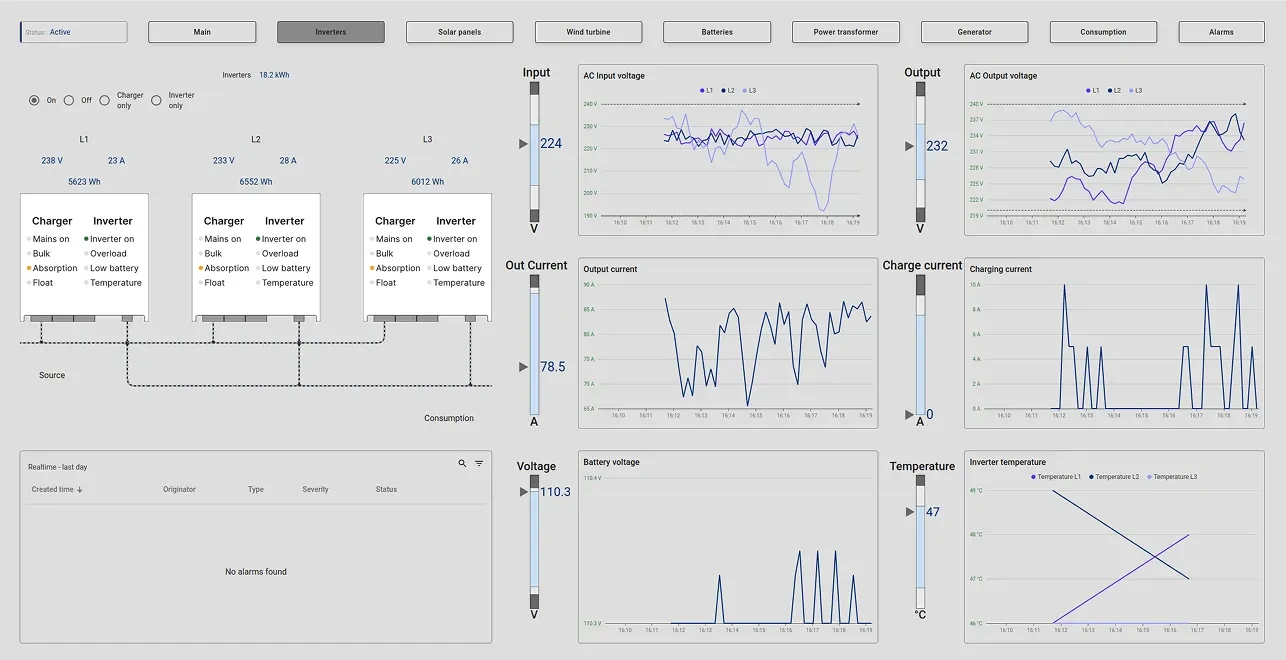
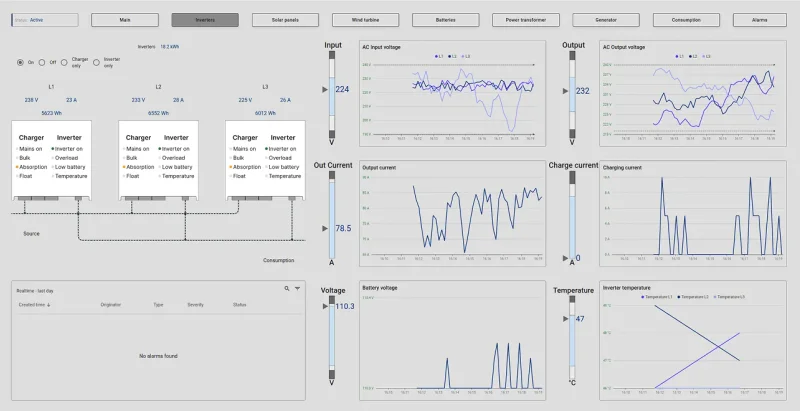
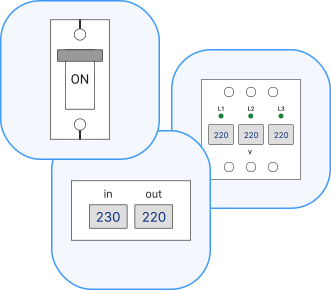
This dashboard focuses on inverter performance and load distribution. It displays voltage, current, and power output for each inverter phase (L1, L2, L3). Additionally, it includes real-time graphs for AC input and output voltage, output current, and battery voltage. An alarm section provides alerts on critical events like overloads and overheating.
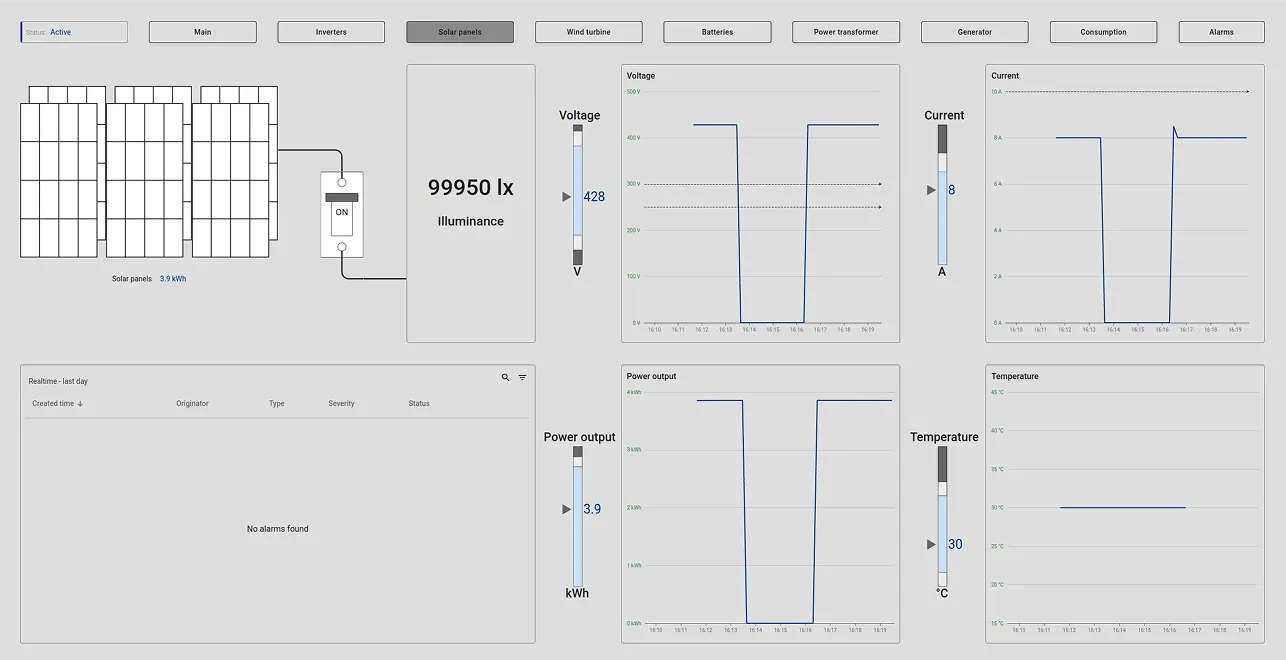
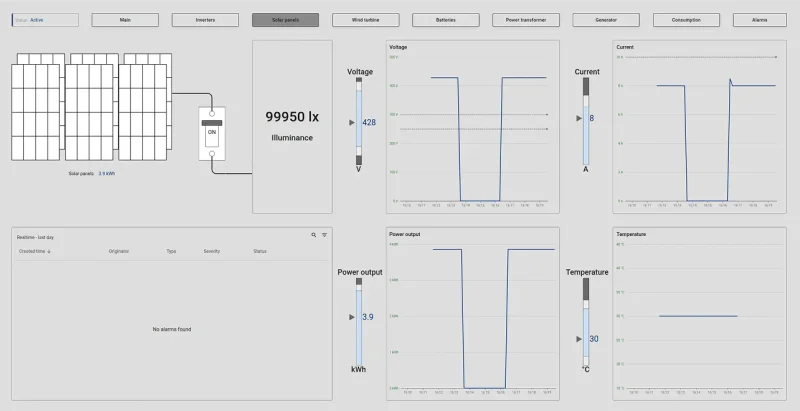
This screen monitors solar panel performance, showing real-time illumination levels, voltage, and power output. It includes historical data trends on voltage, current, and solar panel temperature. The dashboard also features an alarm section to highlight any operational anomalies affecting solar power generation.
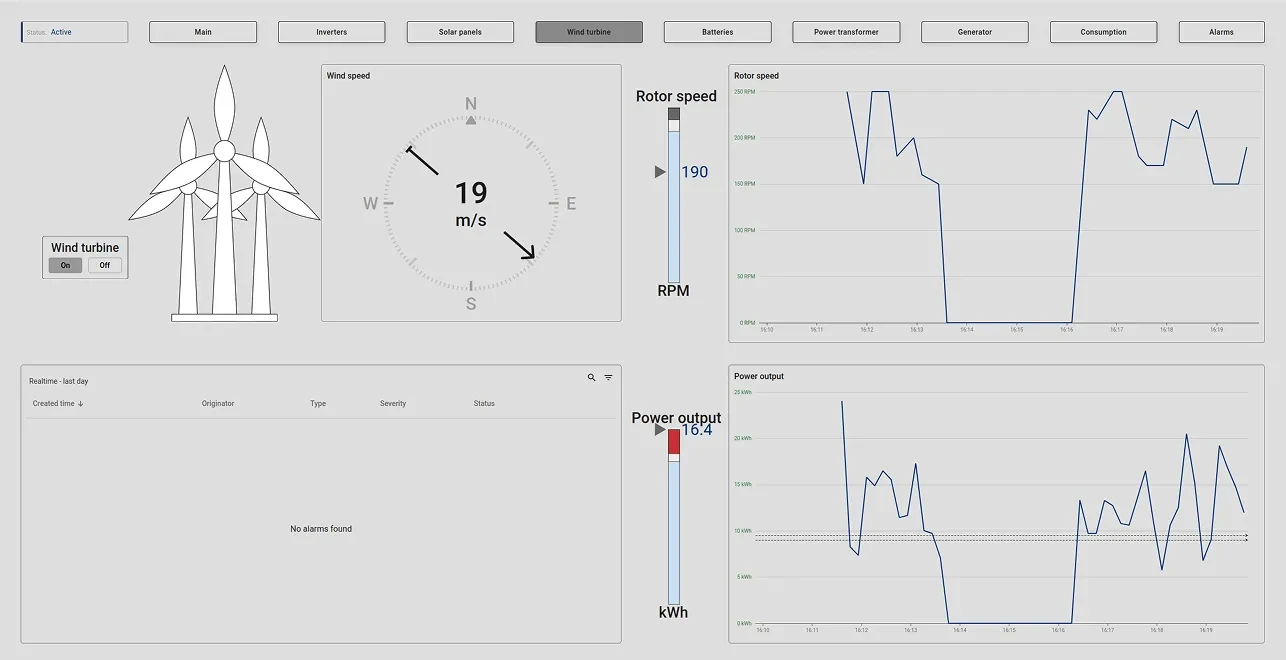
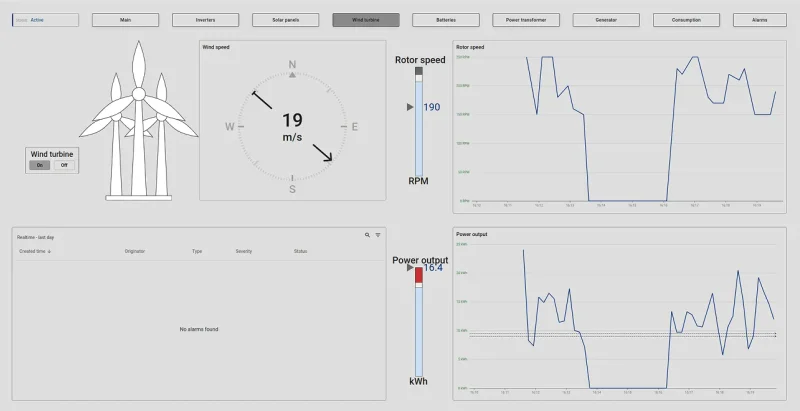
The wind turbine dashboard provides detailed data on wind speed, rotor speed, and power output. It includes a graphical representation of rotor speed variations over time and energy production trends. The alarm section helps in identifying critical issues like excessive vibrations or high-speed fluctuations.
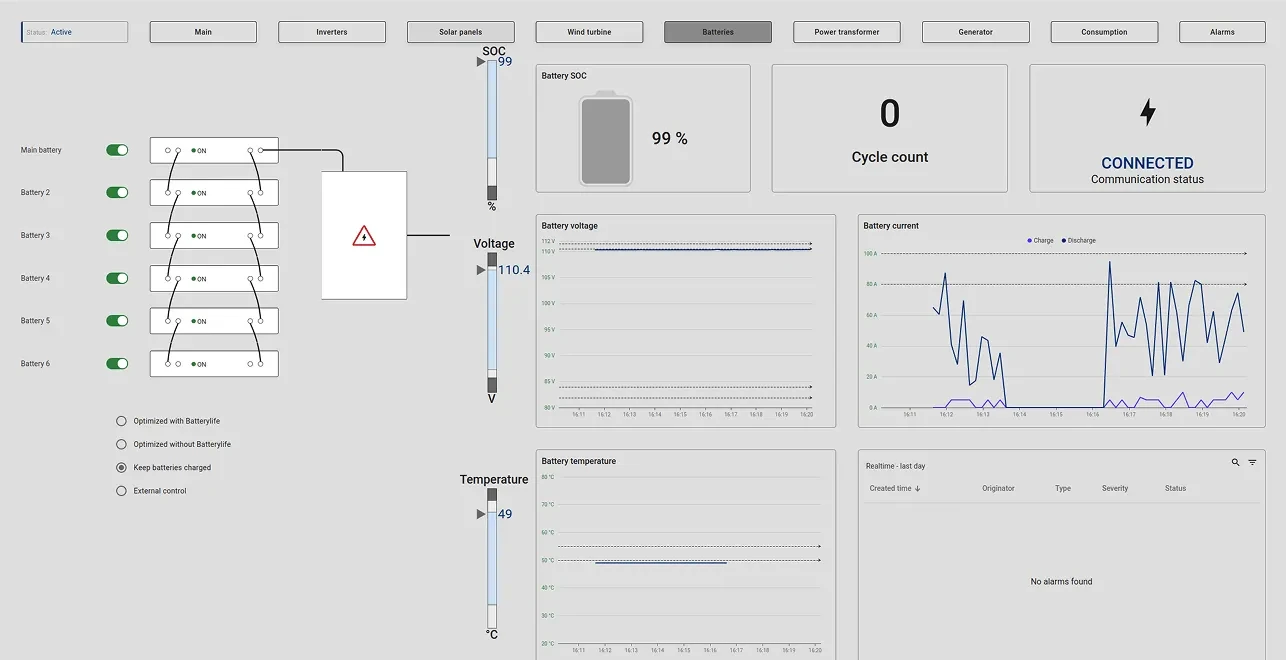
This dashboard displays the status of battery energy storage, including charge level (SOC), cycle count, and battery voltage. Graphs show battery current (charge/discharge trends), temperature, and voltage over time. An alarm section notifies users about battery health issues or operational concerns.
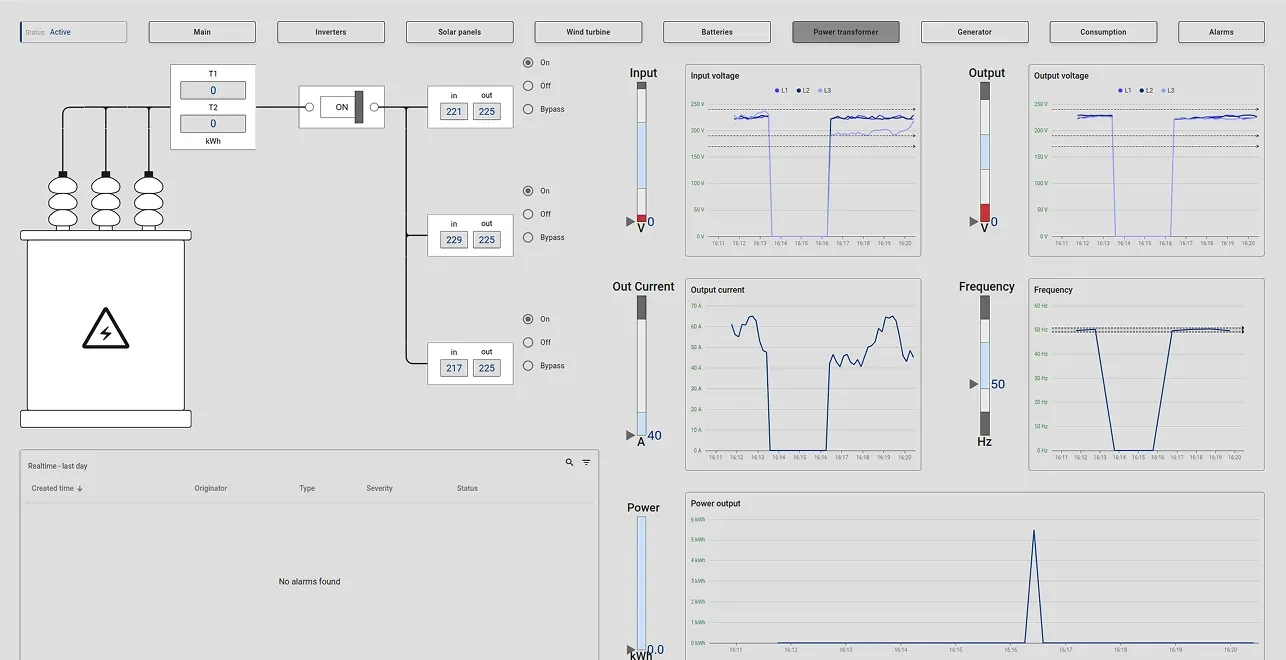
This screen monitors transformer performance by displaying input and output voltage, output current, and power frequency. It provides real-time data on energy flow and ensures stable grid integration. Graphs illustrate historical trends, and an alarm section highlights any transformer-related warnings.
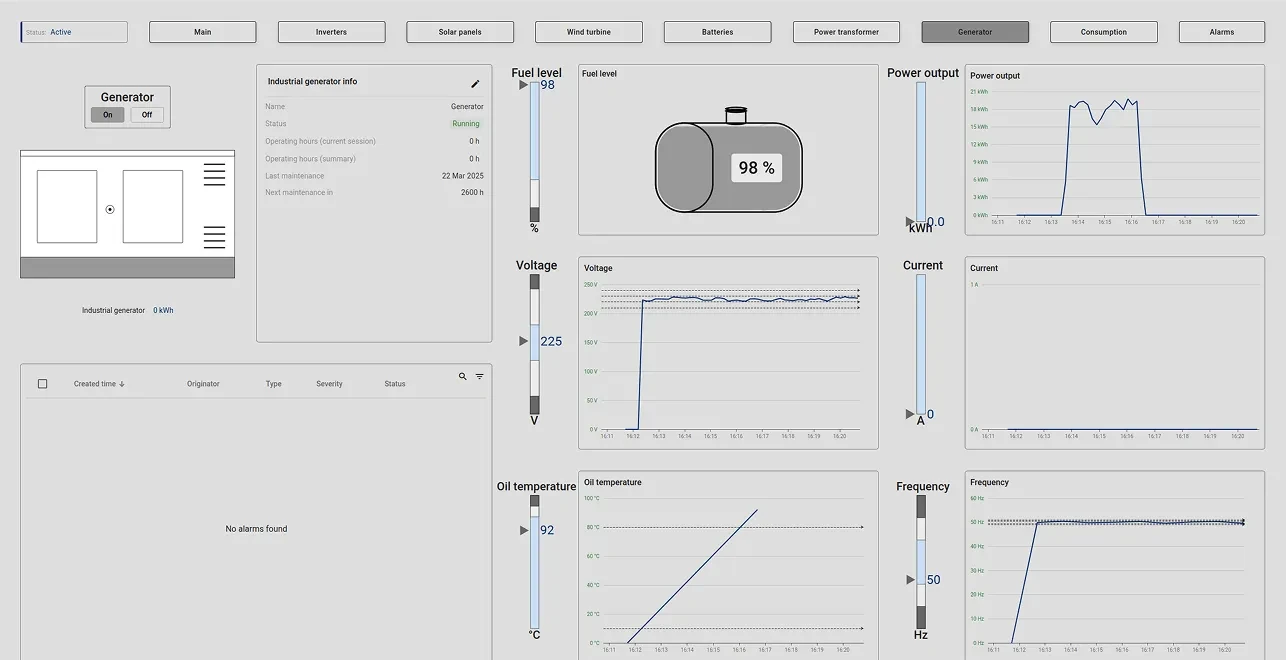
This dashboard provides information on generator operation, fuel levels, and power output. It displays voltage, current, and oil temperature trends, ensuring stable backup power management. The status section tracks operating hours and maintenance schedules, while the alarm panel notifies users about critical conditions.
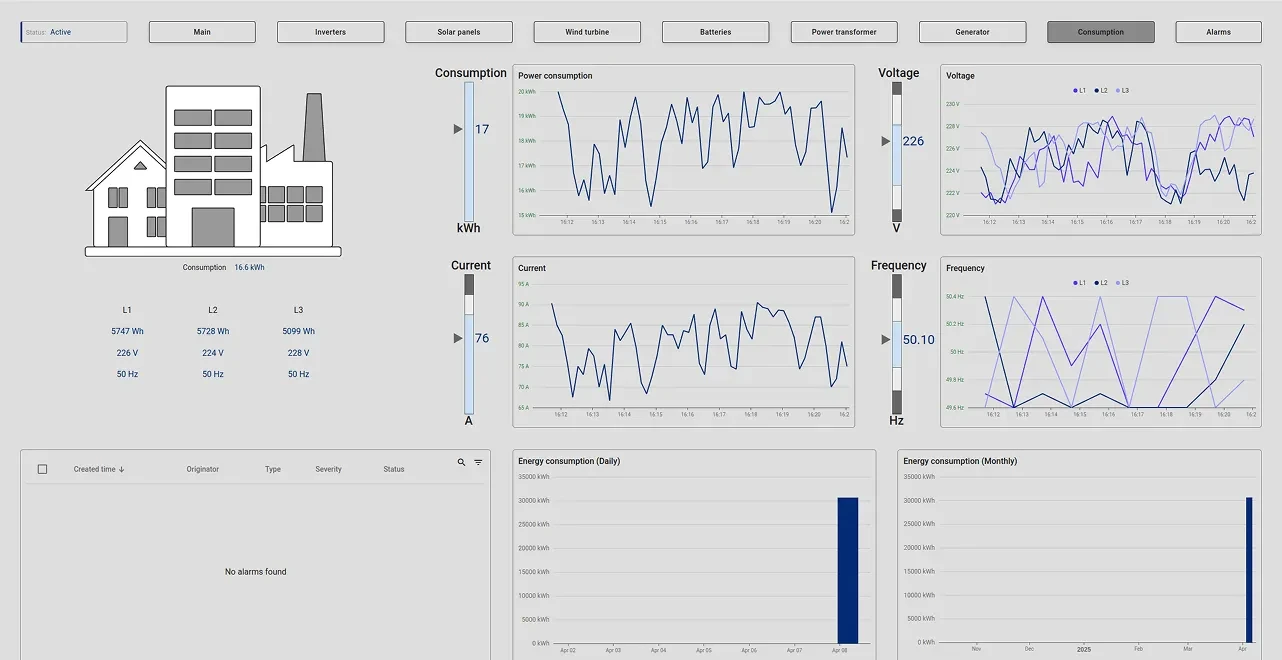
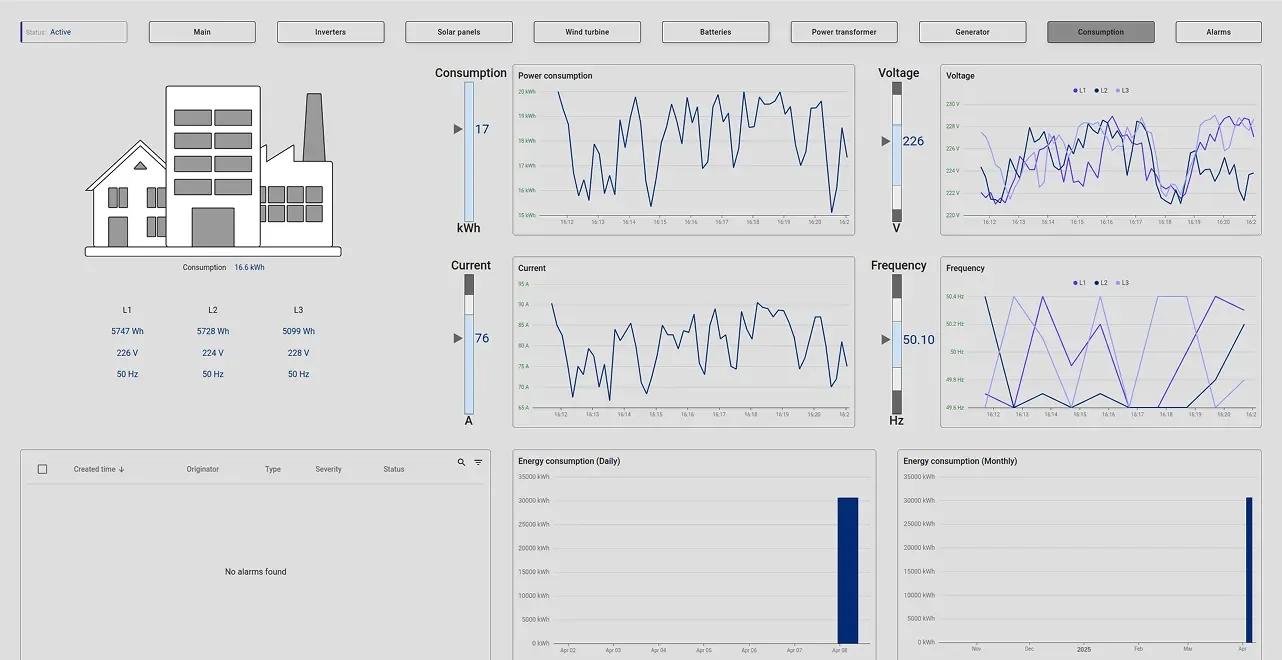
The consumption dashboard visualizes energy usage trends for different timeframes (daily, monthly). It includes graphs for power consumption, voltage, current, and frequency, helping operators optimize energy efficiency. The alarm section highlights any anomalies in power usage or system performance.
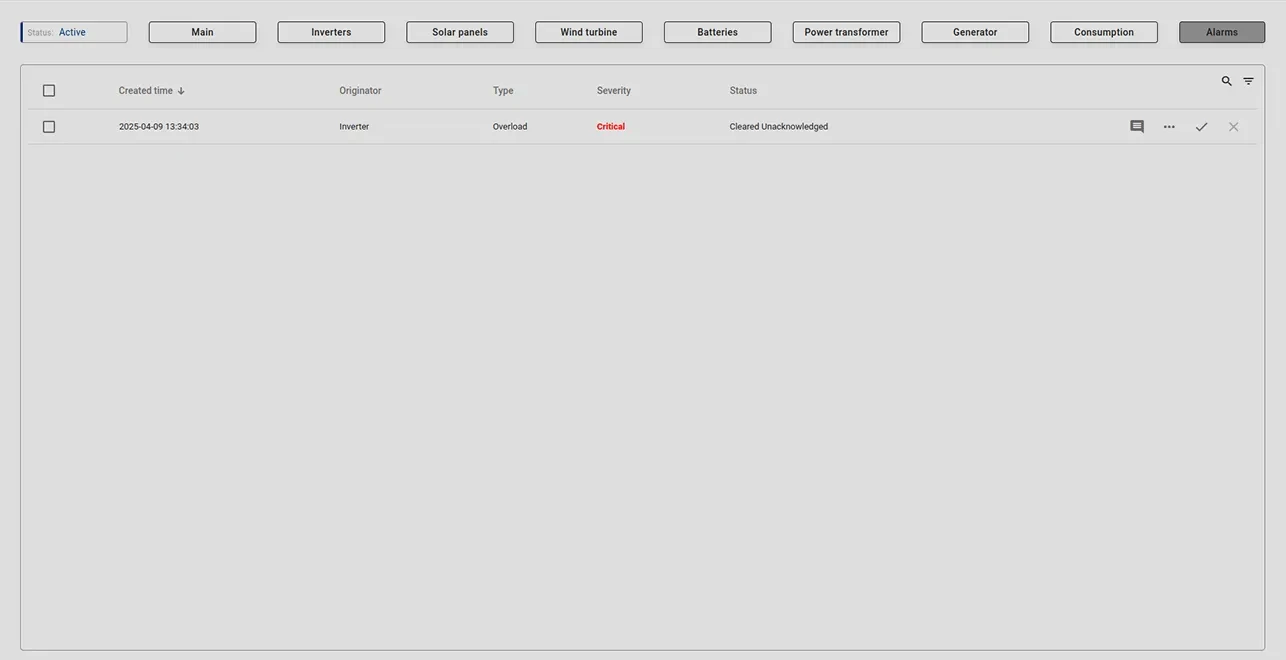
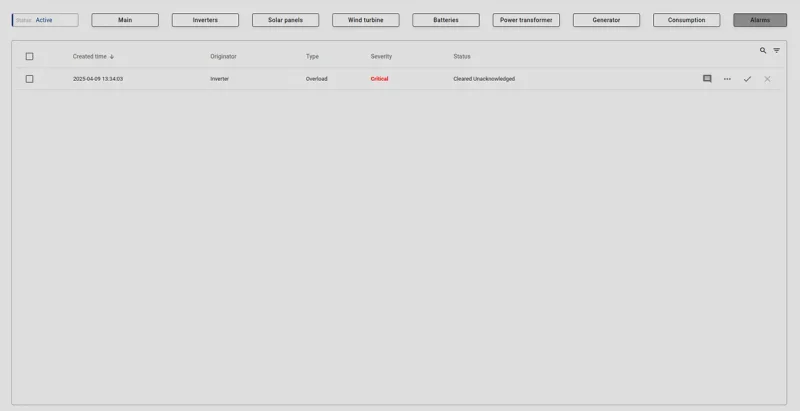
This screen provides a detailed view of all system alarms, including timestamps, severity levels, and statuses. Users can acknowledge or resolve alarms related to high vibration, speed variations, and system failures. The dashboard helps operators quickly identify and respond to critical system issues.
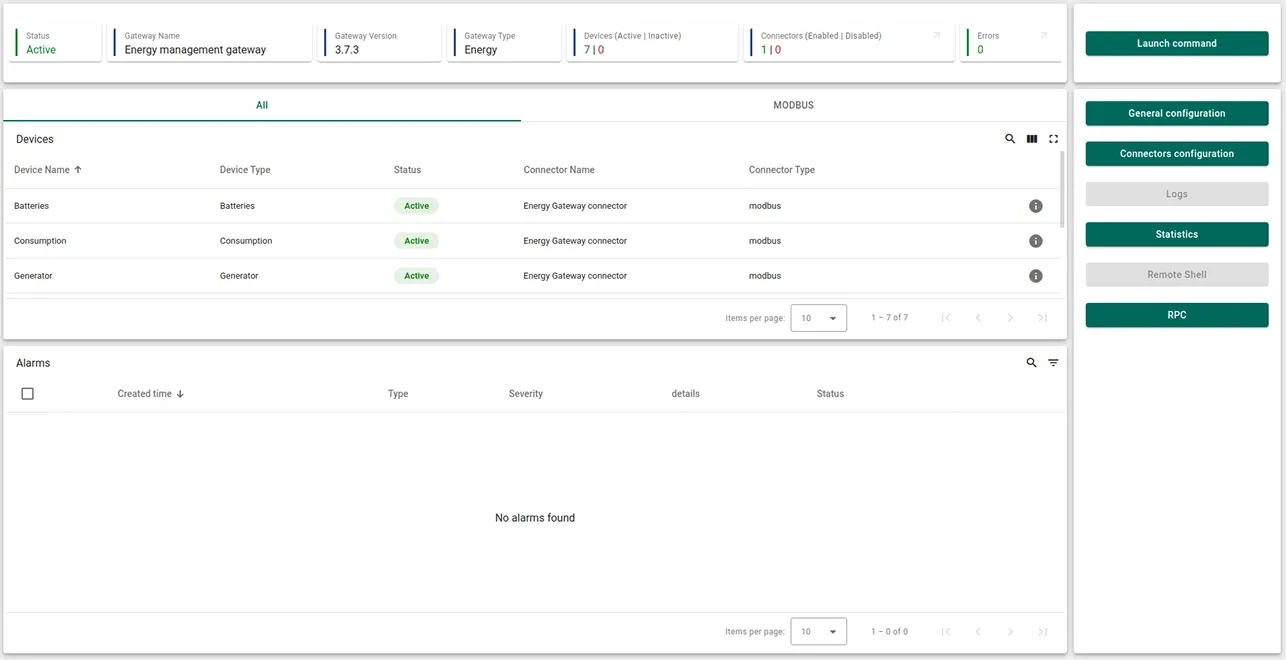
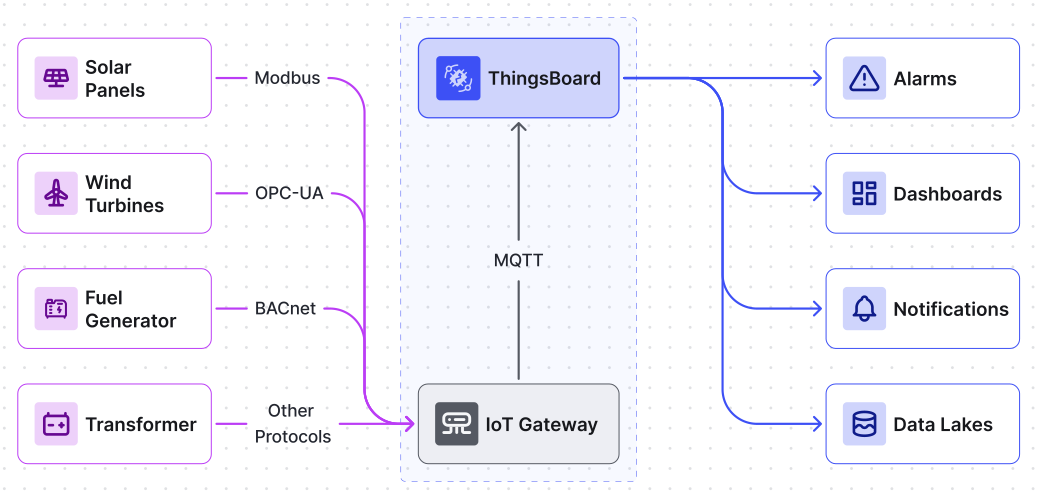
This section provides an overview of all connected devices, showing their status, protocol (Modbus), and data communication. Operators can configure connections, monitor device health, and troubleshoot errors in real-time.
Main dashboard state
The main dashboard provides an overview of the energy system, showing the status of power sources, energy flow, and real-time consumption. It includes data from solar panels, wind turbines, batteries, power transformers, and generators. The dashboard displays key parameters such as power consumption, grid input, and battery charge levels, along with interactive controls for managing energy sources.
Inverters state
This dashboard focuses on inverter performance and load distribution. It displays voltage, current, and power output for each inverter phase (L1, L2, L3). Additionally, it includes real-time graphs for AC input and output voltage, output current, and battery voltage. An alarm section provides alerts on critical events like overloads and overheating.
Solar panels state
This screen monitors solar panel performance, showing real-time illumination levels, voltage, and power output. It includes historical data trends on voltage, current, and solar panel temperature. The dashboard also features an alarm section to highlight any operational anomalies affecting solar power generation.
Wind turbine state
The wind turbine dashboard provides detailed data on wind speed, rotor speed, and power output. It includes a graphical representation of rotor speed variations over time and energy production trends. The alarm section helps in identifying critical issues like excessive vibrations or high-speed fluctuations.
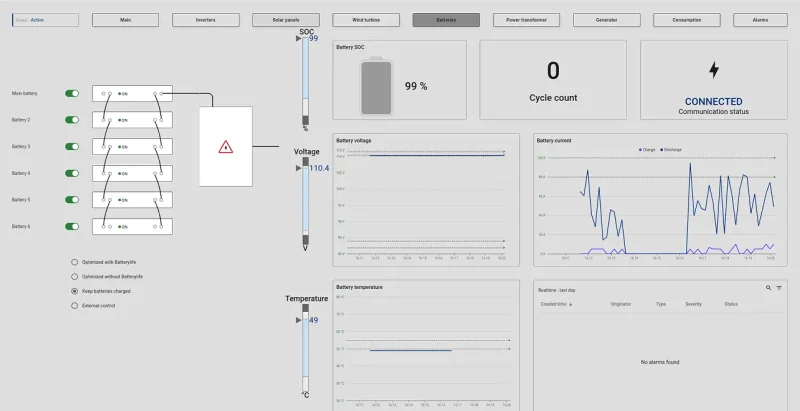
Batteries state
This dashboard displays the status of battery energy storage, including charge level (SOC), cycle count, and battery voltage. Graphs show battery current (charge/discharge trends), temperature, and voltage over time. An alarm section notifies users about battery health issues or operational concerns.
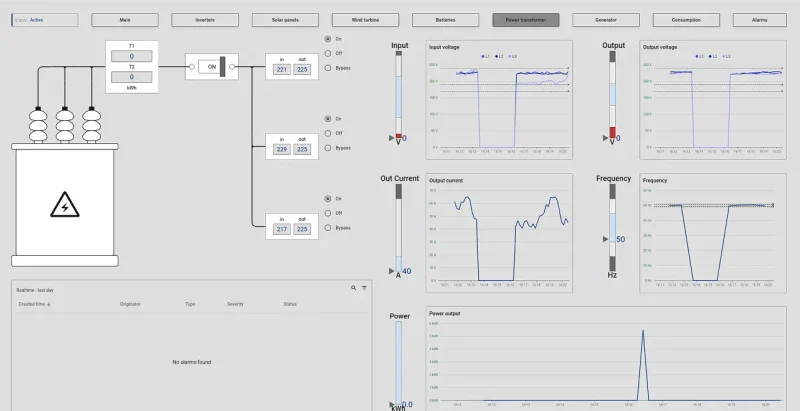
Power transformer state
This screen monitors transformer performance by displaying input and output voltage, output current, and power frequency. It provides real-time data on energy flow and ensures stable grid integration. Graphs illustrate historical trends, and an alarm section highlights any transformer-related warnings.
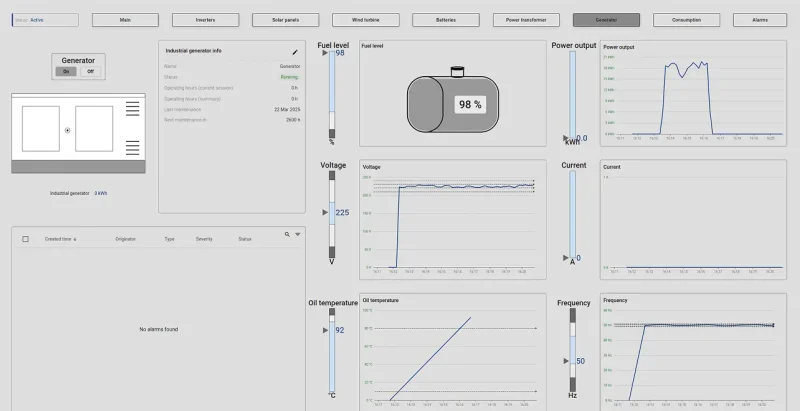
Generator state
This dashboard provides information on generator operation, fuel levels, and power output. It displays voltage, current, and oil temperature trends, ensuring stable backup power management. The status section tracks operating hours and maintenance schedules, while the alarm panel notifies users about critical conditions.
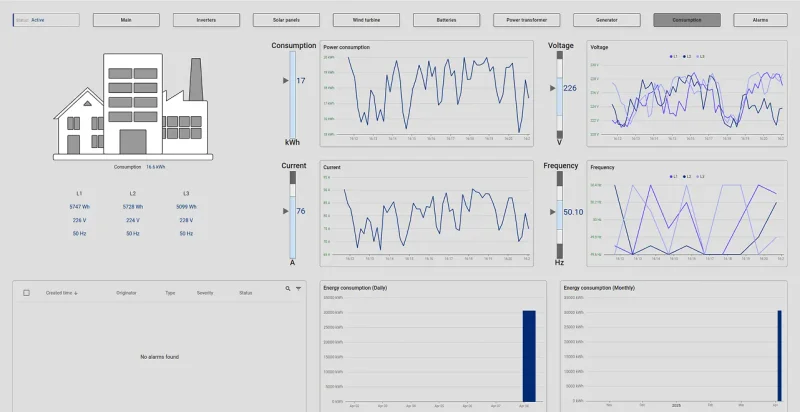
Consumption state
The consumption dashboard visualizes energy usage trends for different timeframes (daily, monthly). It includes graphs for power consumption, voltage, current, and frequency, helping operators optimize energy efficiency. The alarm section highlights any anomalies in power usage or system performance.
Alarms state
This screen provides a detailed view of all system alarms, including timestamps, severity levels, and statuses. Users can acknowledge or resolve alarms related to high vibration, speed variations, and system failures. The dashboard helps operators quickly identify and respond to critical system issues.
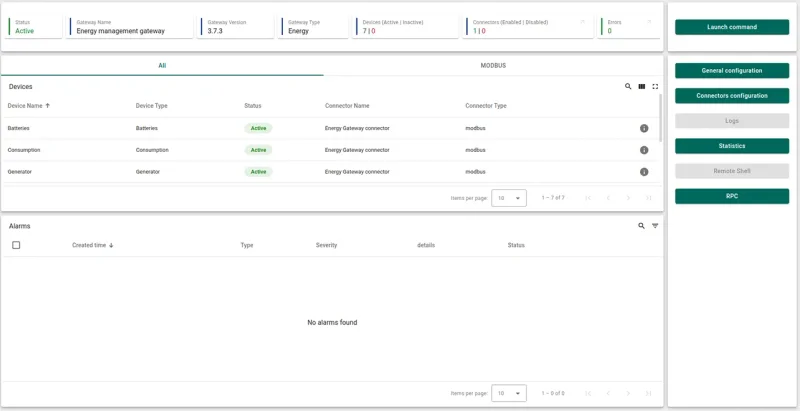
Gateway dashboard
This section provides an overview of all connected devices, showing their status, protocol (Modbus), and data communication. Operators can configure connections, monitor device health, and troubleshoot errors in real-time.


'%3e%3cpath%20fill='%23fff'%20stroke='%231A1A1A'%20d='M214.5%2031h99v99h-99z'/%3e%3ccircle%20cx='264'%20cy='80.5'%20r='34.5'%20stroke='%231A1A1A'/%3e%3ccircle%20cx='264'%20cy='62.5'%20r='3.5'%20stroke='%23727171'/%3e%3ccircle%20cx='278.5'%20cy='80.5'%20r='4'%20fill='%231A1A1A'/%3e%3ccircle%20cx='249.5'%20cy='80.5'%20r='4'%20fill='%231A1A1A'/%3e%3c/g%3e%3crect%20x='.75'%20y='39.75'%20width='158.5'%20height='158.5'%20rx='39.25'%20fill='%23F4F8FE'%20stroke='%233E9AF8'%20stroke-width='1.5'/%3e%3cg%20clip-path='url(%23b)'%20fill='%23fff'%20stroke='%231A1A1A'%3e%3cpath%20d='M30.5%2070h99v99h-99z'/%3e%3cpath%20d='M43%2084a1.5%201.5%200%200%201%201.5-1.5h32A1.5%201.5%200%200%201%2078%2084v71a1.5%201.5%200%200%201-1.5%201.5h-32A1.5%201.5%200%200%201%2043%20155V84ZM82%2084a1.5%201.5%200%200%201%201.5-1.5h32A1.5%201.5%200%200%201%20117%2084v71a1.5%201.5%200%200%201-1.5%201.5h-32A1.5%201.5%200%200%201%2082%20155V84Z'/%3e%3c/g%3e%3crect%20x='71.75'%20y='130.75'%20width='158.5'%20height='158.5'%20rx='39.25'%20fill='%23F4F8FE'%20stroke='%233E9AF8'%20stroke-width='1.5'/%3e%3crect%20x='90.205'%20y='197.905'%20width='122.59'%20height='24.19'%20rx='1.025'%20fill='%23fff'%20stroke='%231A1A1A'%20stroke-width='.41'/%3e%3ccircle%20cx='185.94'%20cy='210.308'%20r='2.255'%20fill='%23fff'%20stroke='%231A1A1A'%20stroke-width='.41'/%3e%3ccircle%20cx='107.22'%20cy='210.308'%20r='2.255'%20fill='%23fff'%20stroke='%231A1A1A'%20stroke-width='.41'/%3e%3ccircle%20cx='195.78'%20cy='210.308'%20r='2.255'%20fill='%23fff'%20stroke='%231A1A1A'%20stroke-width='.41'/%3e%3ccircle%20cx='117.06'%20cy='210.308'%20r='2.255'%20fill='%23fff'%20stroke='%231A1A1A'%20stroke-width='.41'/%3e%3ccircle%20cx='131.82'%20cy='210.41'%20r='2.05'%20fill='%23198038'/%3e%3cpath%20d='M139.825%20210.381c0%20.472-.085.88-.255%201.223-.17.344-.404.609-.701.795-.297.187-.636.28-1.018.28-.381%200-.721-.093-1.018-.28a1.918%201.918%200%200%201-.701-.795c-.17-.343-.255-.751-.255-1.223%200-.471.085-.879.255-1.223a1.93%201.93%200%200%201%20.701-.795%201.88%201.88%200%200%201%201.018-.279c.382%200%20.721.093%201.018.279.297.187.531.452.701.795.17.344.255.752.255%201.223Zm-.524%200c0-.387-.064-.714-.194-.98a1.404%201.404%200%200%200-.522-.605%201.352%201.352%200%200%200-.734-.206c-.271%200-.516.069-.736.206a1.43%201.43%200%200%200-.522.605c-.128.266-.192.593-.192.98%200%20.388.064.714.192.981.13.266.304.468.522.605.22.137.465.205.736.205.271%200%20.516-.068.734-.205a1.41%201.41%200%200%200%20.522-.605c.13-.267.194-.593.194-.981Zm4.982-2.236v4.473h-.524l-2.438-3.512h-.043v3.512h-.542v-4.473h.524l2.446%203.52h.044v-3.52h.533Z'%20fill='%231A1A1A'/%3e%3cpath%20d='M90%20210h14.965M198.035%20210H213'%20stroke='%231A1A1A'%20stroke-width='1.23'/%3e%3cpath%20d='M111.115%20189.5h-1.23s-1.32%205.346-1.948%208.815c-.676%203.738-1.332%209.635-1.332%209.635h1.23s.554-5.487%201.23-9.225c.627-3.469%202.05-9.225%202.05-9.225ZM191.885%20189.5h1.23s1.32%205.346%201.948%208.815c.676%203.738%201.332%209.635%201.332%209.635h-1.23s-.554-5.487-1.23-9.225c-.627-3.469-2.05-9.225-2.05-9.225ZM111.115%20230.5h-1.23s1.611-5.545%202.87-9.02c1.296-3.578%203.69-9.02%203.69-9.02h1.23s-2.394%205.442-3.69%209.02c-1.259%203.475-2.87%209.02-2.87%209.02ZM191.885%20230.5h1.23s-1.611-5.545-2.87-9.02c-1.296-3.578-3.69-9.02-3.69-9.02h-1.23s2.394%205.442%203.69%209.02c1.259%203.475%202.87%209.02%202.87%209.02Z'%20fill='%231A1A1A'/%3e%3cdefs%3e%3cclipPath%20id='a'%3e%3cpath%20fill='%23fff'%20transform='translate(214%2030.5)'%20d='M0%200h100v100H0z'/%3e%3c/clipPath%3e%3cclipPath%20id='b'%3e%3cpath%20fill='%23fff'%20transform='translate(30%2069.5)'%20d='M0%200h100v100H0z'/%3e%3c/clipPath%3e%3c/defs%3e%3c/svg%3e)
'%20fill='%23F4F8FE'%20stroke='%233E9AF8'%20stroke-width='1.5'/%3e%3cg%20clip-path='url(%23a)'%3e%3cpath%20d='M251%20269.744v-41.4c0-10.272%208.328-18.6%2018.6-18.6H311'%20stroke='%231A1A1A'%20stroke-width='3.6'/%3e%3c/g%3e%3crect%20x='103.75'%20y='1.006'%20width='158.5'%20height='158.5'%20rx='39.25'%20fill='%23F4F8FE'%20stroke='%233E9AF8'%20stroke-width='1.5'/%3e%3cg%20clip-path='url(%23b)'%3e%3cpath%20fill='%23F4F8FE'%20d='M123%2020.256h120v120H123z'/%3e%3cpath%20d='M243%2080.256h-51a9%209%200%200%200-9%209v51M123%2080.256h51a9%209%200%200%201%209%209v51M243%2080.256h-51a9%209%200%200%201-9-9v-51M123%2080.256h51a9%209%200%200%200%209-9v-51'%20stroke='%231A1A1A'%20stroke-width='3.6'/%3e%3cpath%20d='M175.2%2080.256h15.6s-7.8%200-7.8%208.4c0-8.4-7.8-8.4-7.8-8.4ZM175.2%2080.256h15.6s-7.8%200-7.8-8.4c0%208.4-7.8%208.4-7.8%208.4Z'%20fill='%231A1A1A'/%3e%3cpath%20d='M190.8%2080.256h-15.6m15.6%200s-7.8%200-7.8%208.4c0-8.4-7.8-8.4-7.8-8.4m15.6%200s-7.8%200-7.8-8.4c0%208.4-7.8%208.4-7.8%208.4'%20stroke='%231A1A1A'%20stroke-width='1.2'/%3e%3c/g%3e%3crect%20x='.75'%20y='68.712'%20width='158.5'%20height='158.5'%20rx='39.25'%20fill='%23F4F8FE'%20stroke='%233E9AF8'%20stroke-width='1.5'/%3e%3cpath%20fill='%23F4F8FE'%20d='M140%2087.962v120H20v-120z'/%3e%3cpath%20d='m62.6%20147.962%2034.8-17.4v34.8l-34.8-17.4Z'%20fill='%231A1A1A'/%3e%3cpath%20d='M140%20147.962H20'%20stroke='%231A1A1A'%20stroke-width='3.6'/%3e%3cdefs%3e%3cclipPath%20id='a'%3e%3cpath%20fill='%23fff'%20transform='matrix(1%200%200%20-1%20191%20269.744)'%20d='M0%200h120v120H0z'/%3e%3c/clipPath%3e%3cclipPath%20id='b'%3e%3cpath%20fill='%23fff'%20transform='translate(123%2020.256)'%20d='M0%200h120v120H0z'/%3e%3c/clipPath%3e%3c/defs%3e%3c/svg%3e)