
Time Window
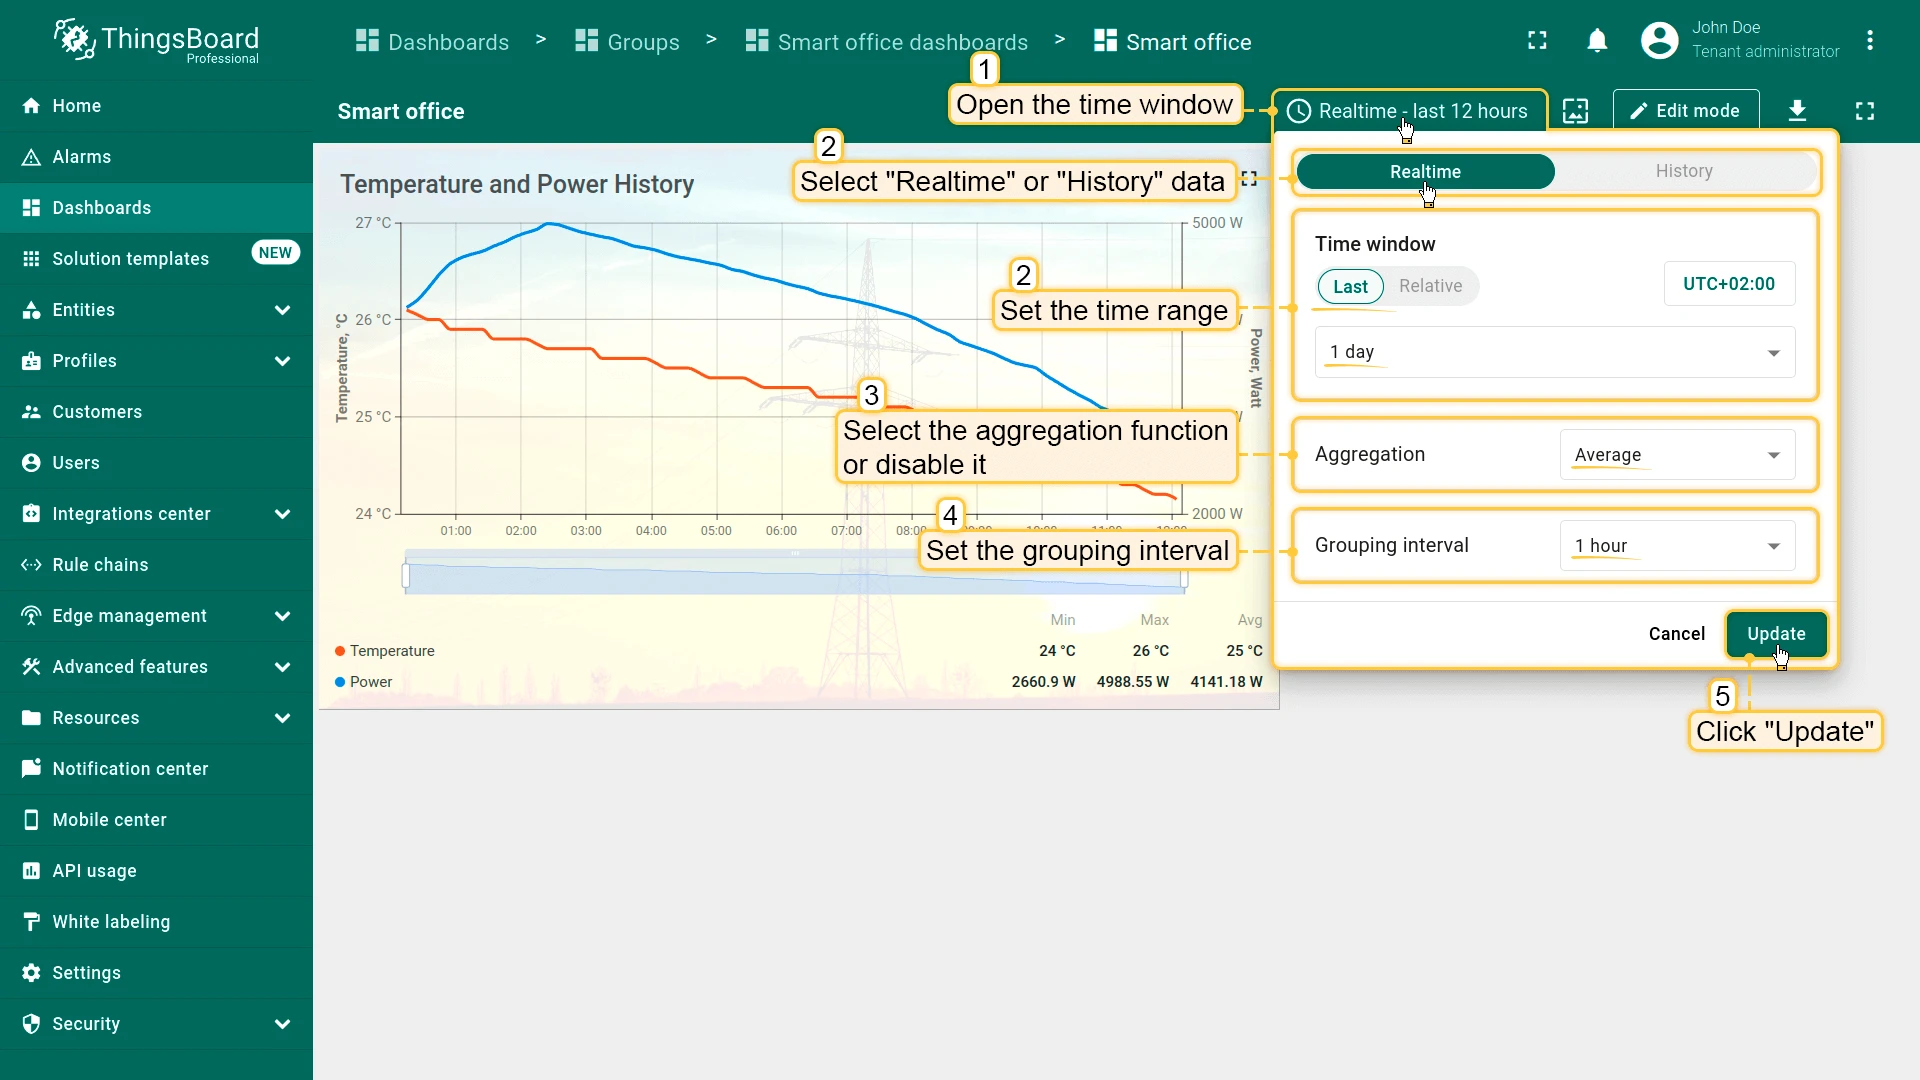
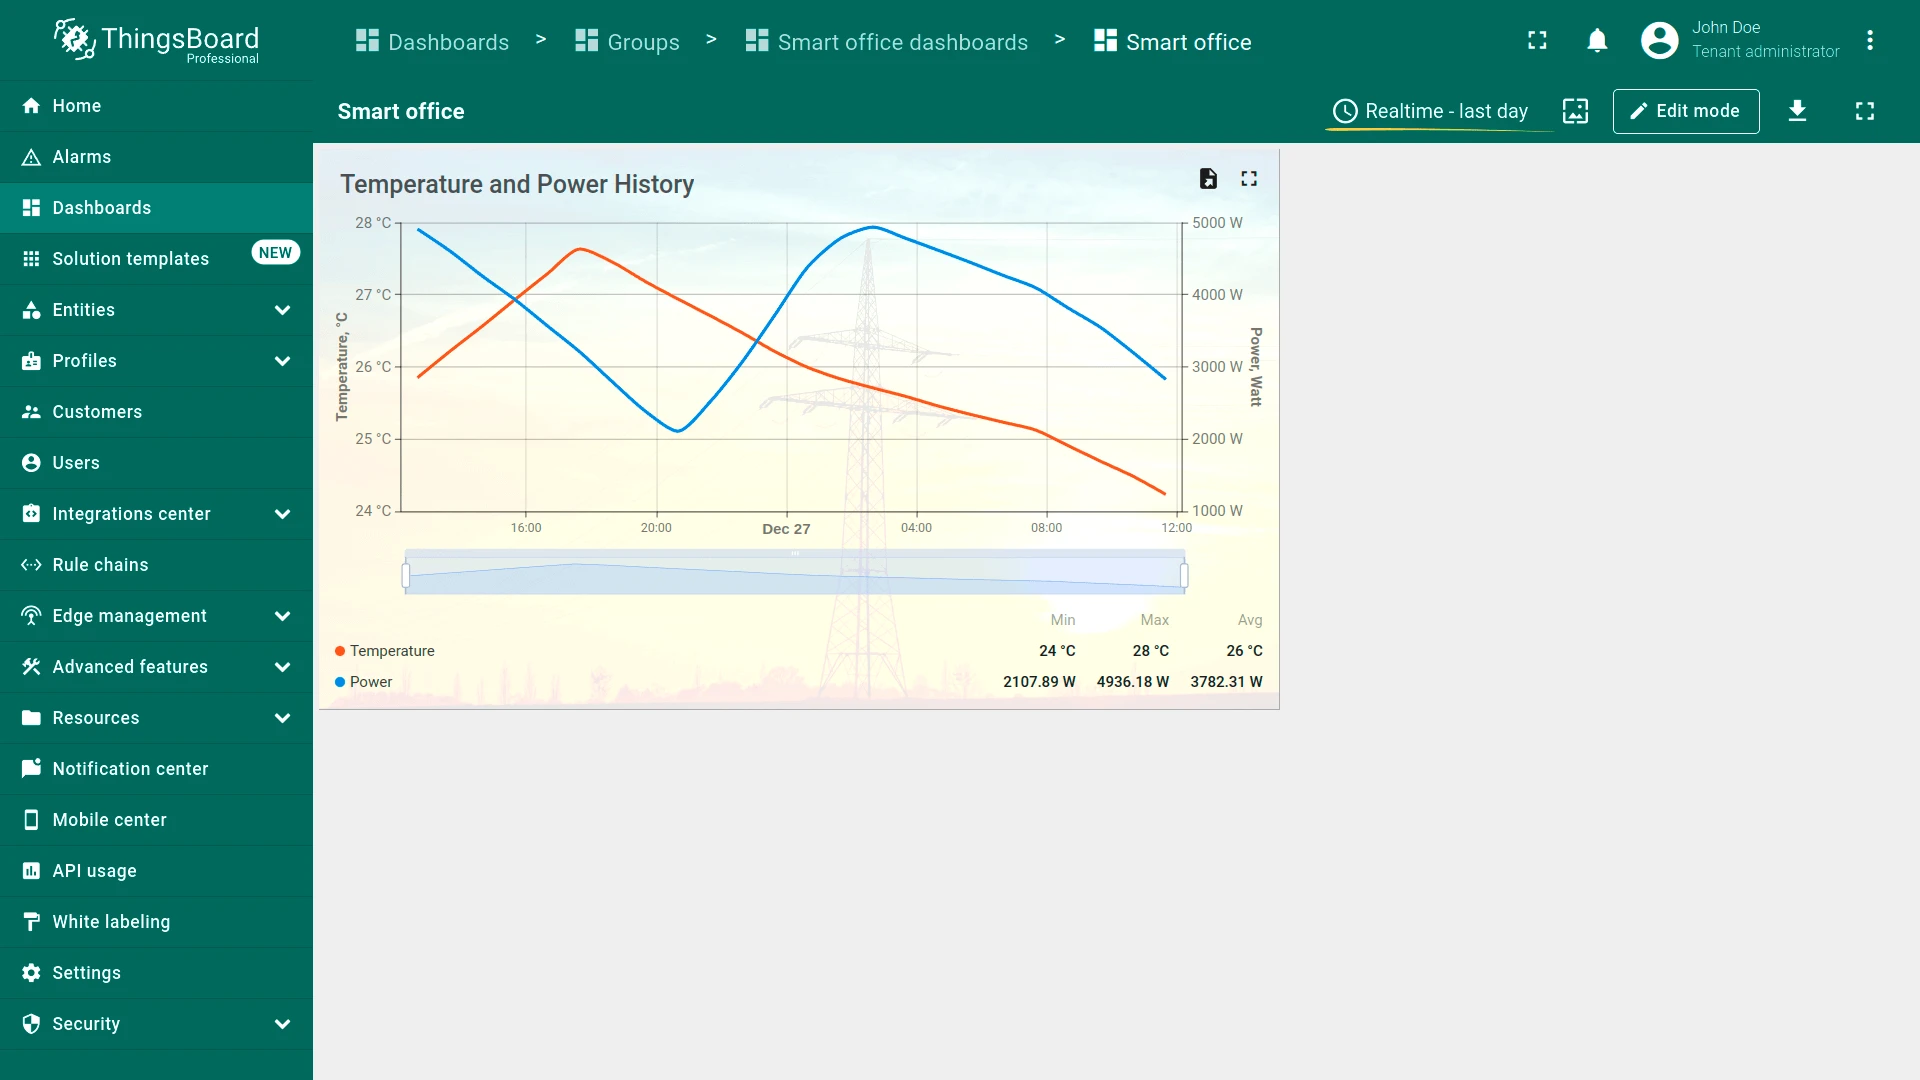
The Time window defines the temporal scope and aggregation rules applied to time-series telemetry displayed on dashboards.
Time window parameters can be configured at:
- Dashboard level — global time window applied to all supported widgets.
- Widget level — local override for a specific widget.
Video Tutorial
Section titled “Video Tutorial”Watch this video to learn how to configure Time Window settings, switch between Real-time and History modes, and adjust aggregation and grouping intervals.
Configuration Levels
Section titled “Configuration Levels”Dashboard Time Window
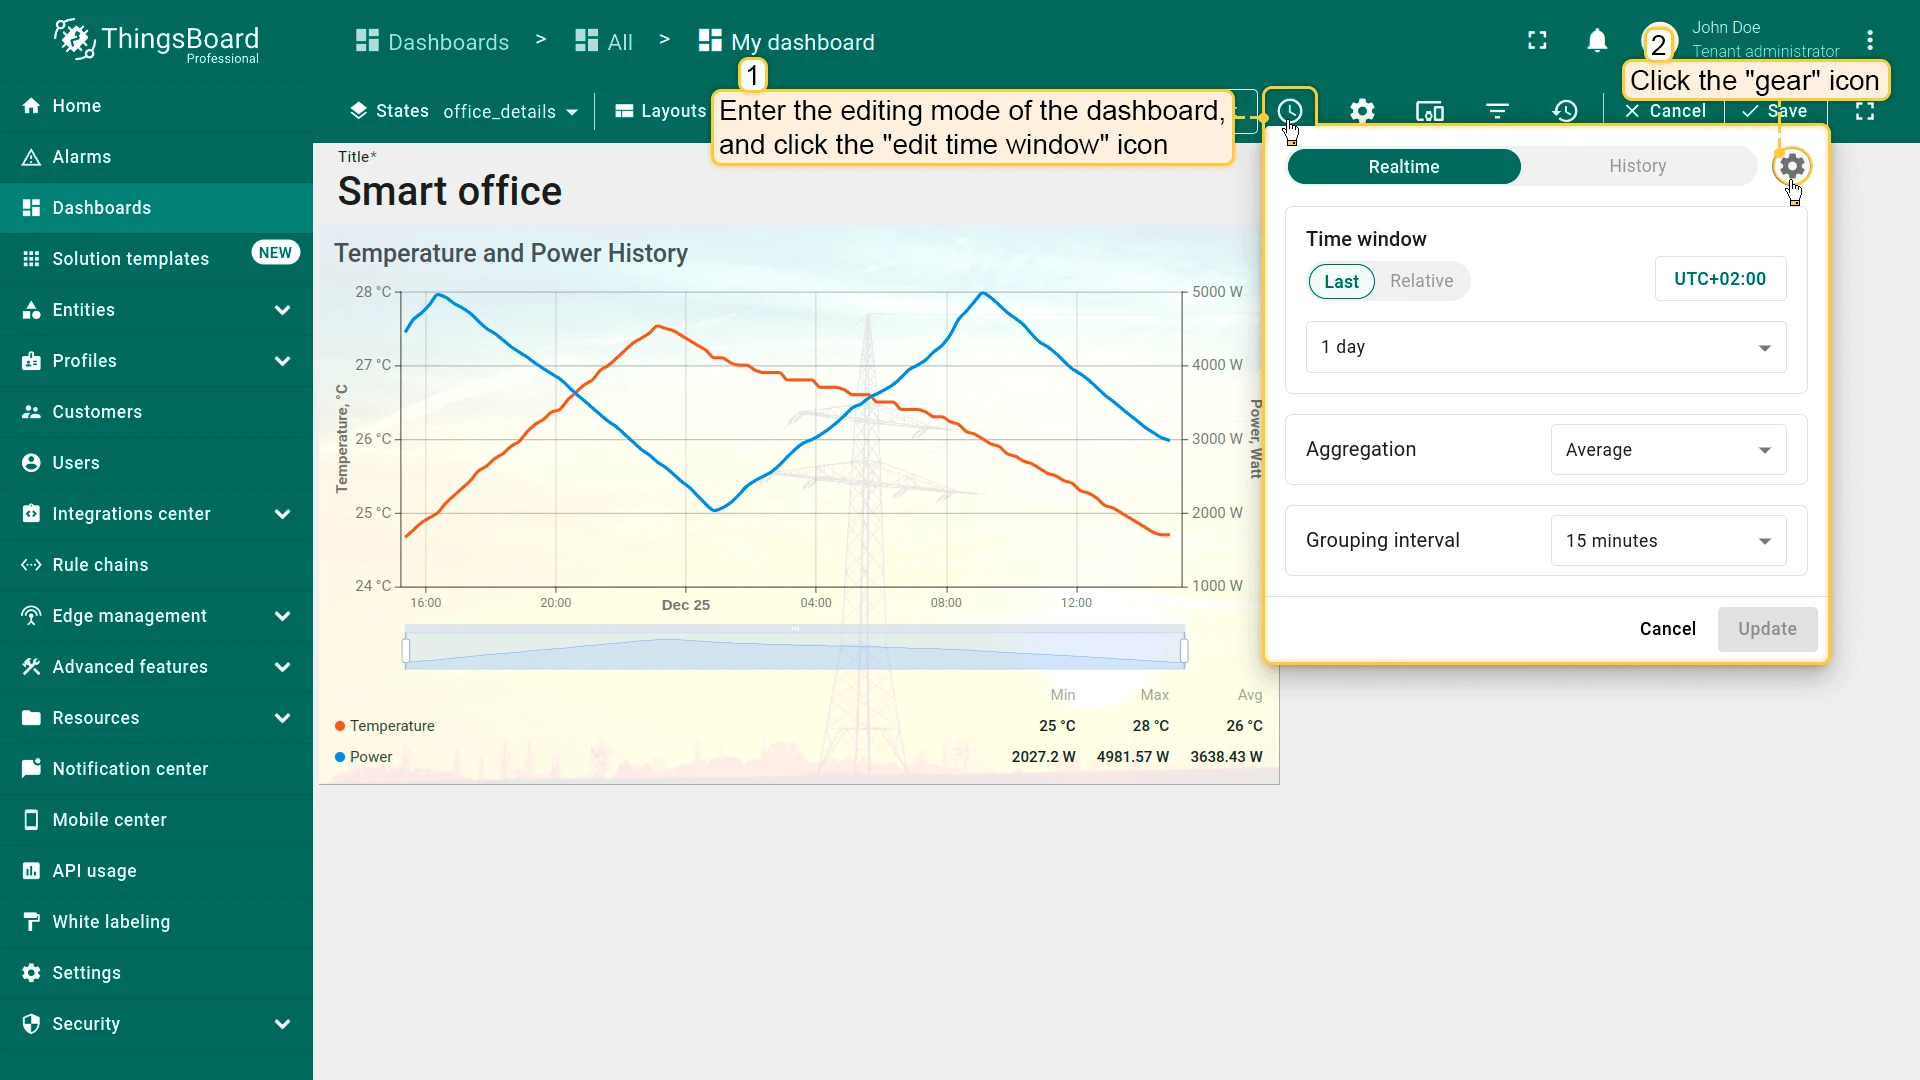
Section titled “Dashboard Time Window”The dashboard time window is configured in edit mode via the Edit time window dialog and saved with the dashboard.
Changes made in view mode are temporary and reset to the last saved configuration after a page reload.
Widget Time Window
Section titled “Widget Time Window”Each time-series widget can use either the dashboard time window or its own configuration.
To configure a custom time window, enable Use widget time window in the widget settings.
Widget-level configuration allows:
- Defining a custom time window
- Independent aggregation and grouping interval settings
When a widget-level time window is enabled, the widget ignores the dashboard-level configuration.
Mode Selection
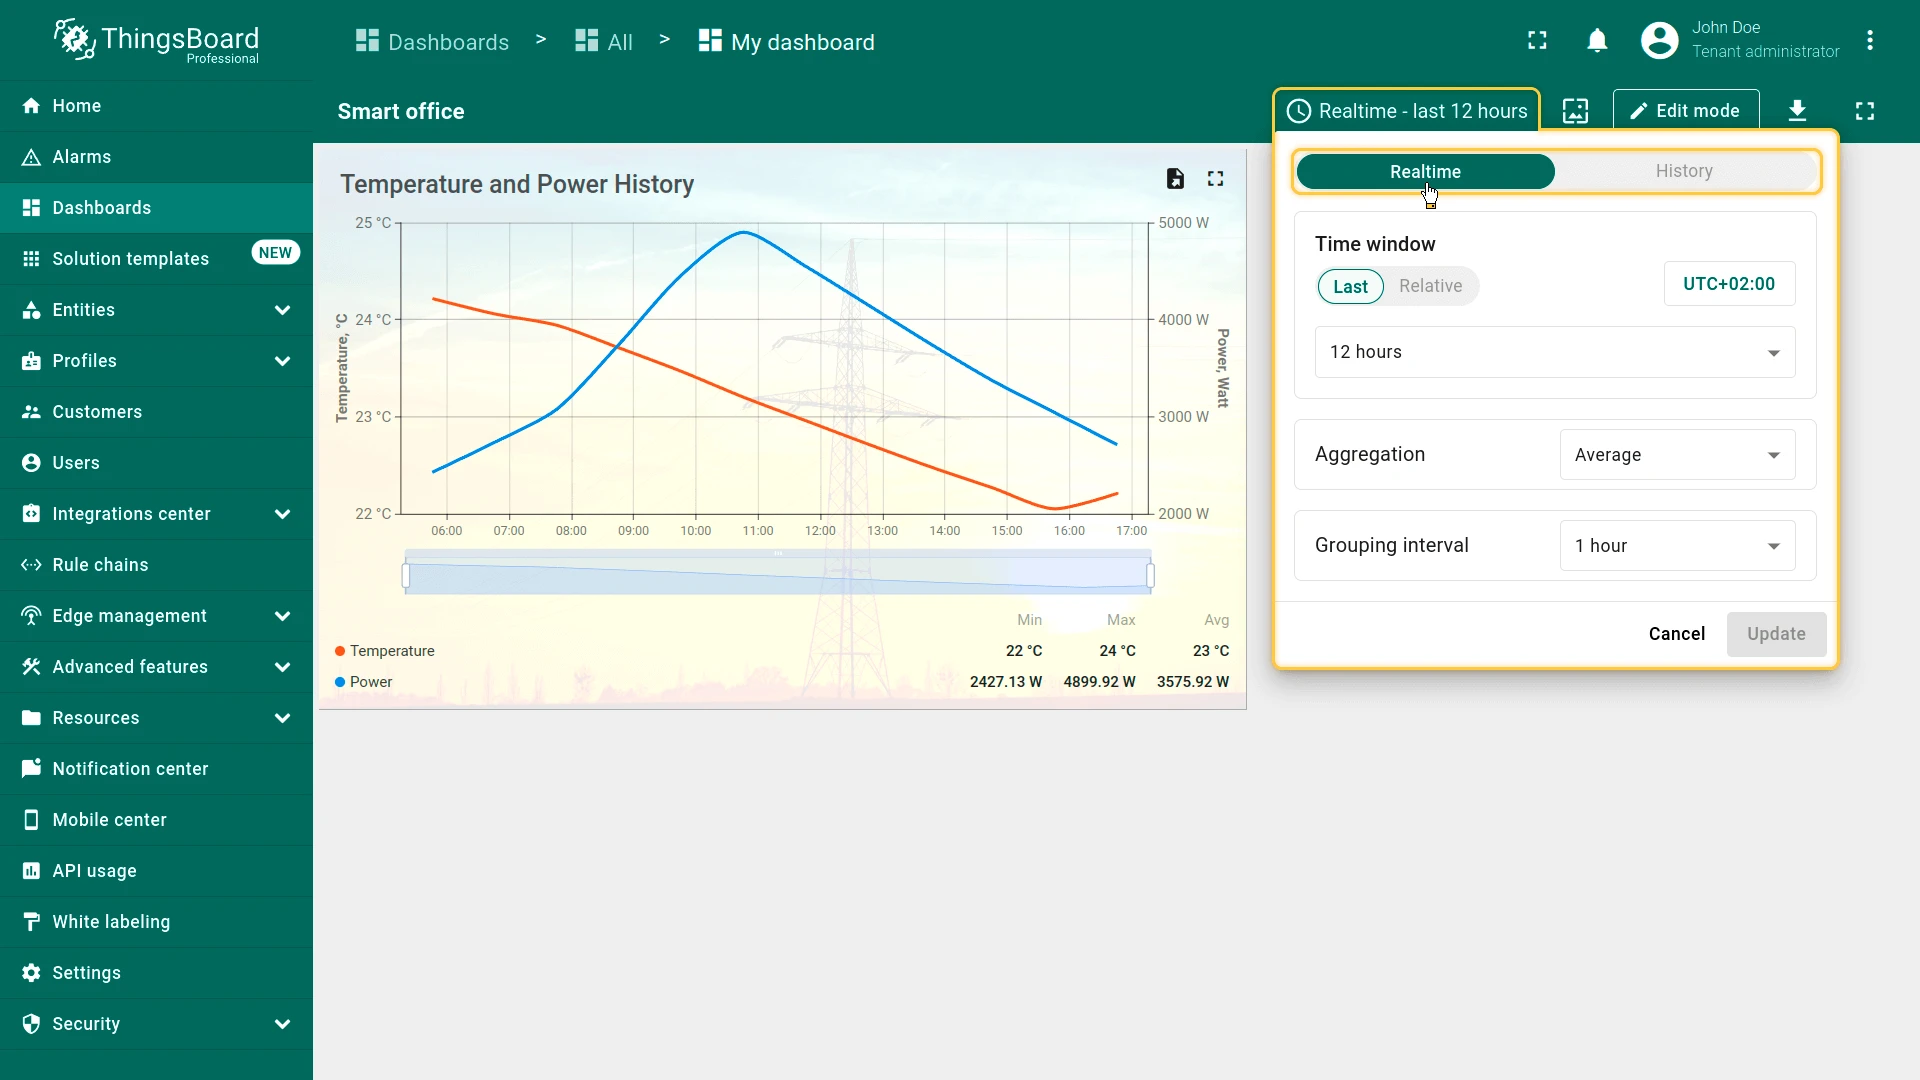
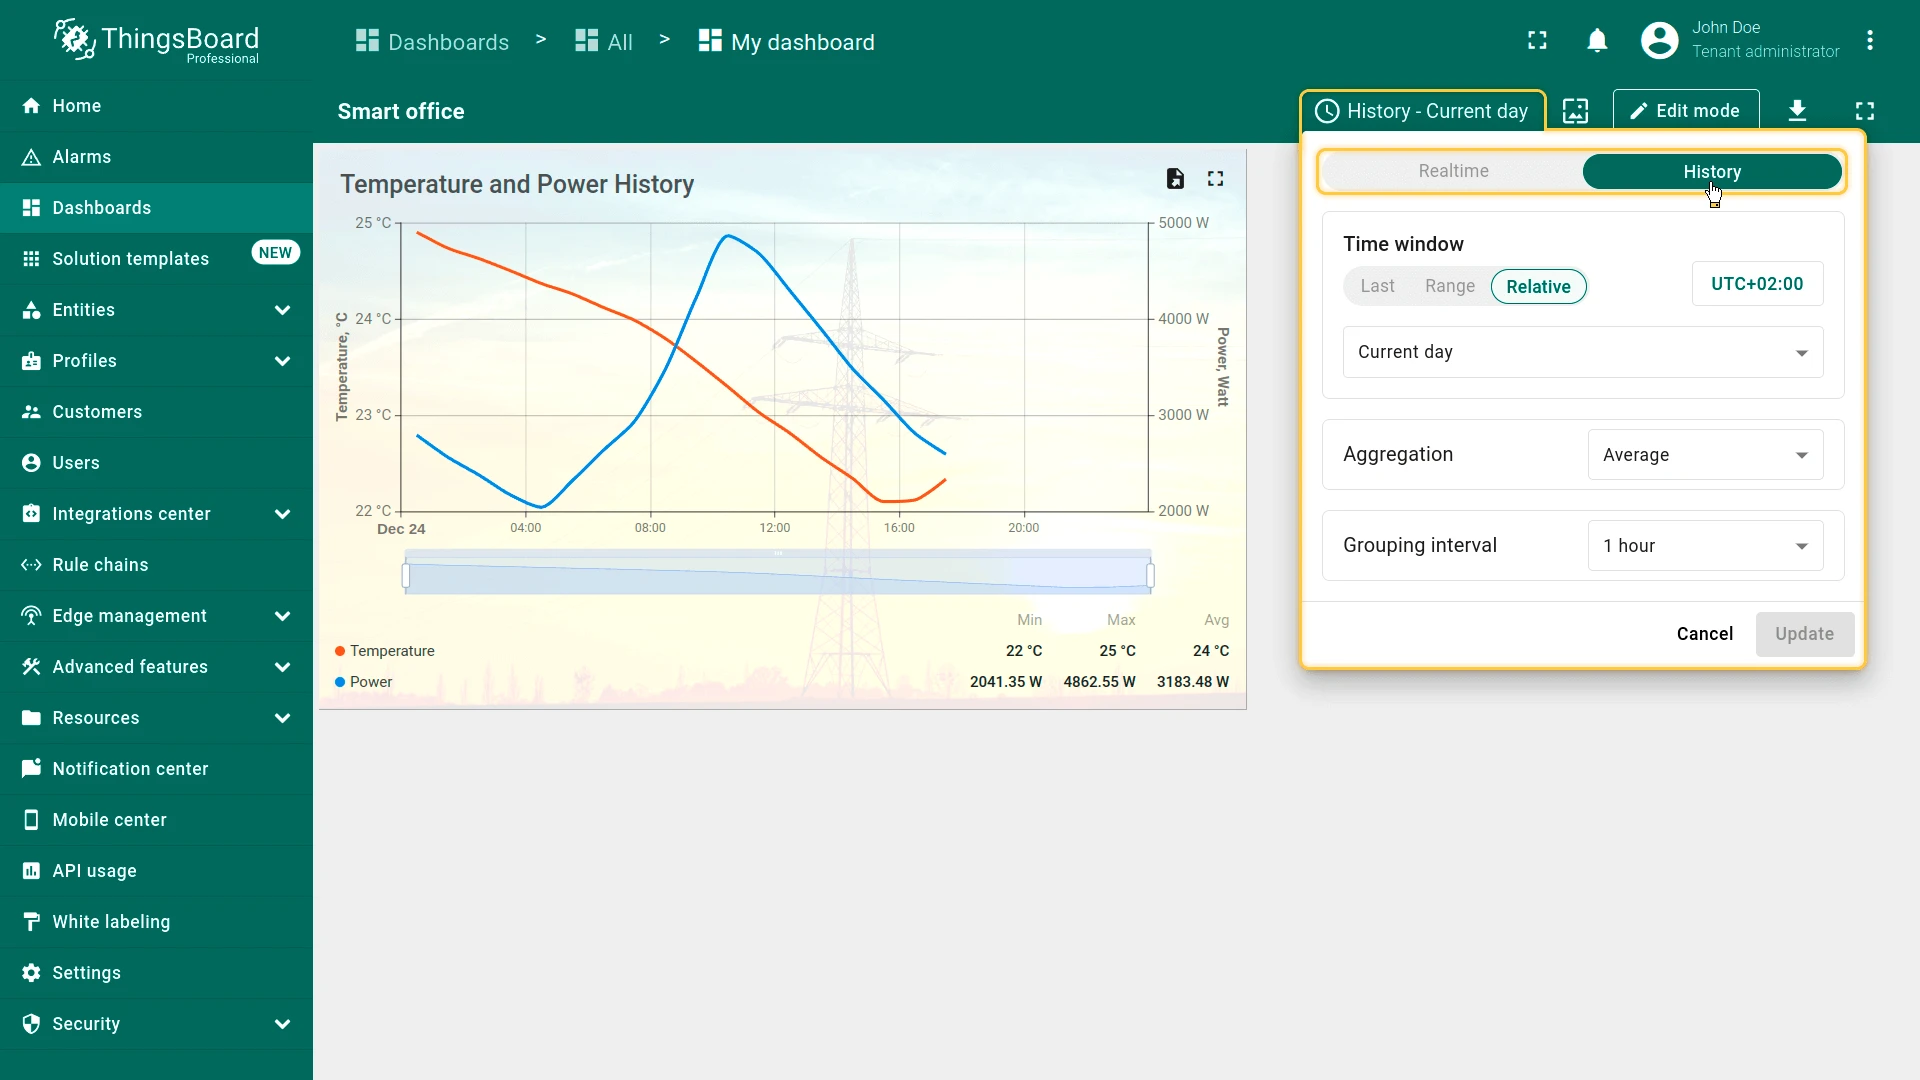
Section titled “Mode Selection”The time window dialog supports two data retrieval modes:
- Real-time — widgets continuously receive updates from the server for the current time range.
- History — widgets load data once for a fixed period; no live updates.
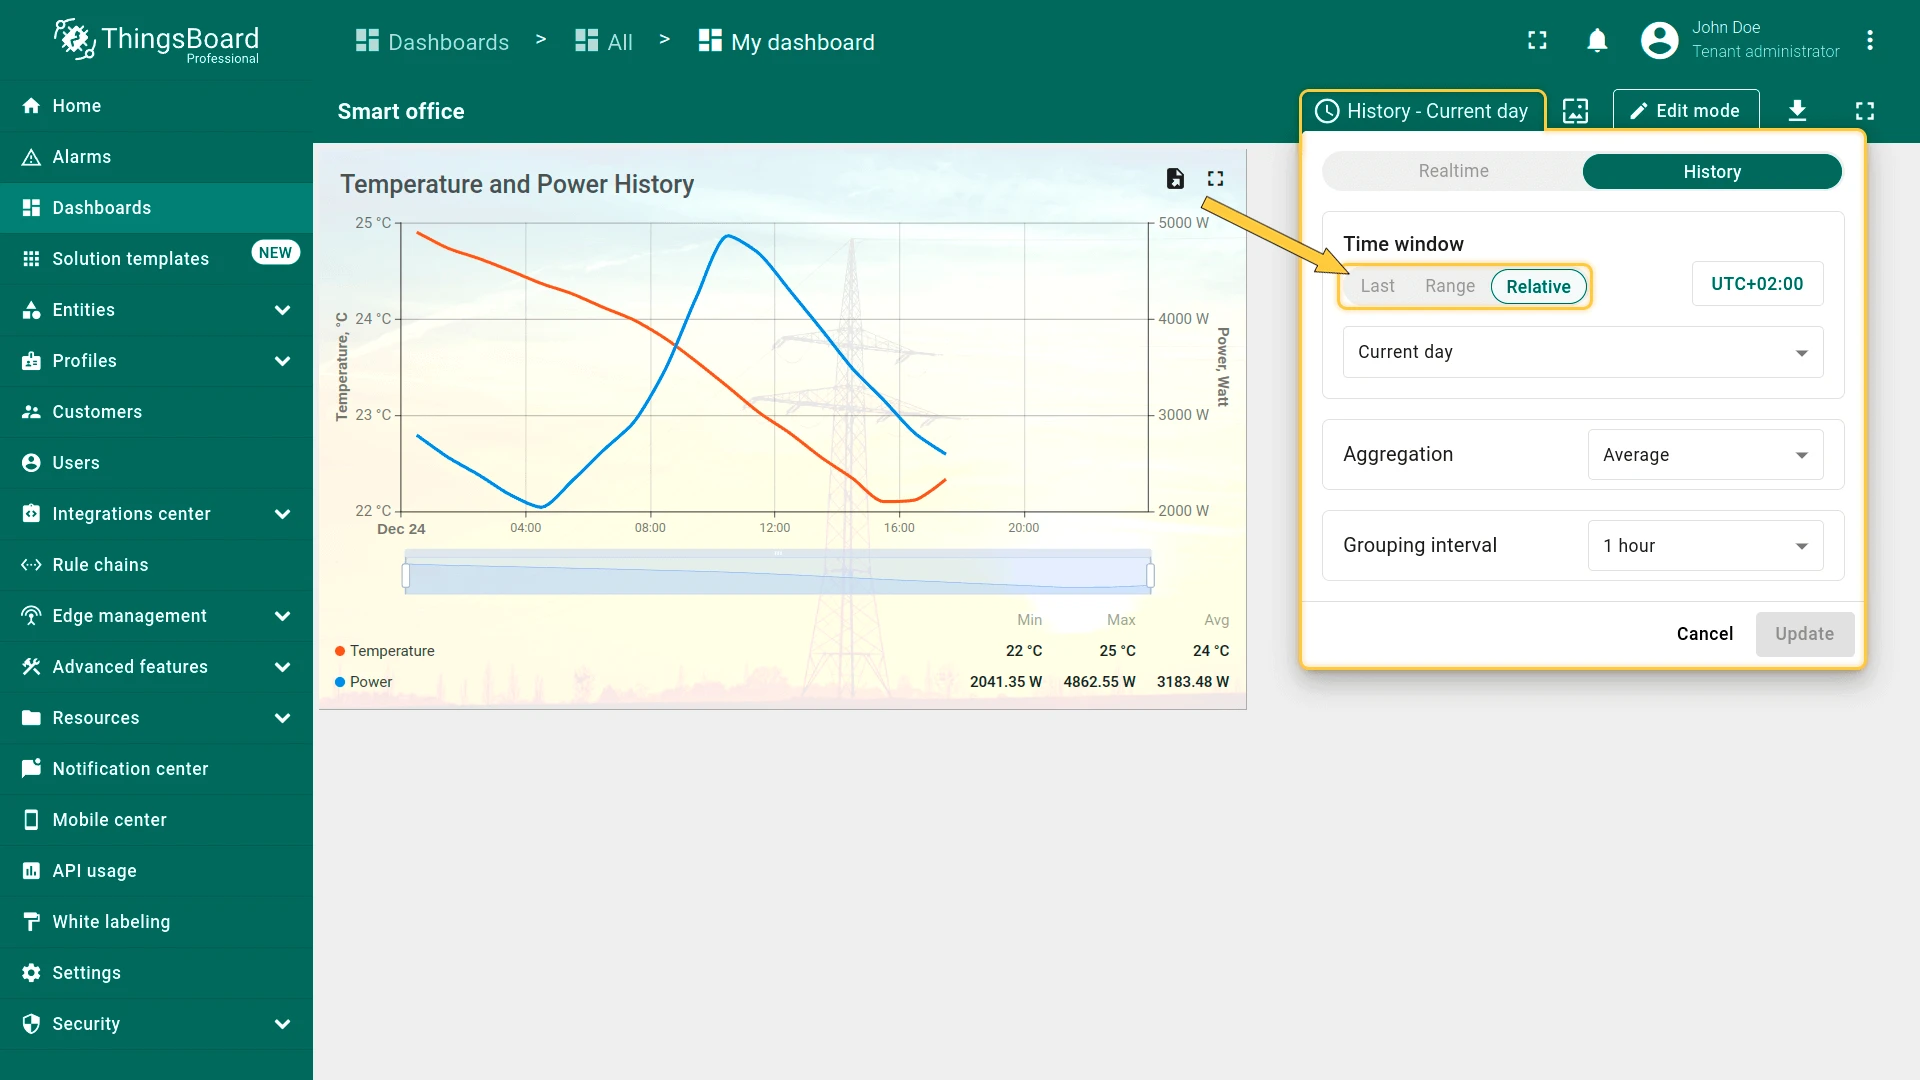
Interval Types
Section titled “Interval Types”| Type | Description | Mode Availability | Behavior | Example |
|---|---|---|---|---|
| Last | Rolling interval counted backward from the current time. | Realtime, History | In Realtime mode, continuously shifts forward. In History mode, fixed period ending at current time. | Last 5 minutes, Last 1 hour |
| Range | Explicit start and end timestamps. | History only | Fixed interval. Does not update automatically. | 2026-03-01 08:00 – 2026-03-01 12:00 |
| Relative | Calendar-aligned interval. | Realtime, History | Aligned to calendar boundaries. | Current day, Previous month |
Aggregation
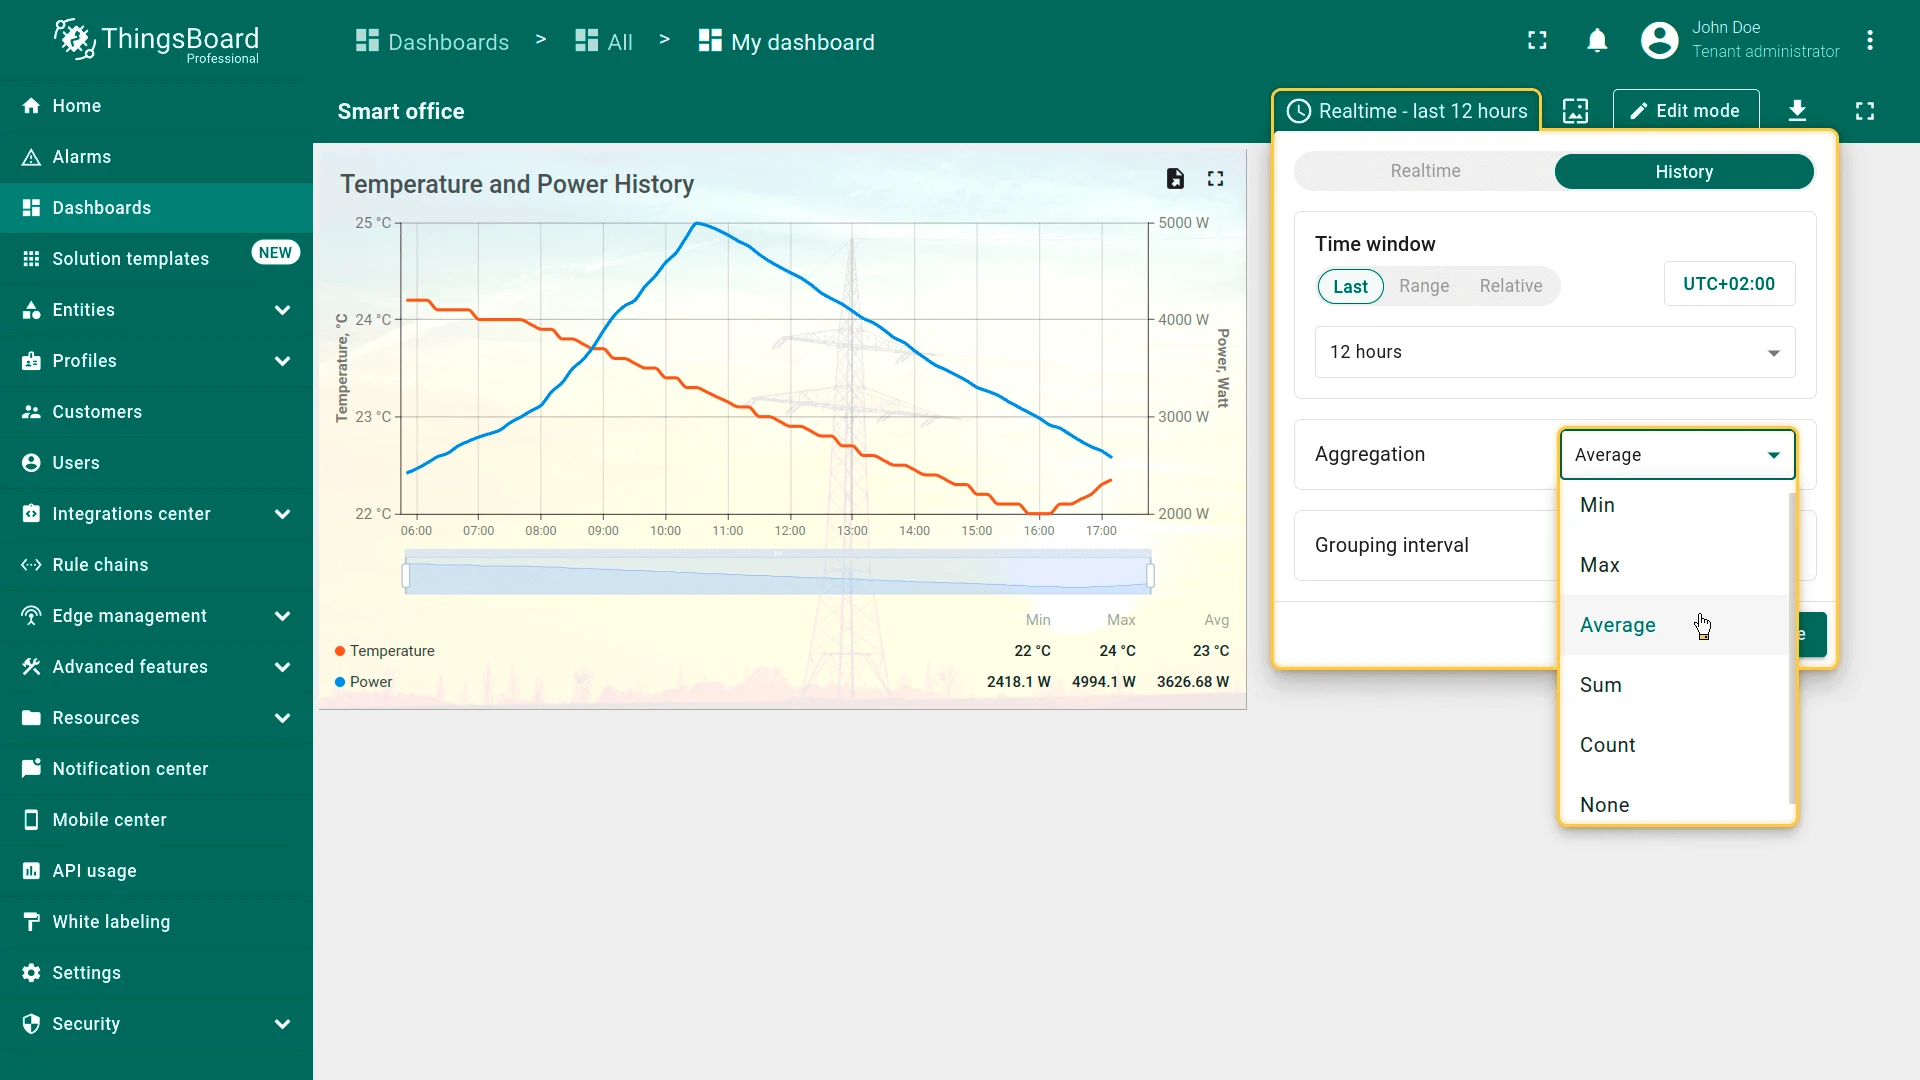
Section titled “Aggregation”Defines how telemetry values are reduced within each grouping interval, lowering data volume and improving performance.
| Function | Description |
|---|---|
| None | Raw telemetry values |
| Min | Minimum value per interval |
| Max | Maximum value per interval |
| Average | Arithmetic mean |
| Sum | Sum of values |
| Count | Number of records |
Grouping Interval
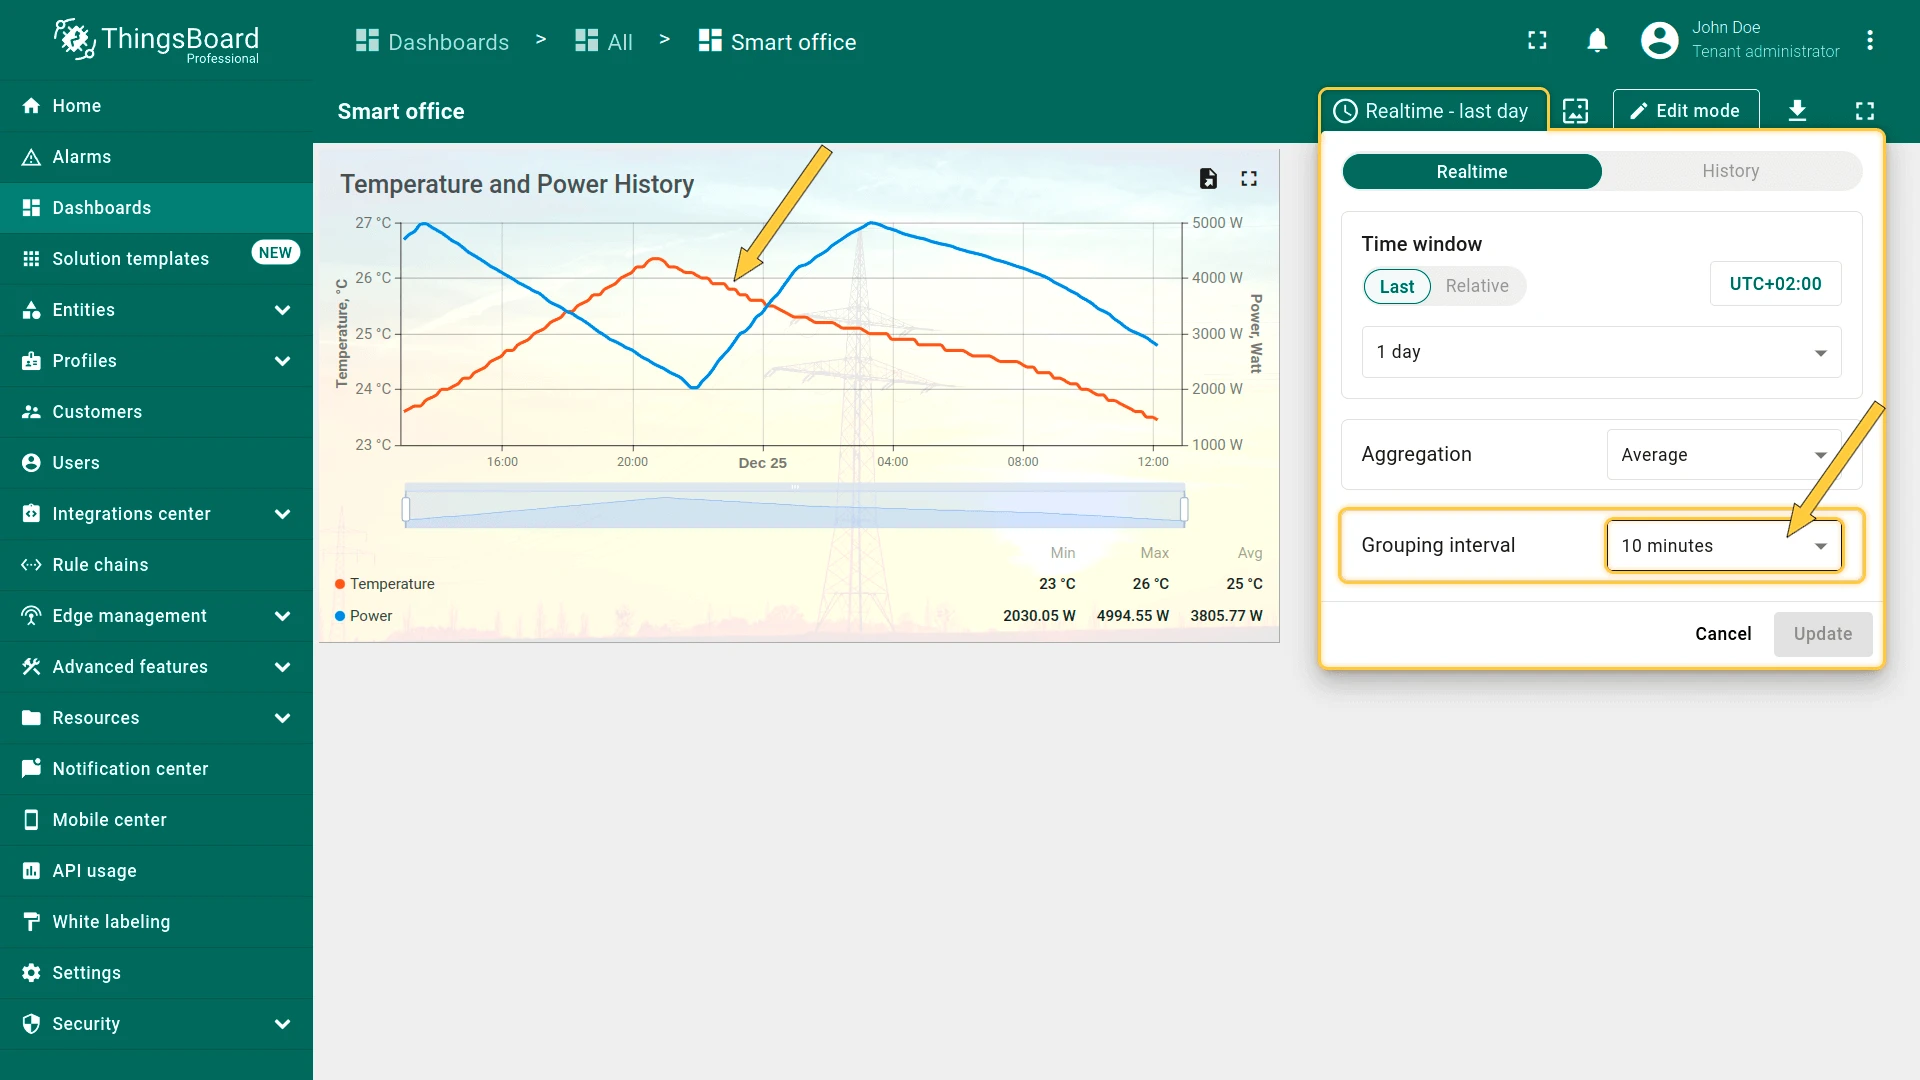
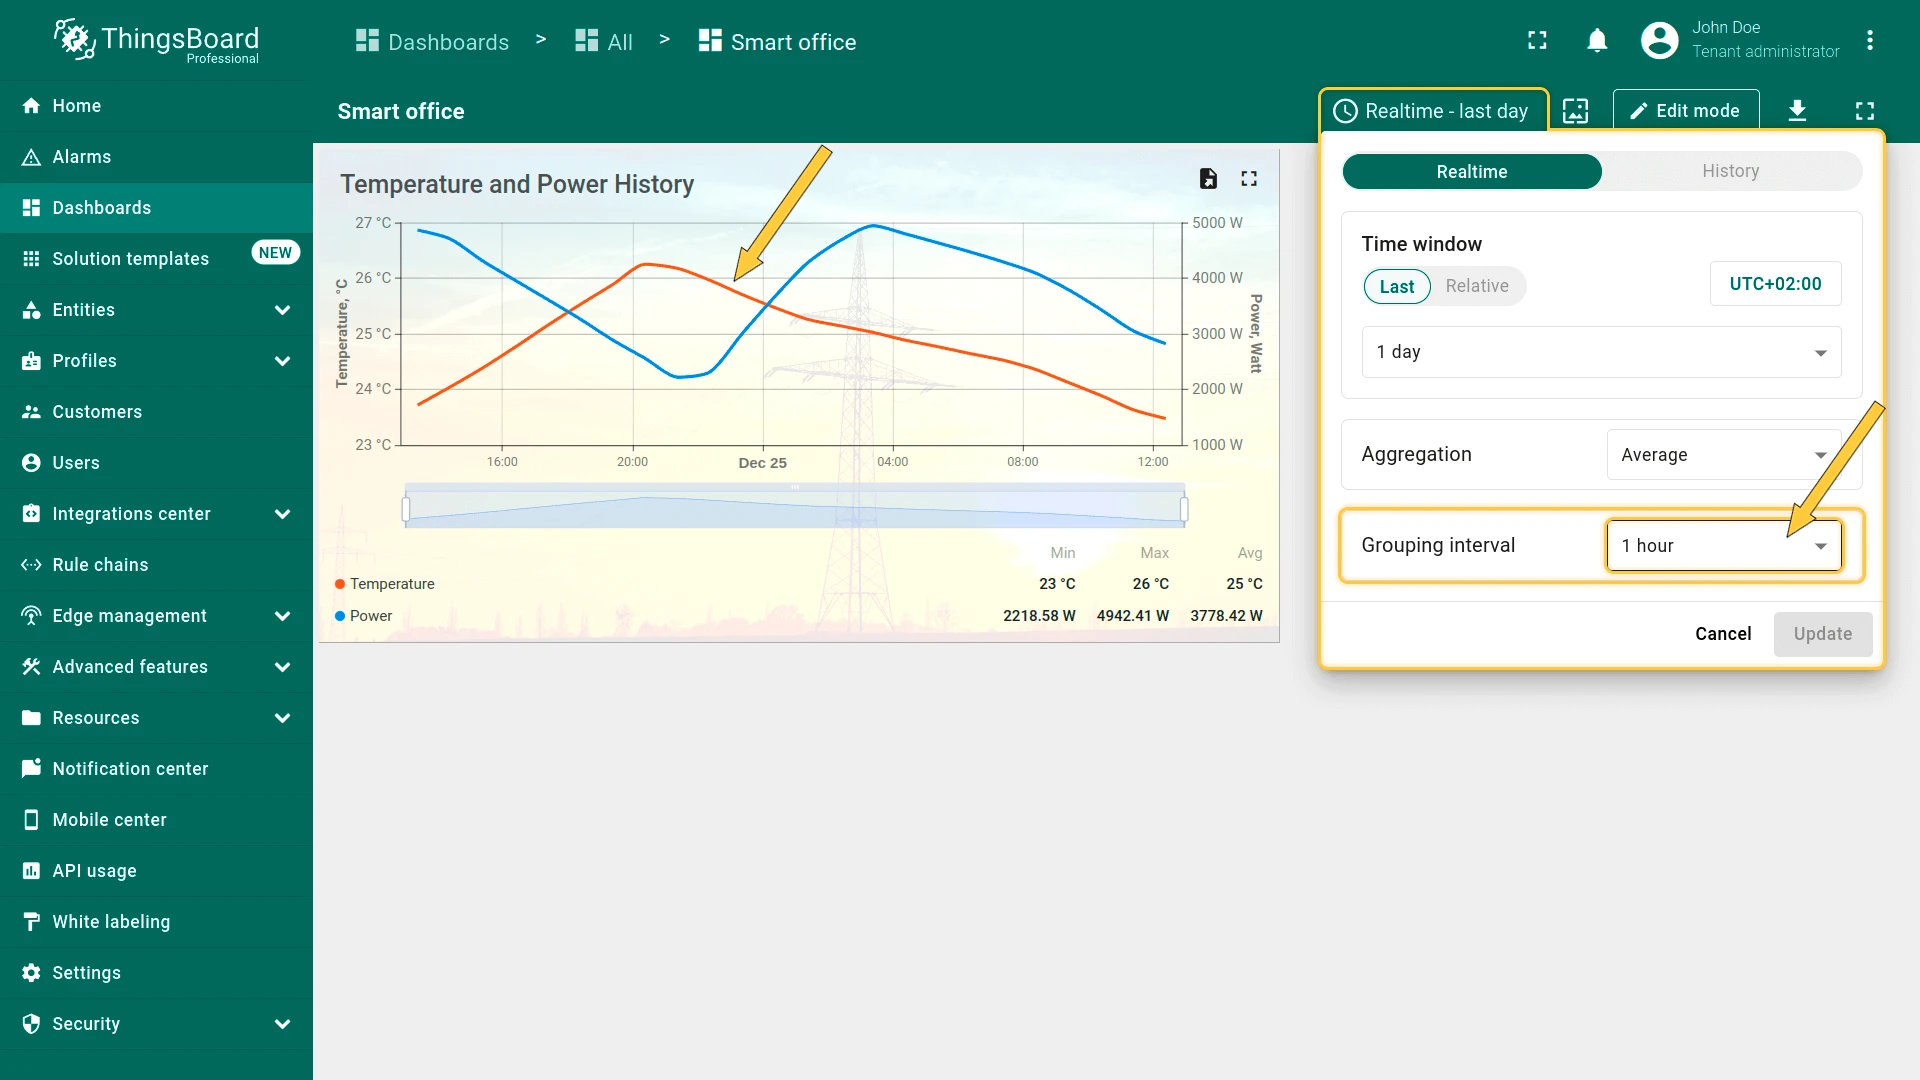
Section titled “Grouping Interval”Defines the size of time buckets used for aggregation. Each bucket produces one aggregated value.
Example: with a time window of Last 1 hour, a grouping interval of 10 minutes, and Average aggregation — the widget receives 6 aggregated values (one per 10-minute bucket).
- Smaller intervals ⇾ higher granularity, more data points.
- Larger intervals ⇾ smoother trends, reduced load.
The grouping interval is either calculated automatically based on the selected window and widget resolution, or defined explicitly in the widget settings.
Max Values
Section titled “Max Values”Defines the maximum number of telemetry points returned.
Example:
Max values = 50000Purpose:
- Prevent excessive data retrieval
- Protect browser performance
- Limit memory usage
Especially important when Aggregation = None.
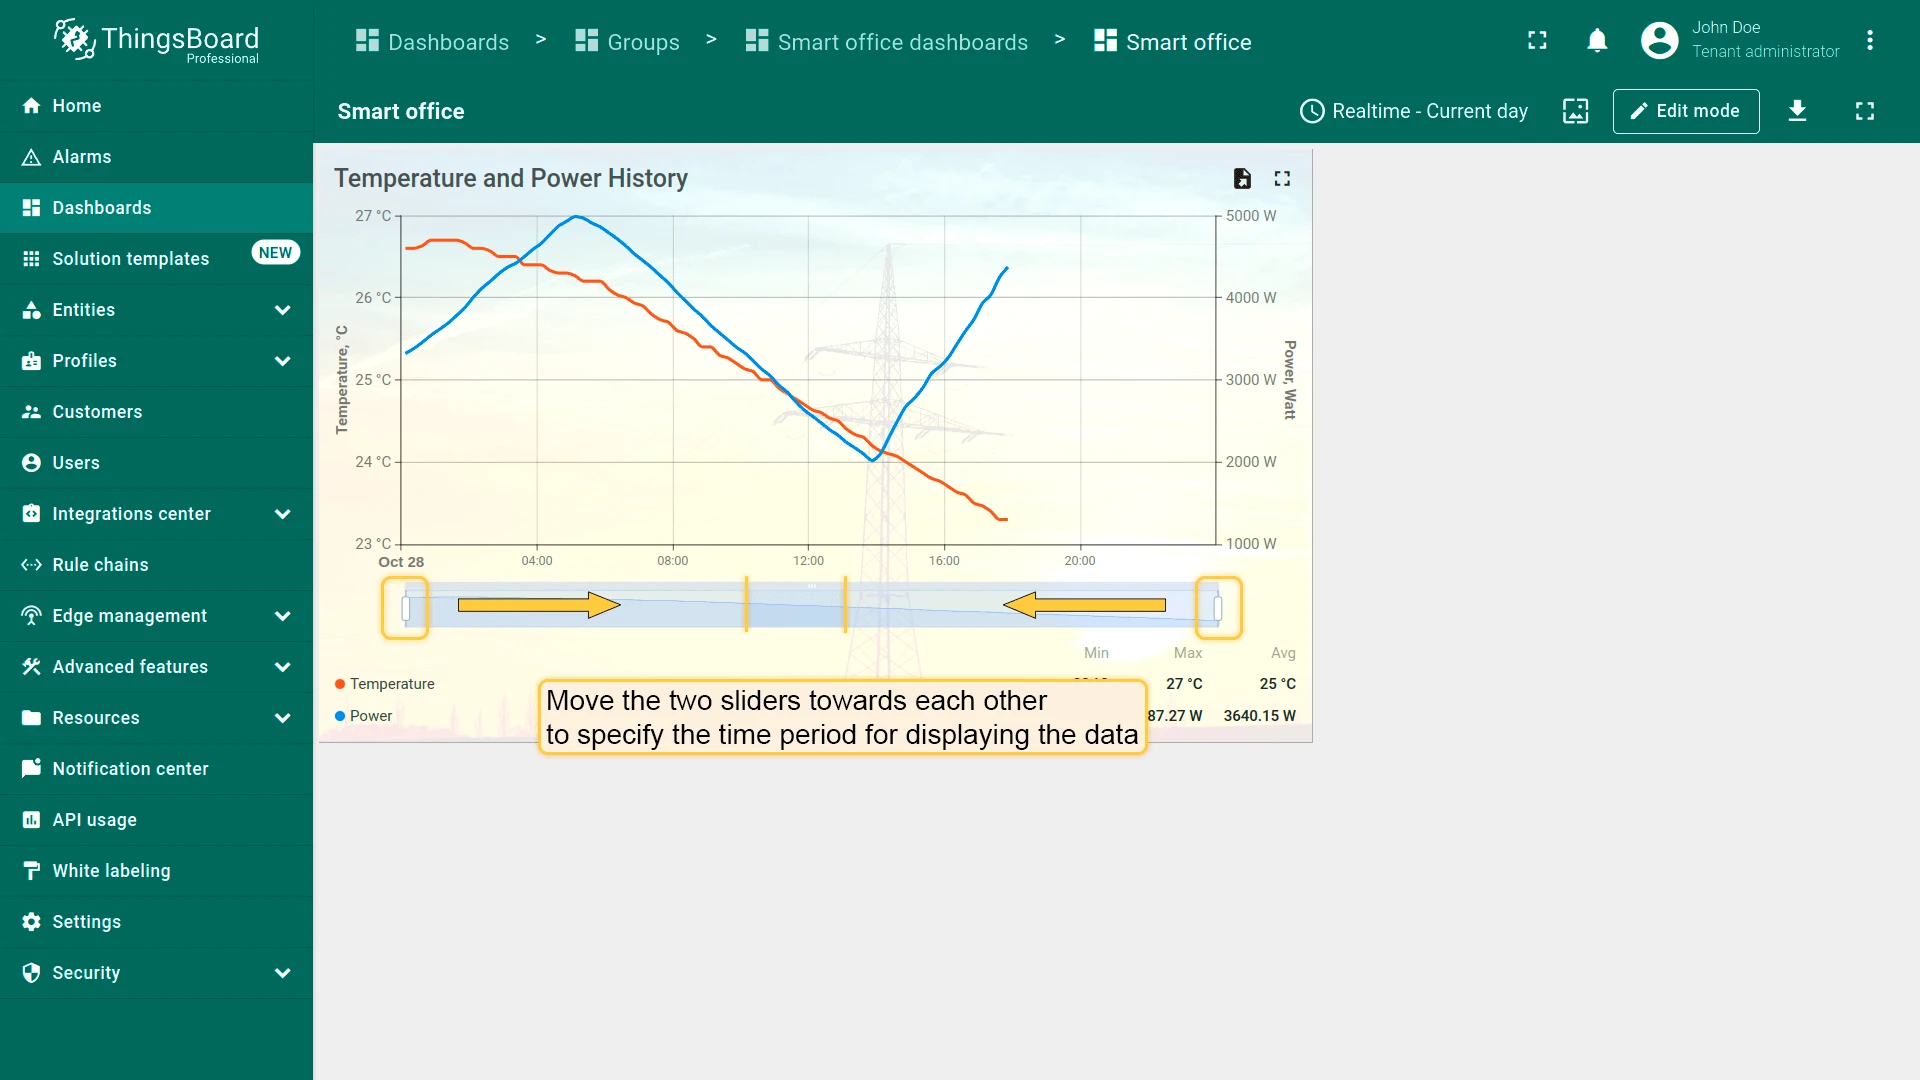
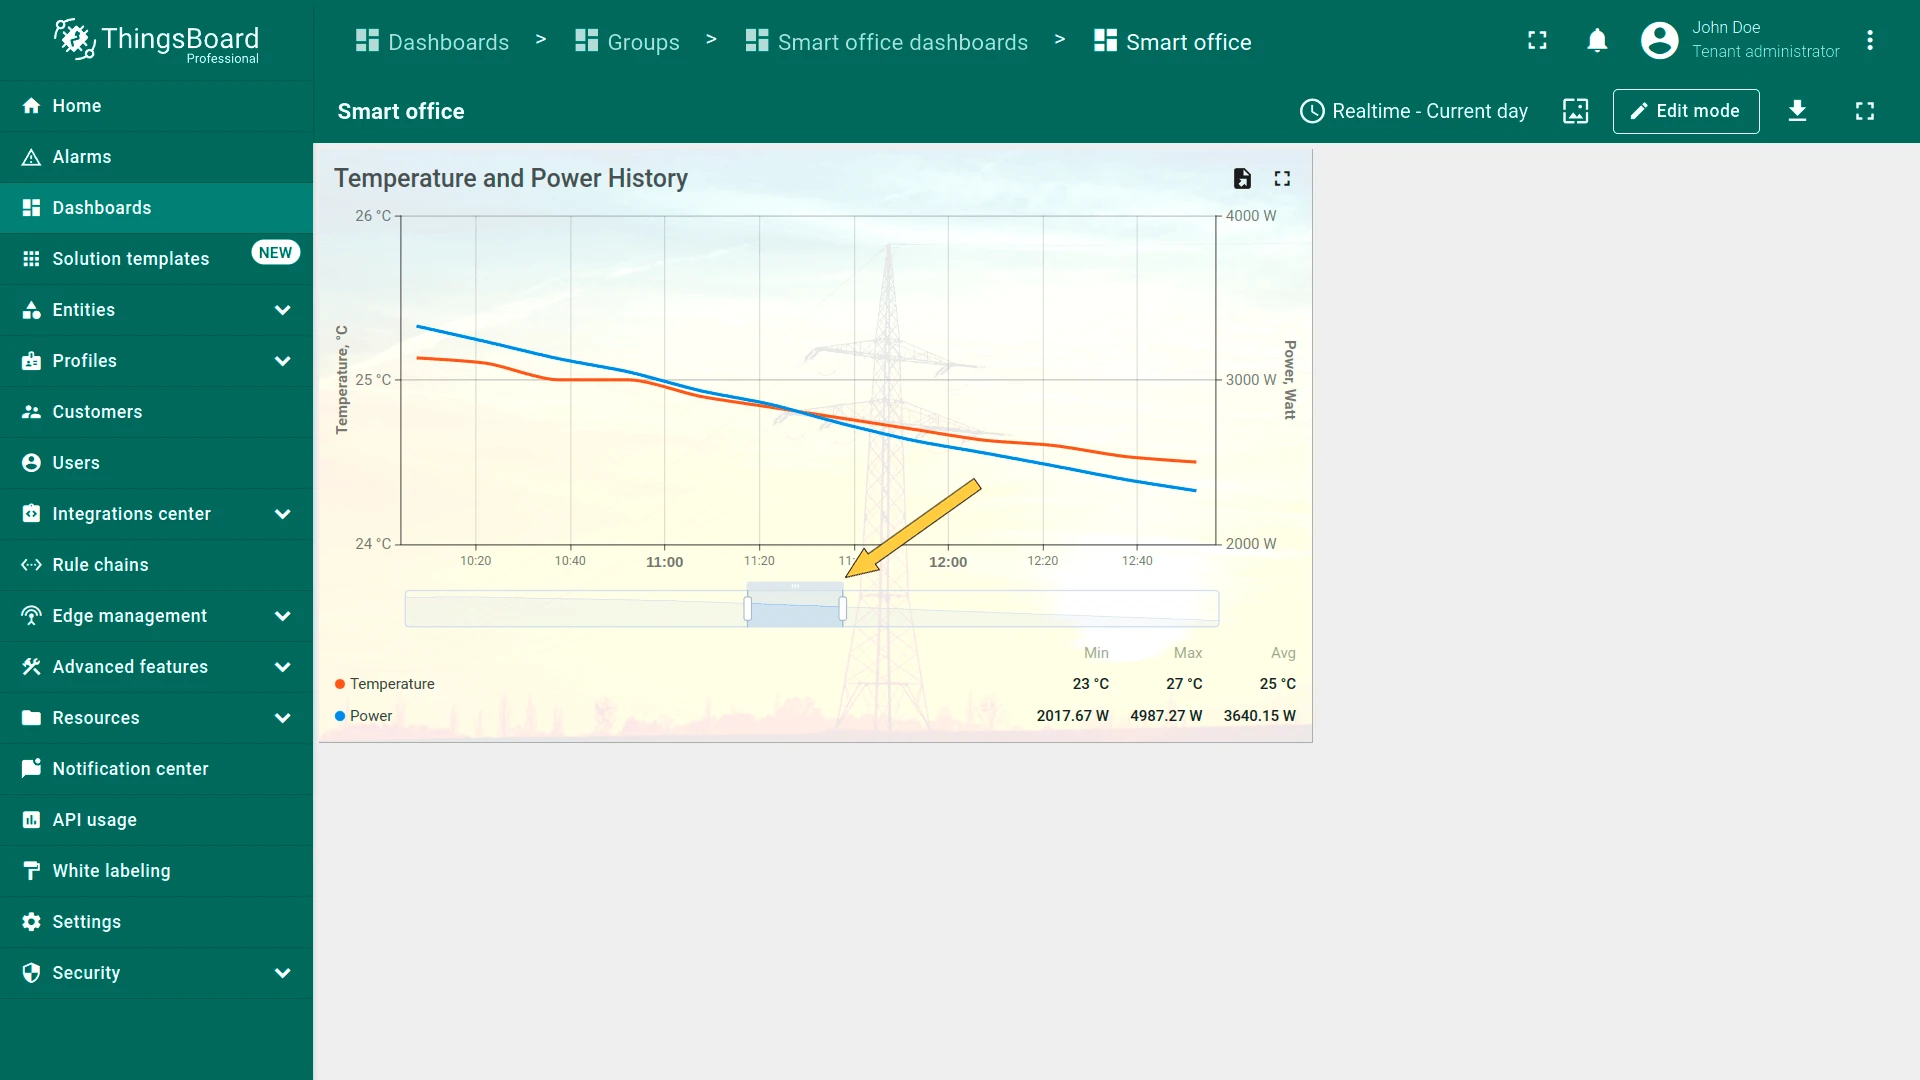
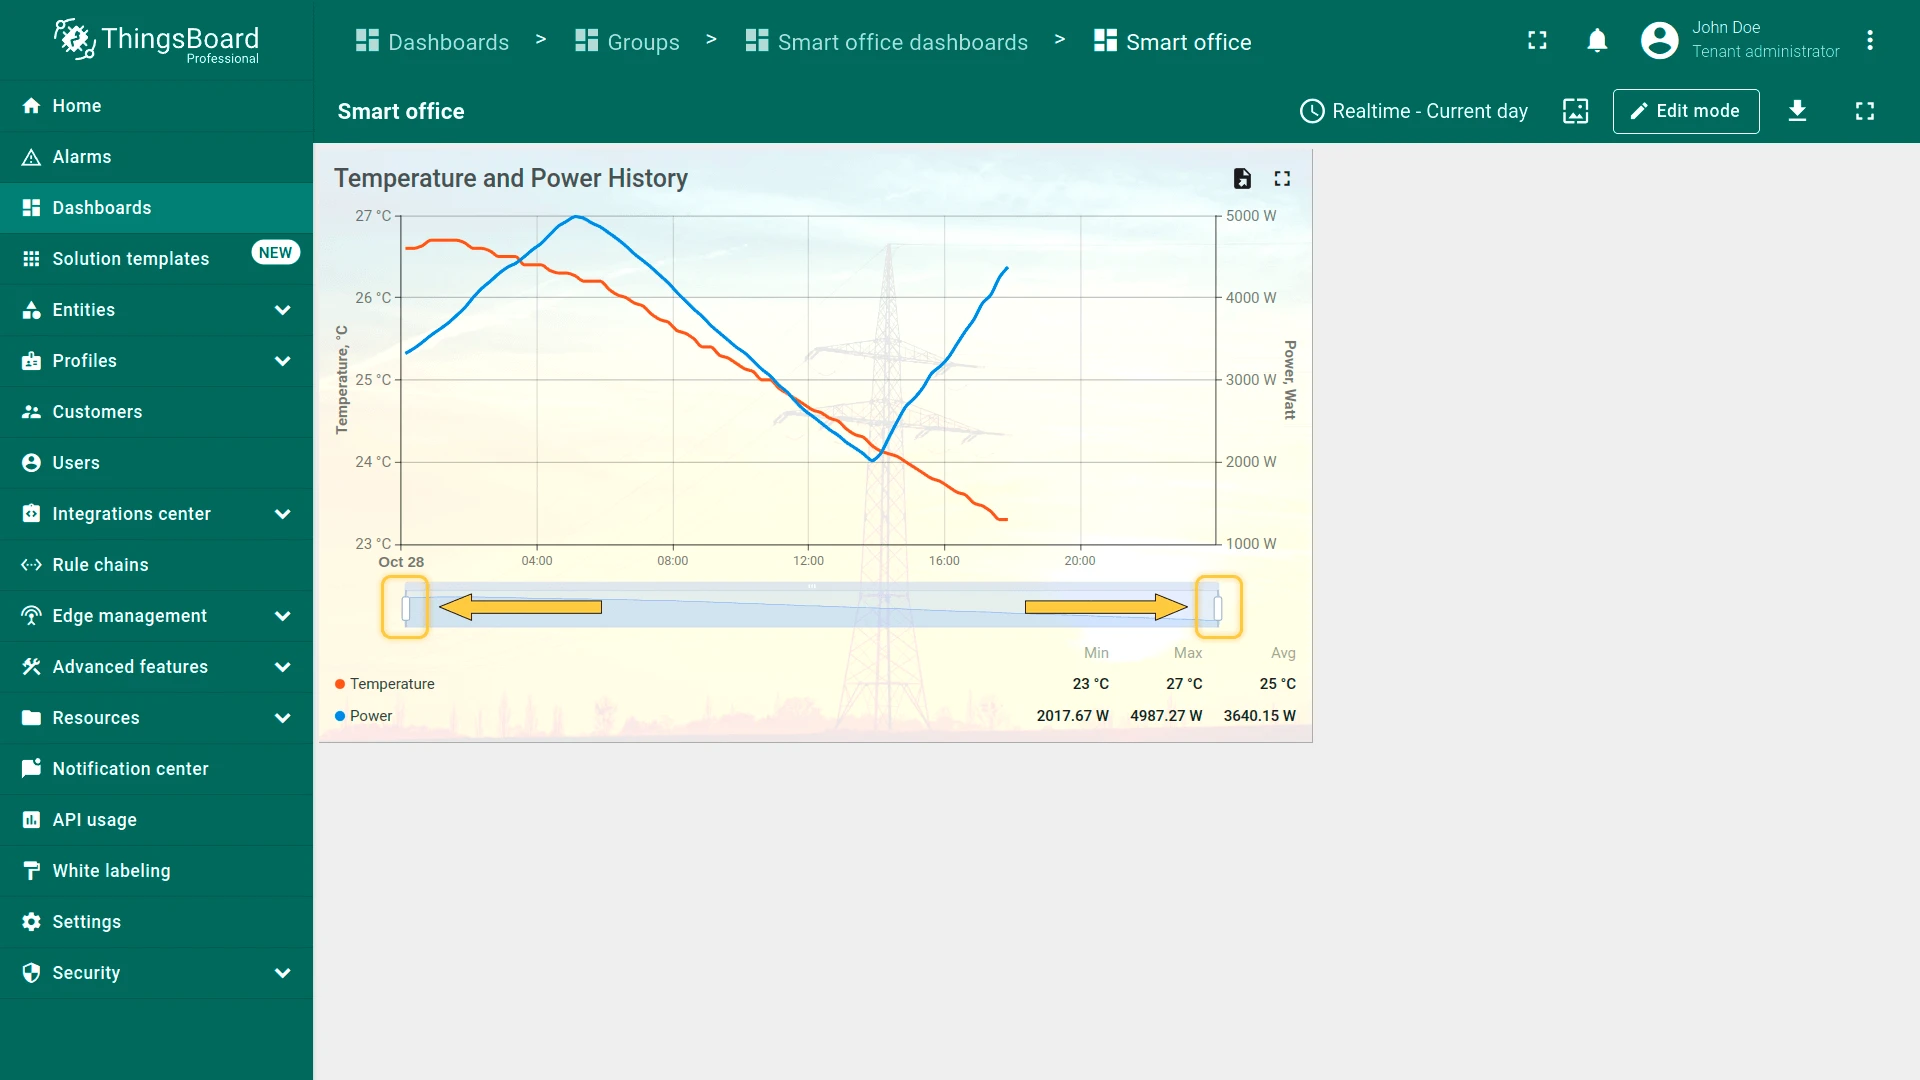
Drag the sliders to narrow the visible time range; return them to their default position to zoom out.
Time Zone
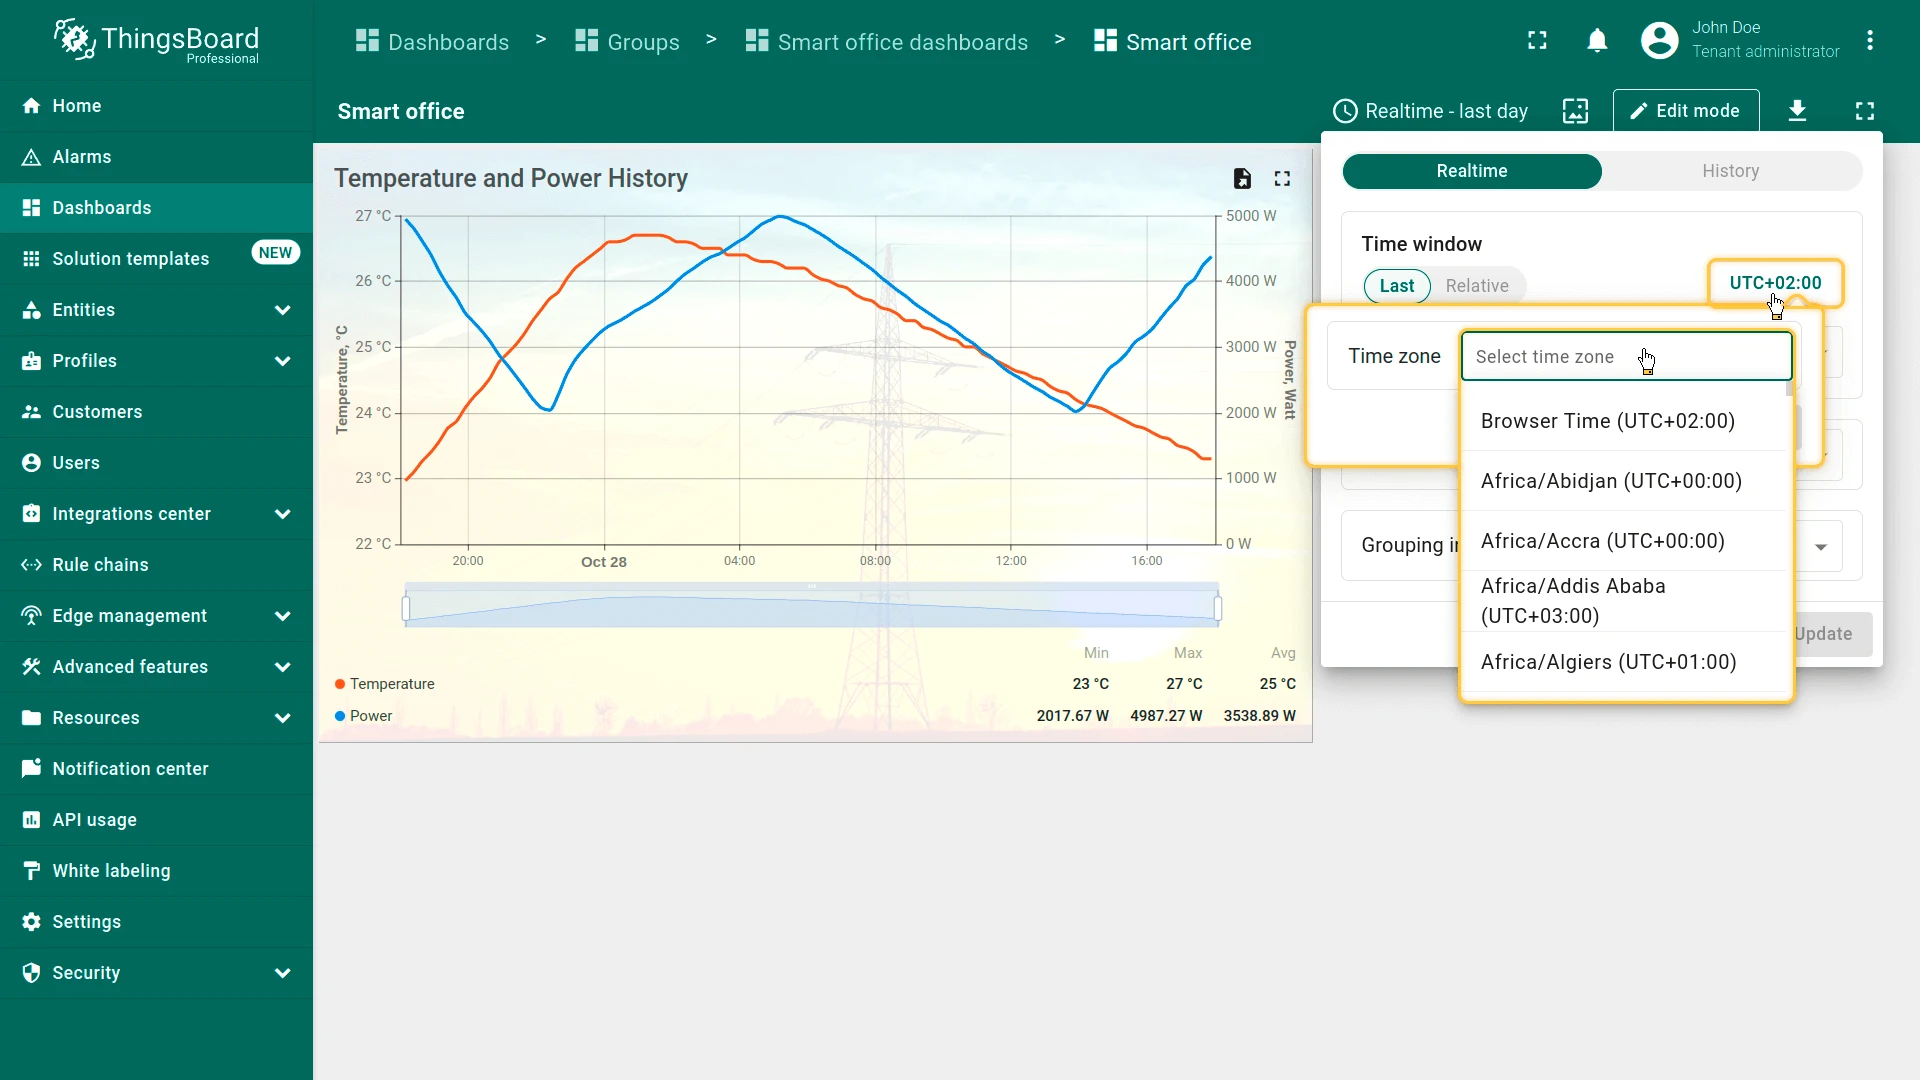
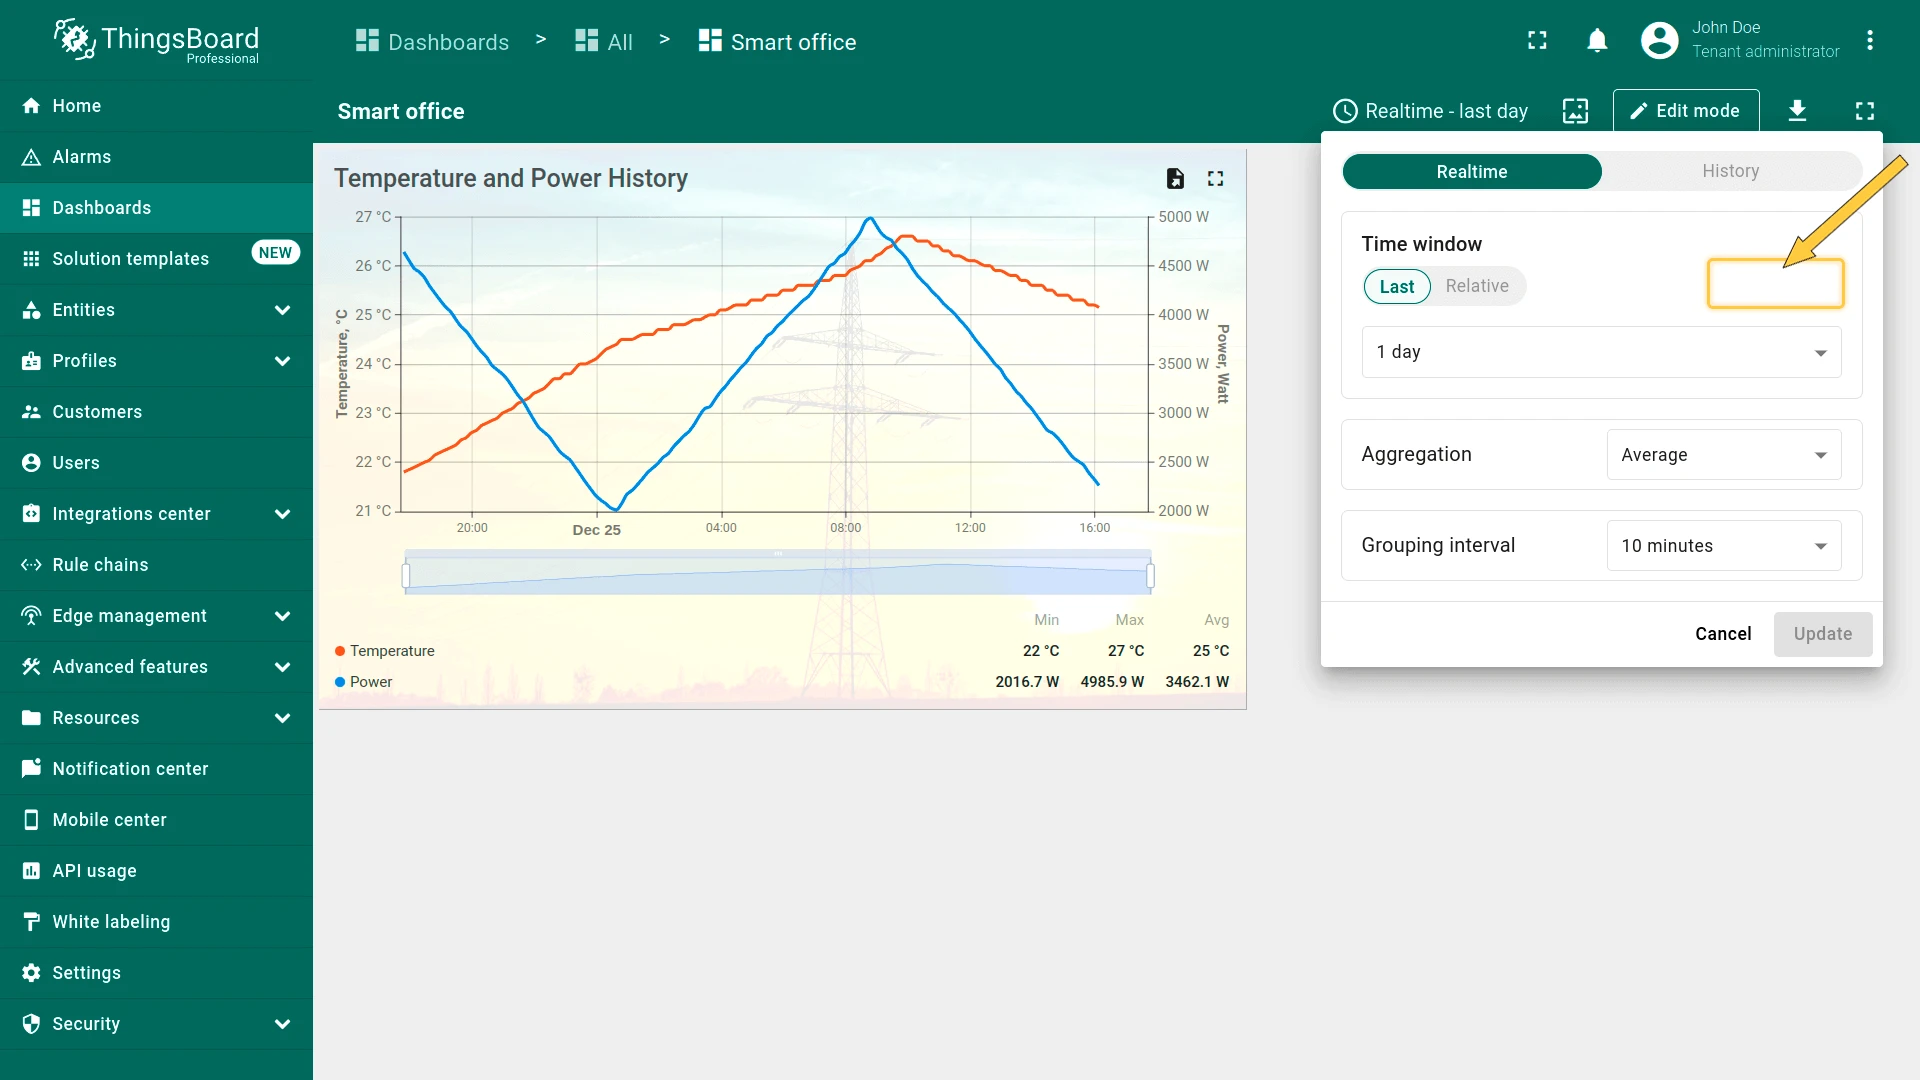
Section titled “Time Zone”Defaults to the browser time zone; can be changed to any time zone.
Time Window Settings
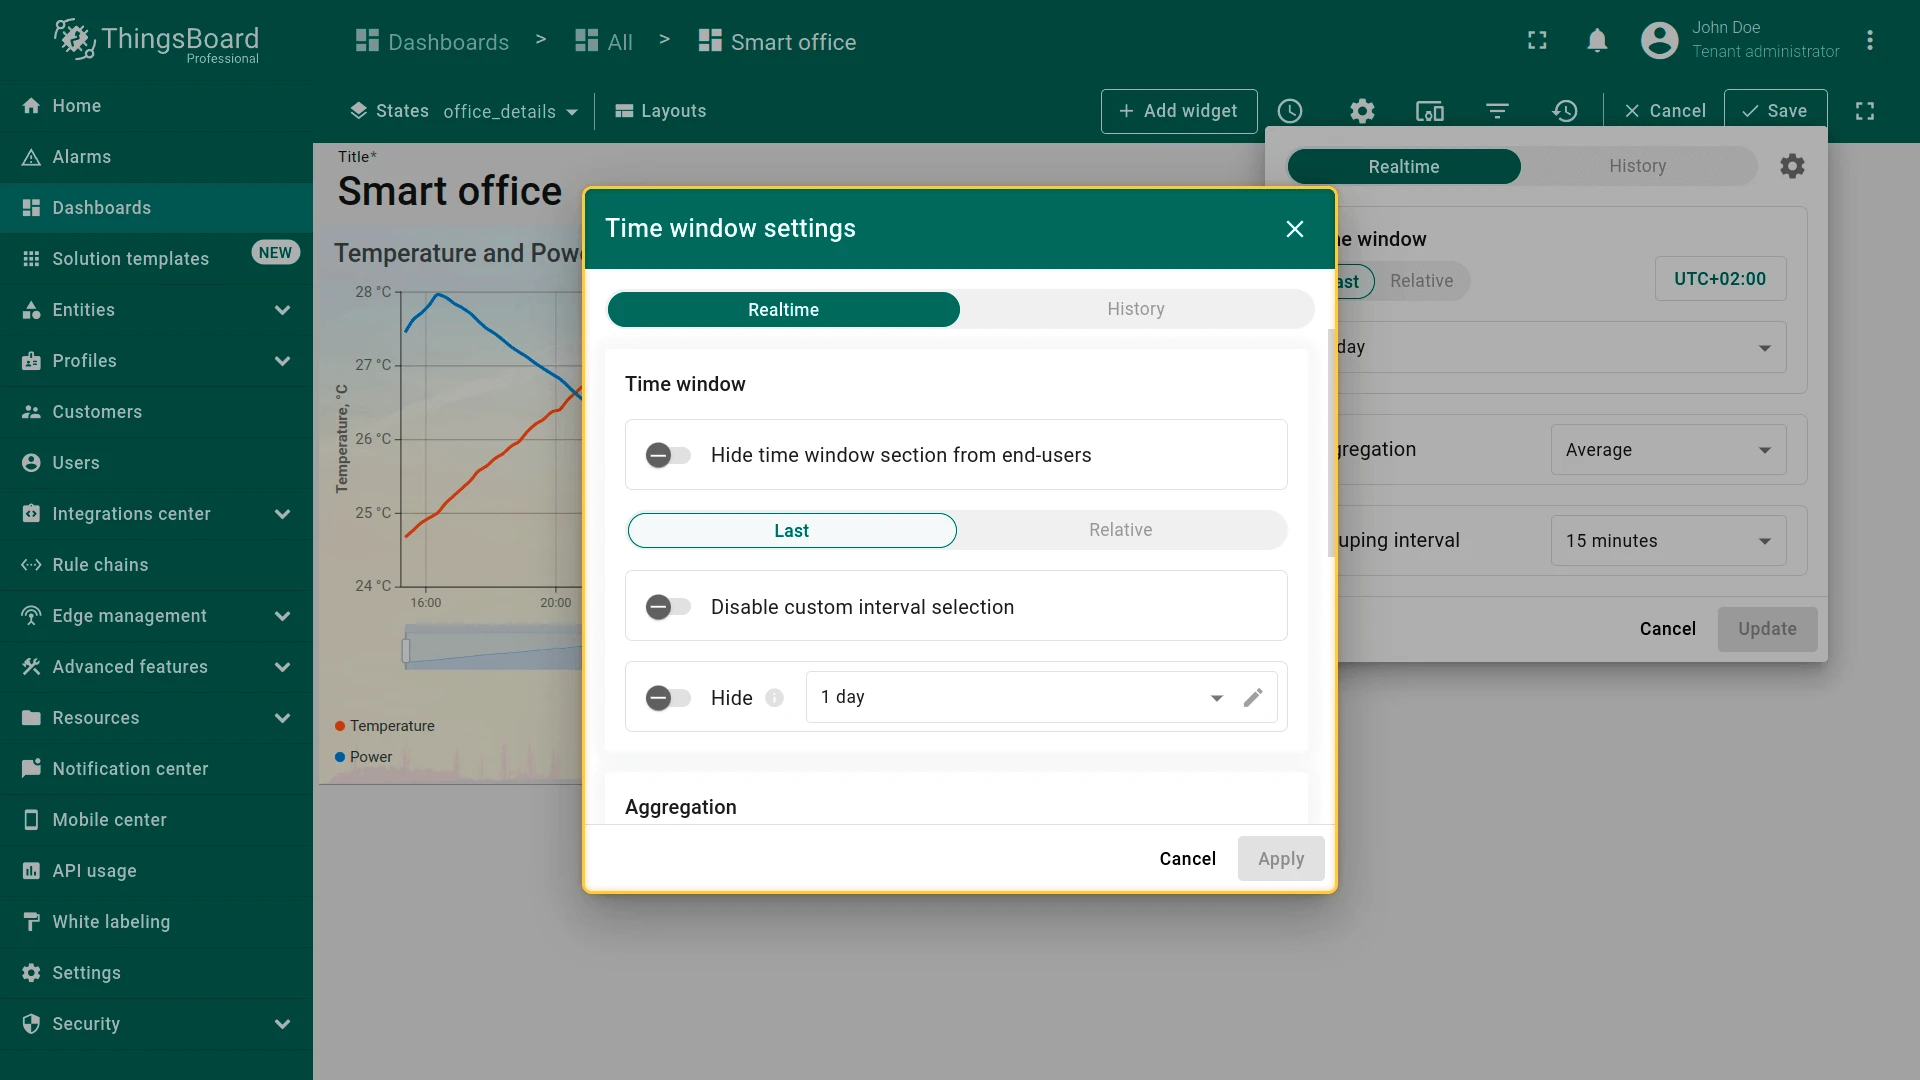
Section titled “Time Window Settings”Use these settings to control which time window options are visible to end users.
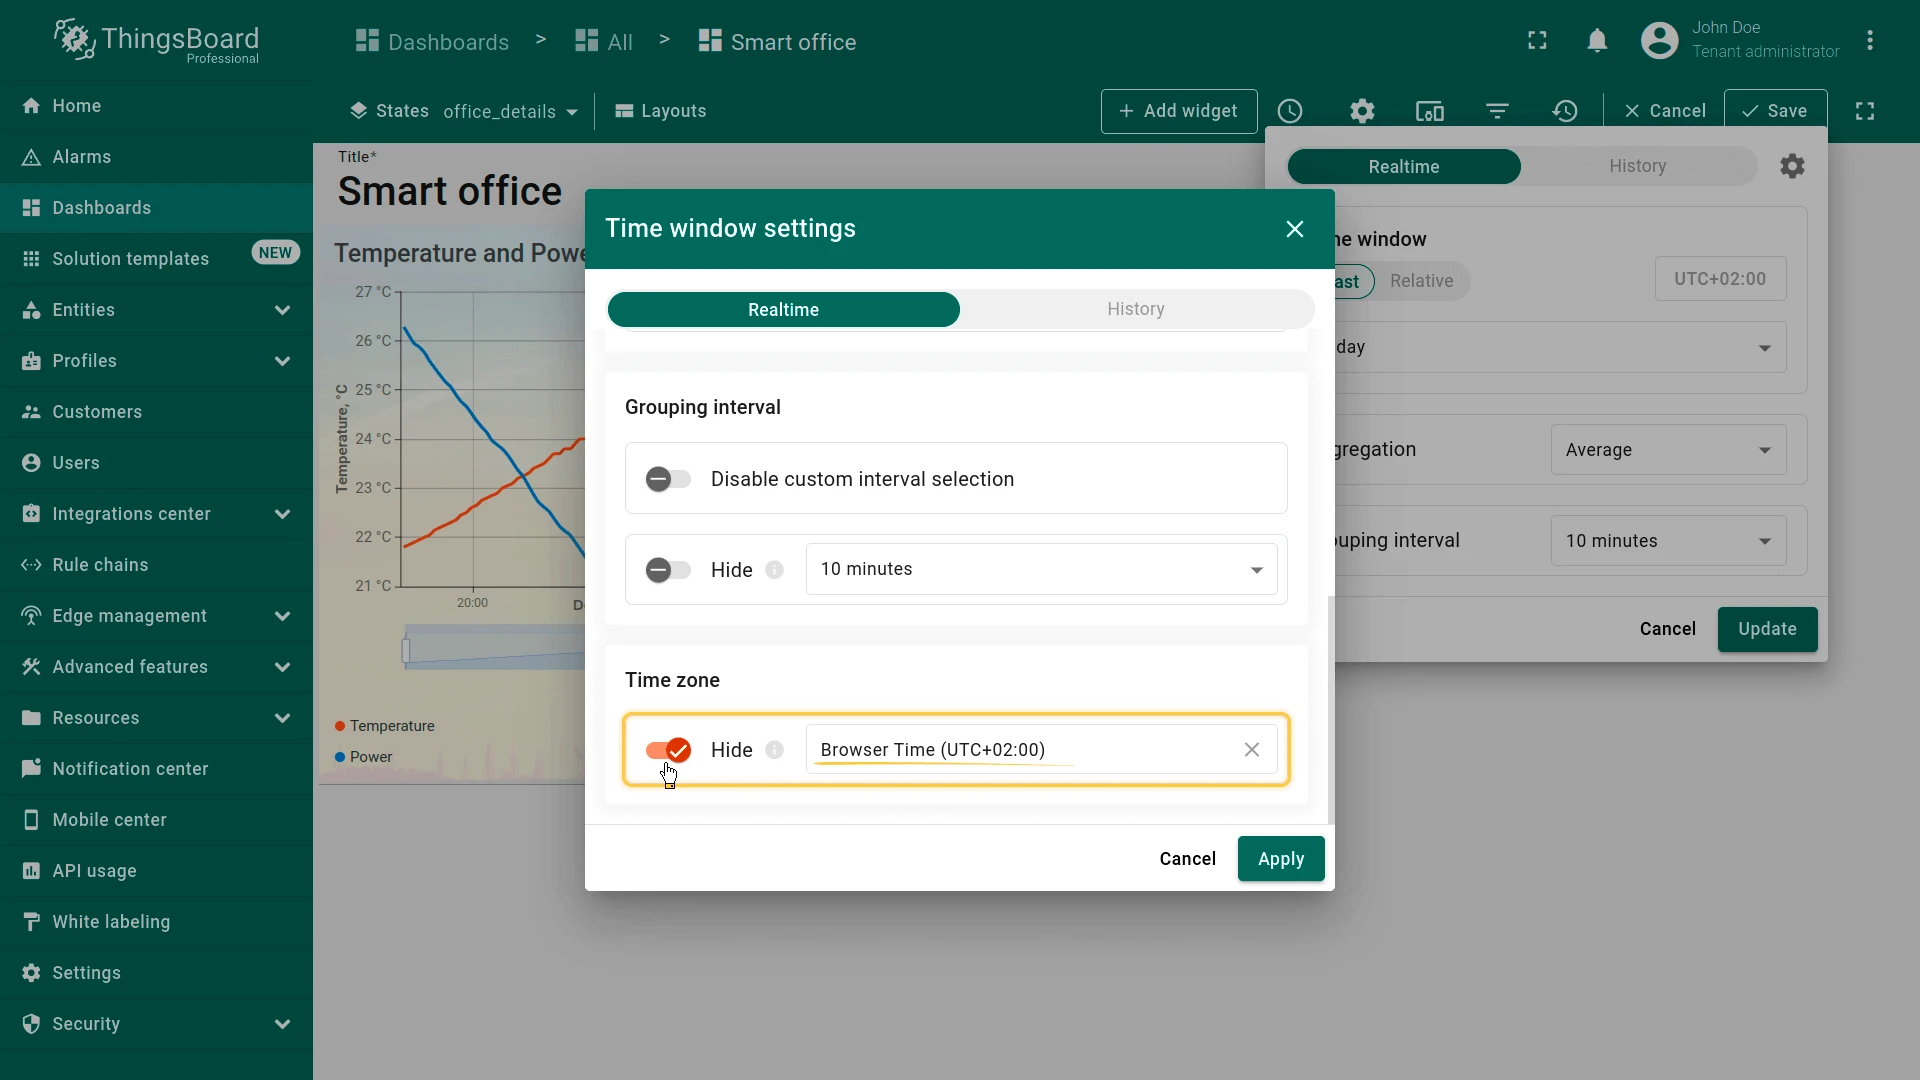
In dashboard edit mode, open the Edit time window dialog and click the gear icon.
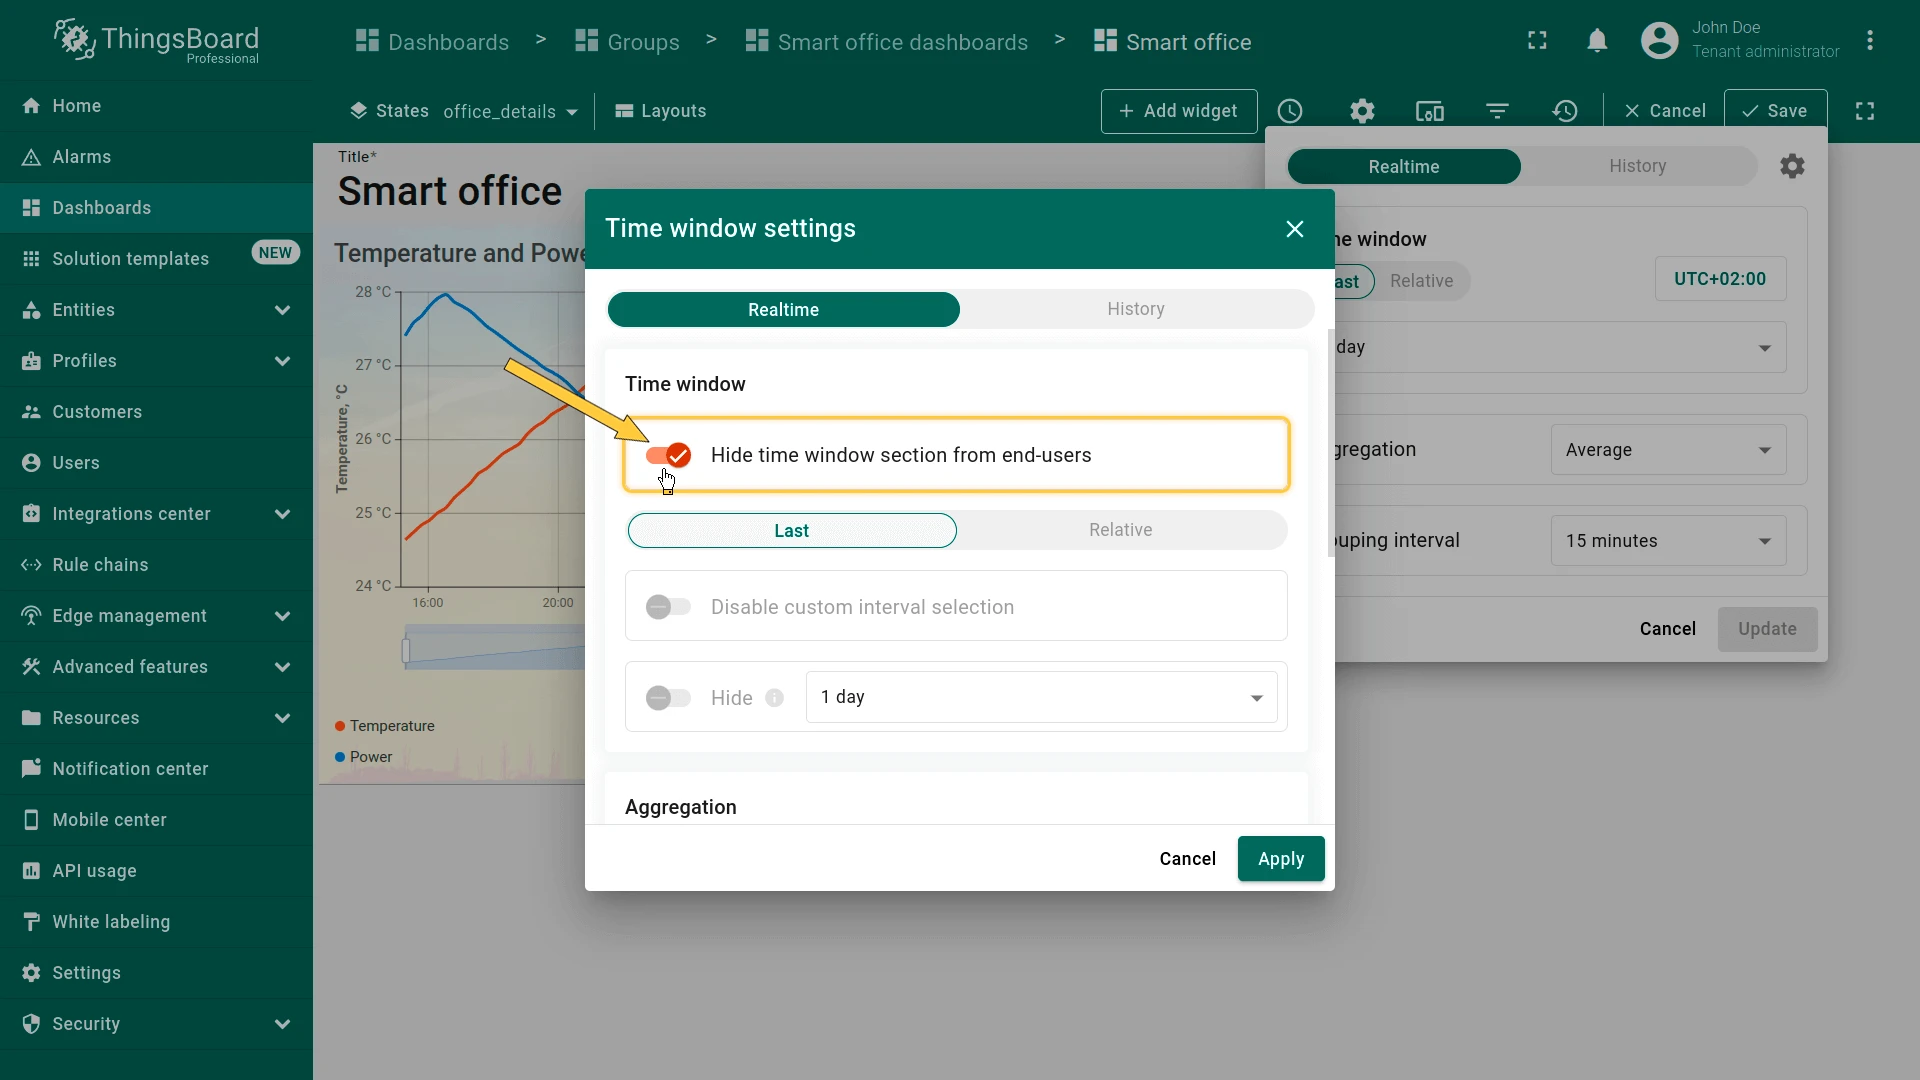
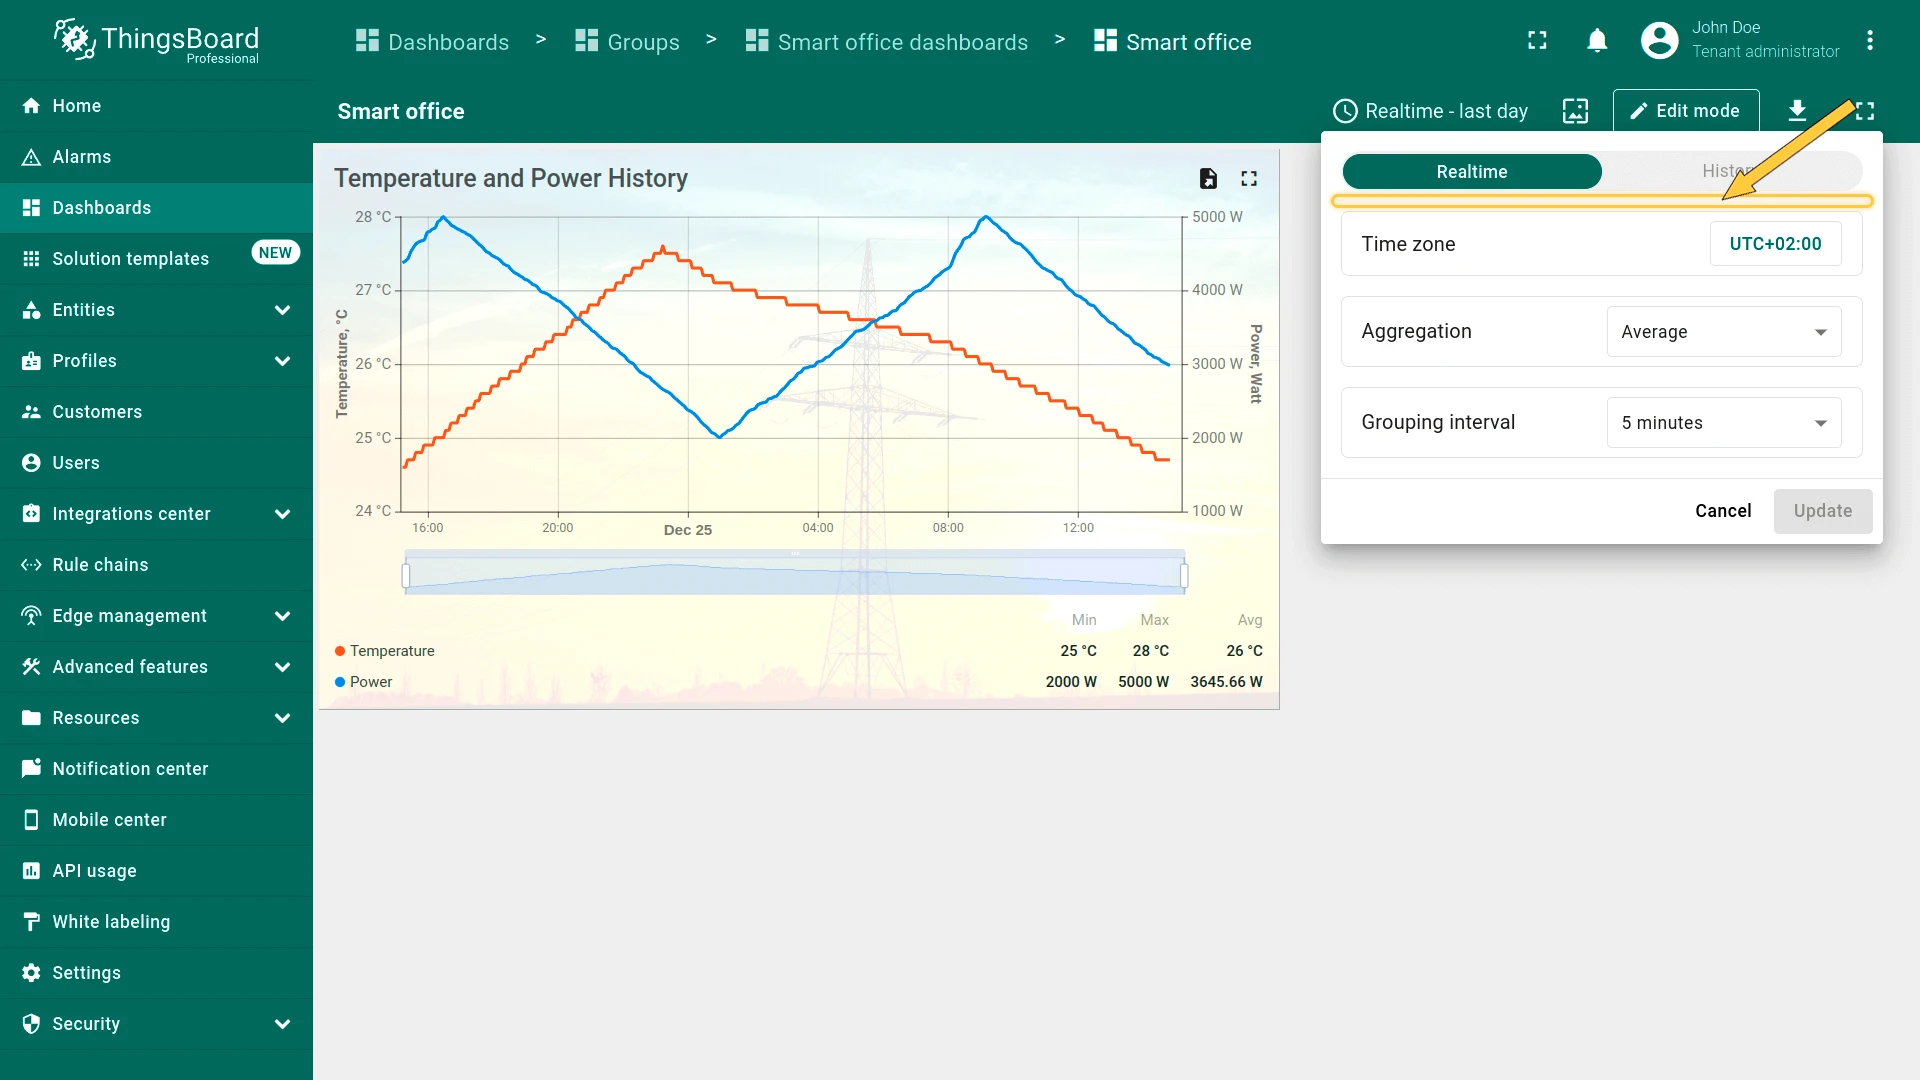
Hide the Time Window Section
When enabled, users cannot change the time interval.
Hide or Restrict Interval Types
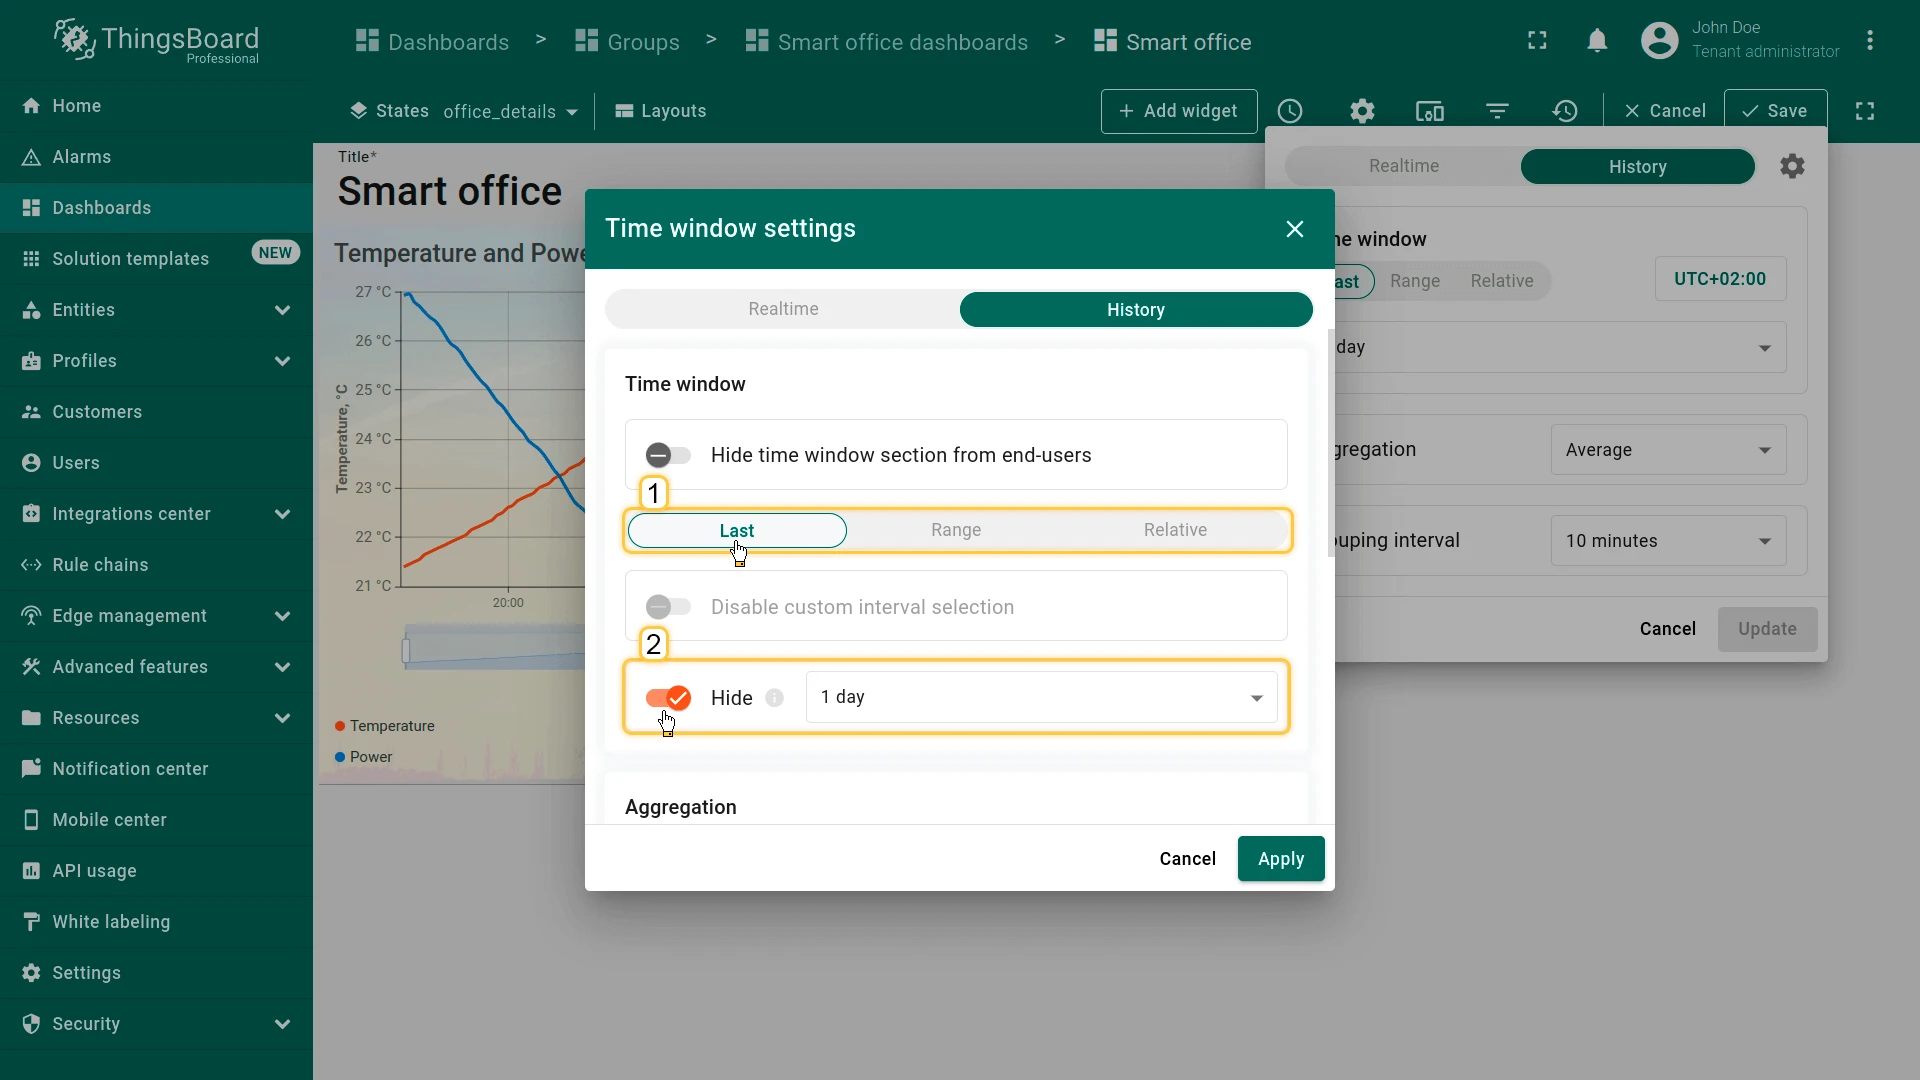
To hide a specific interval type, select its tab (Last, Range, or Relative) in the settings dialog and enable Hide for that interval.
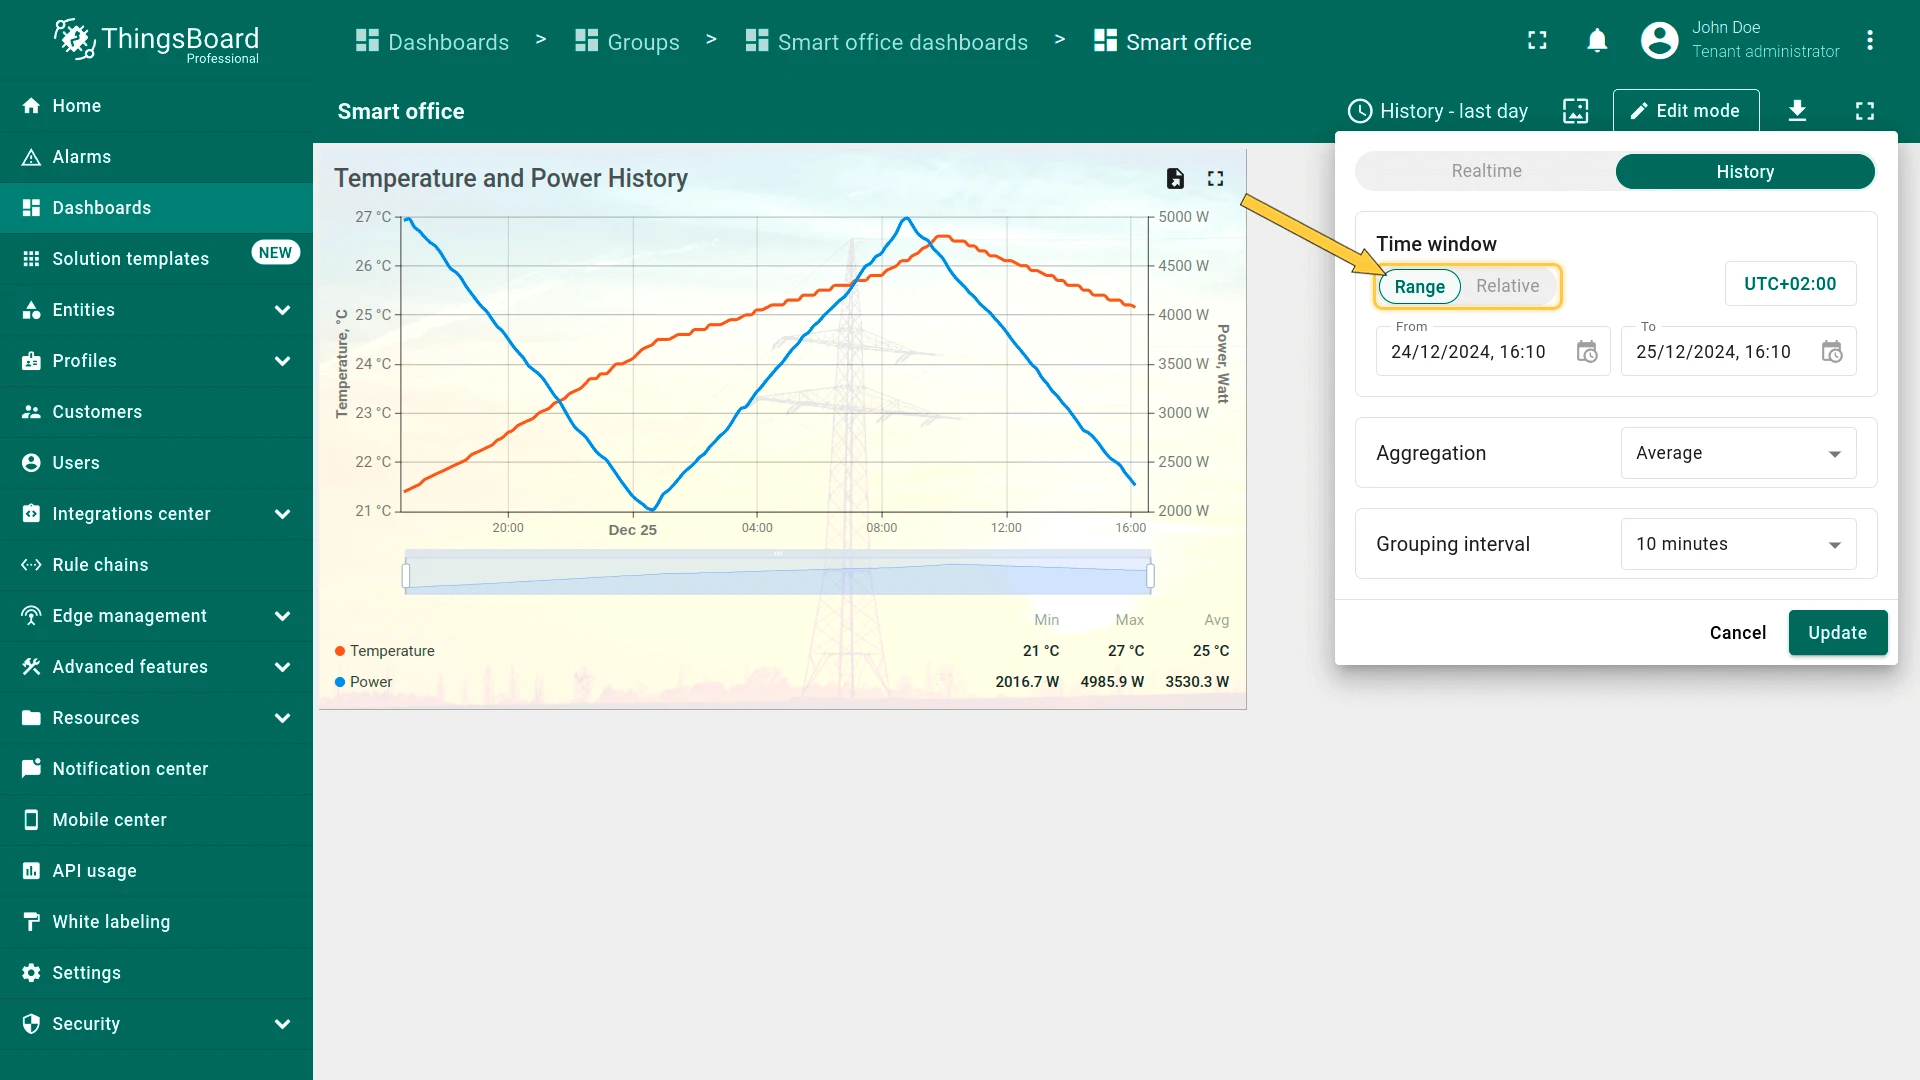
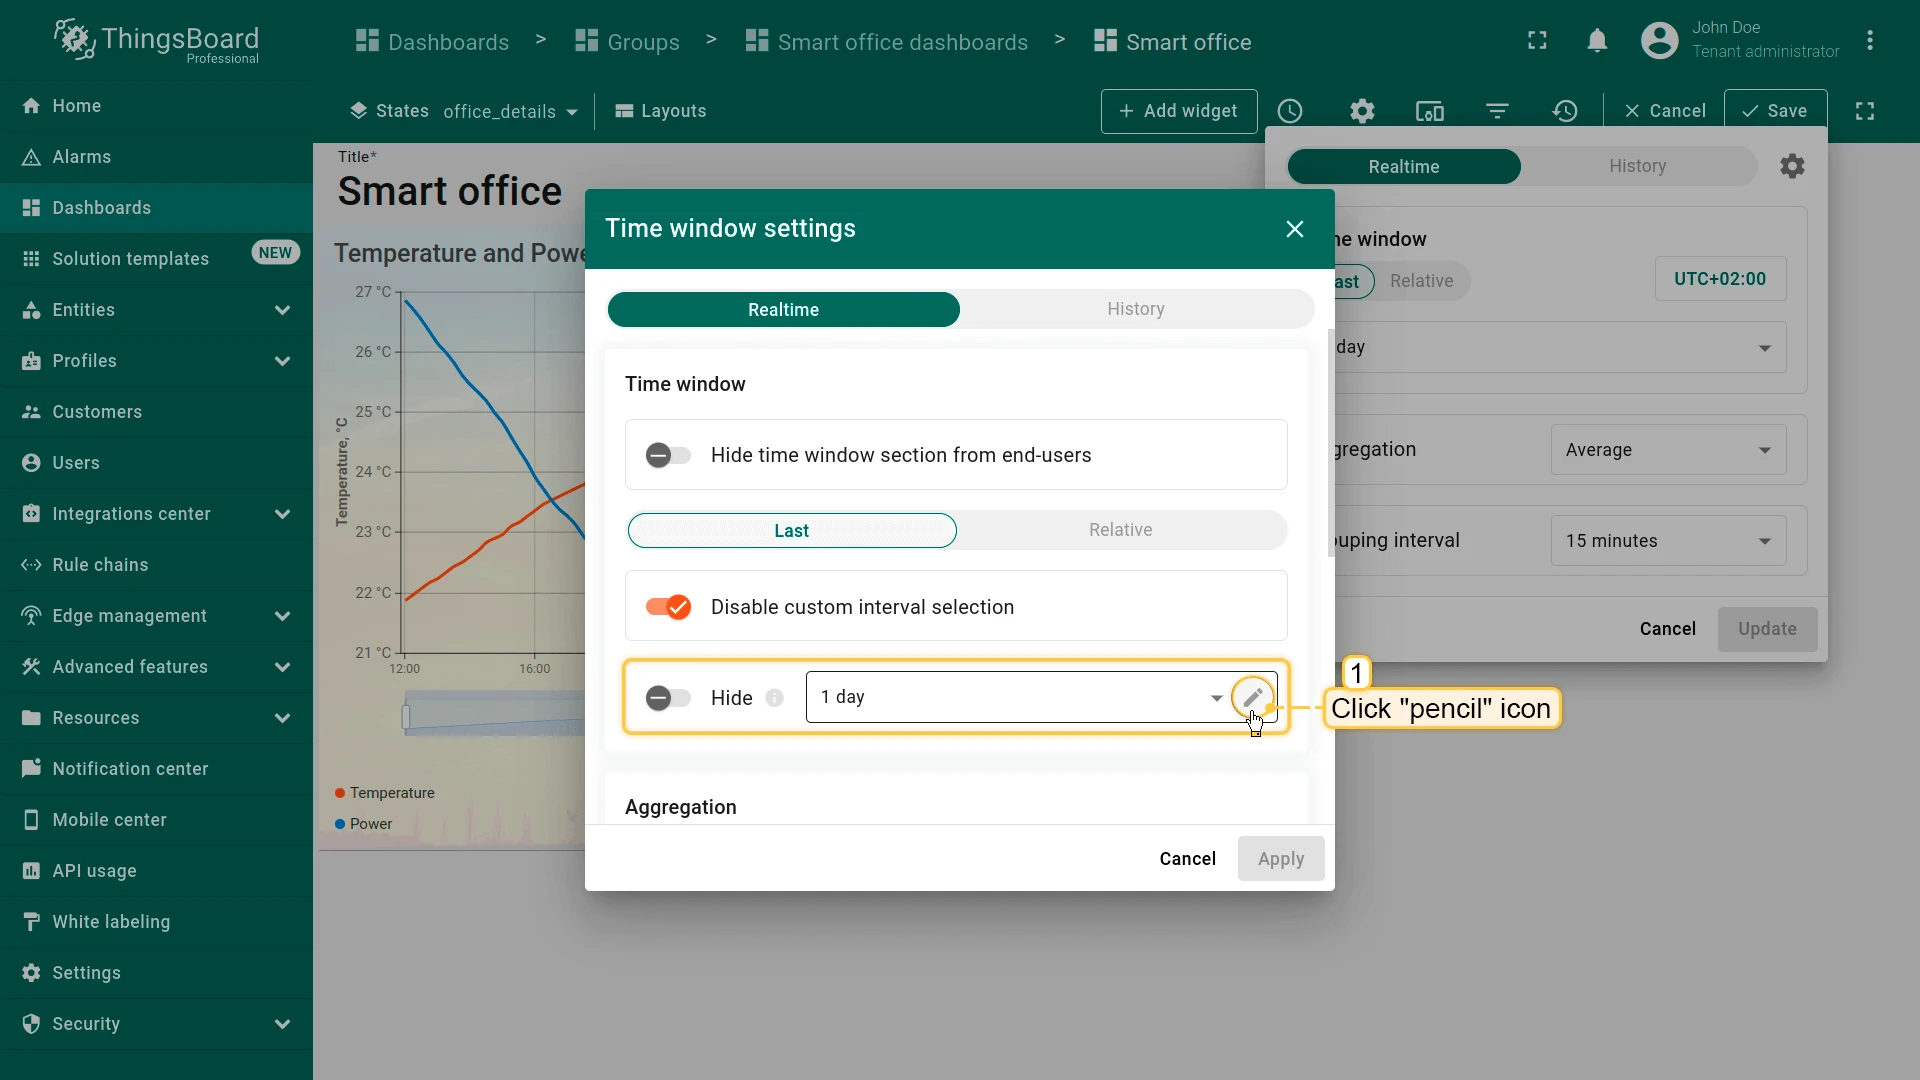
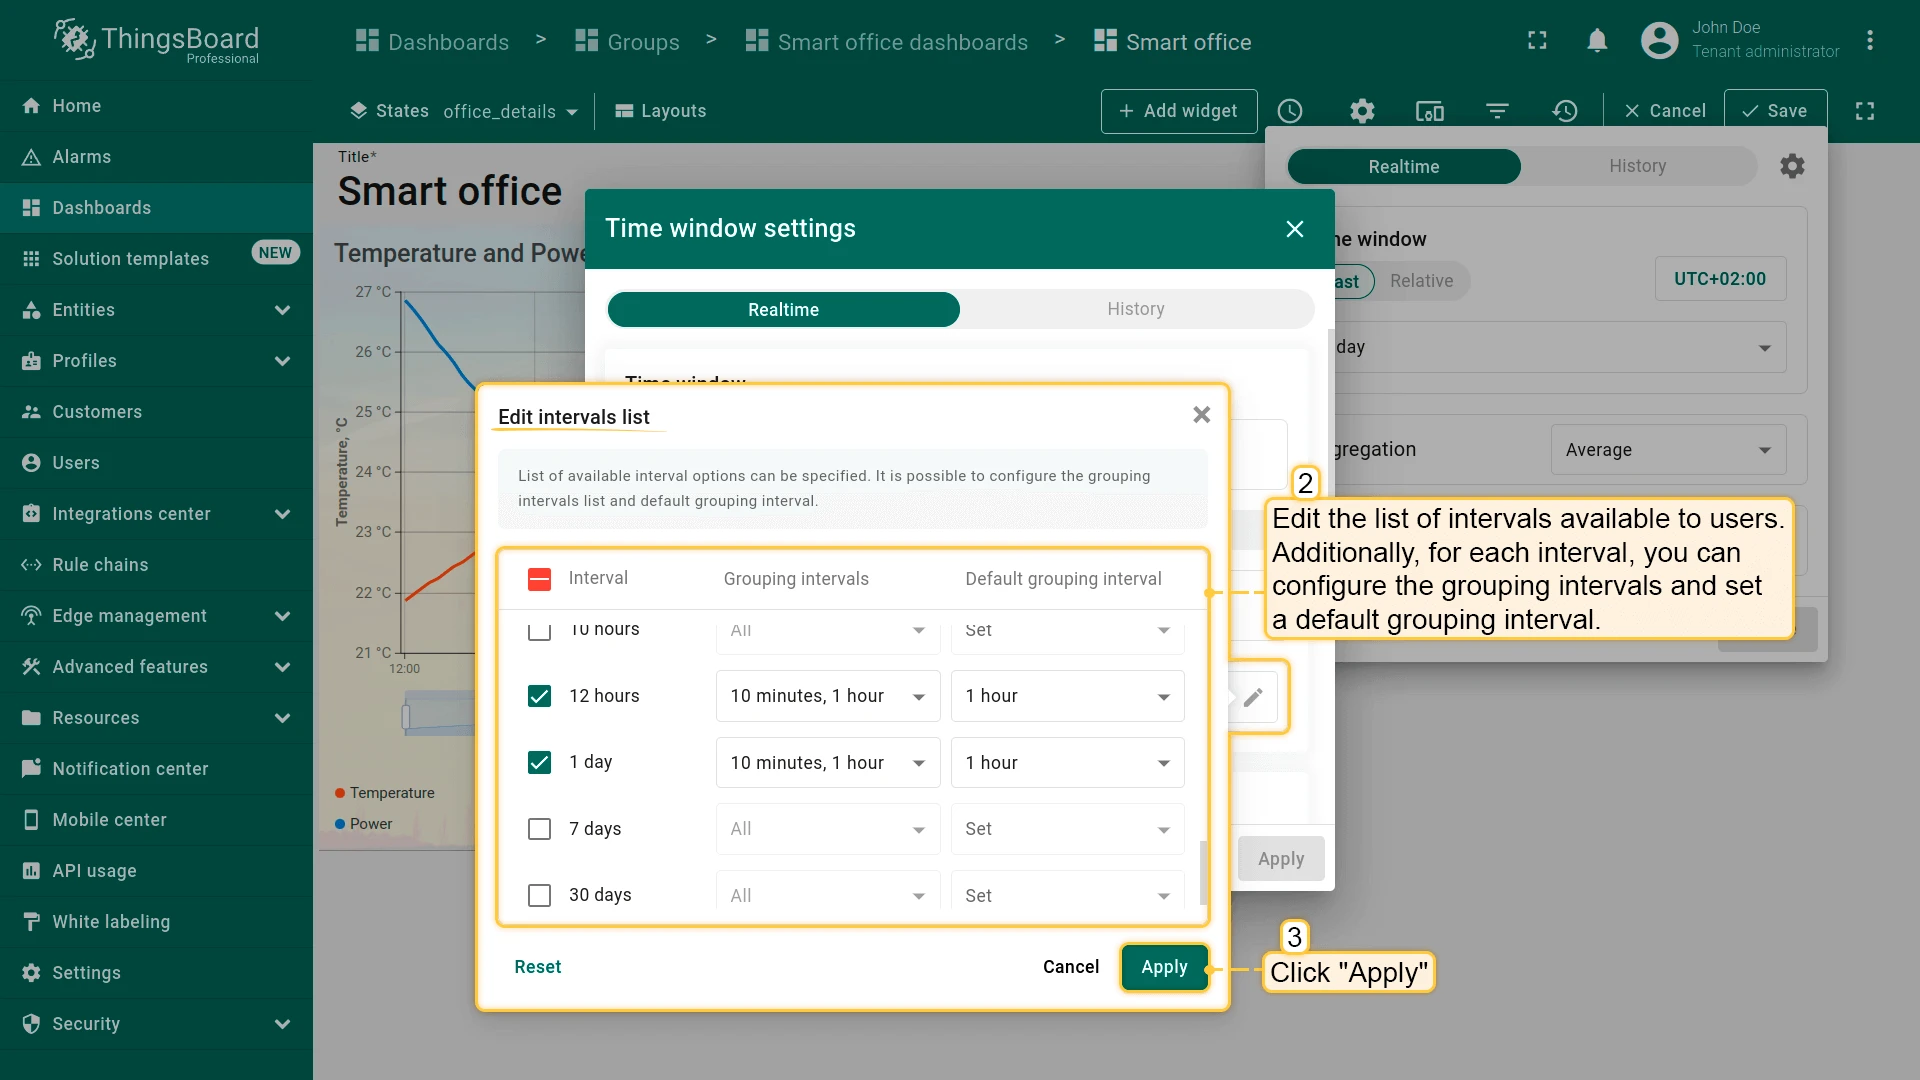
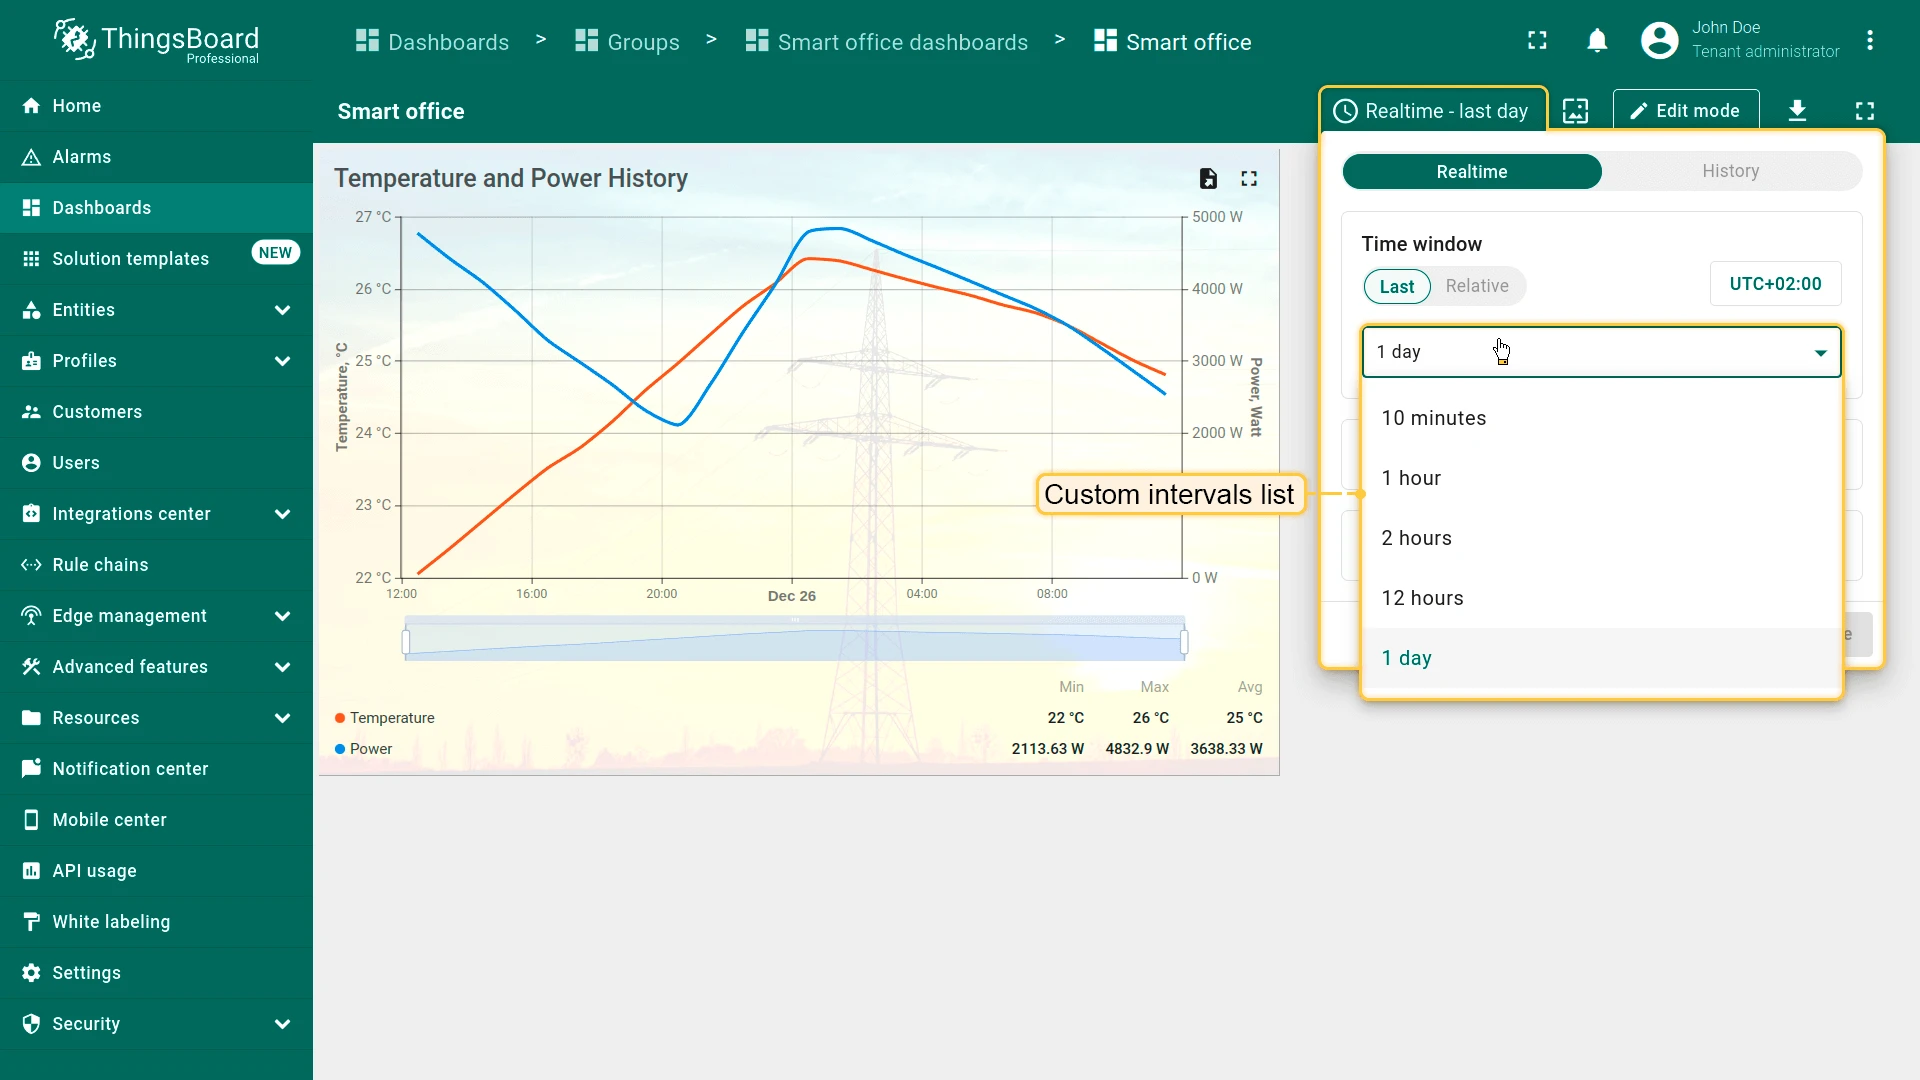
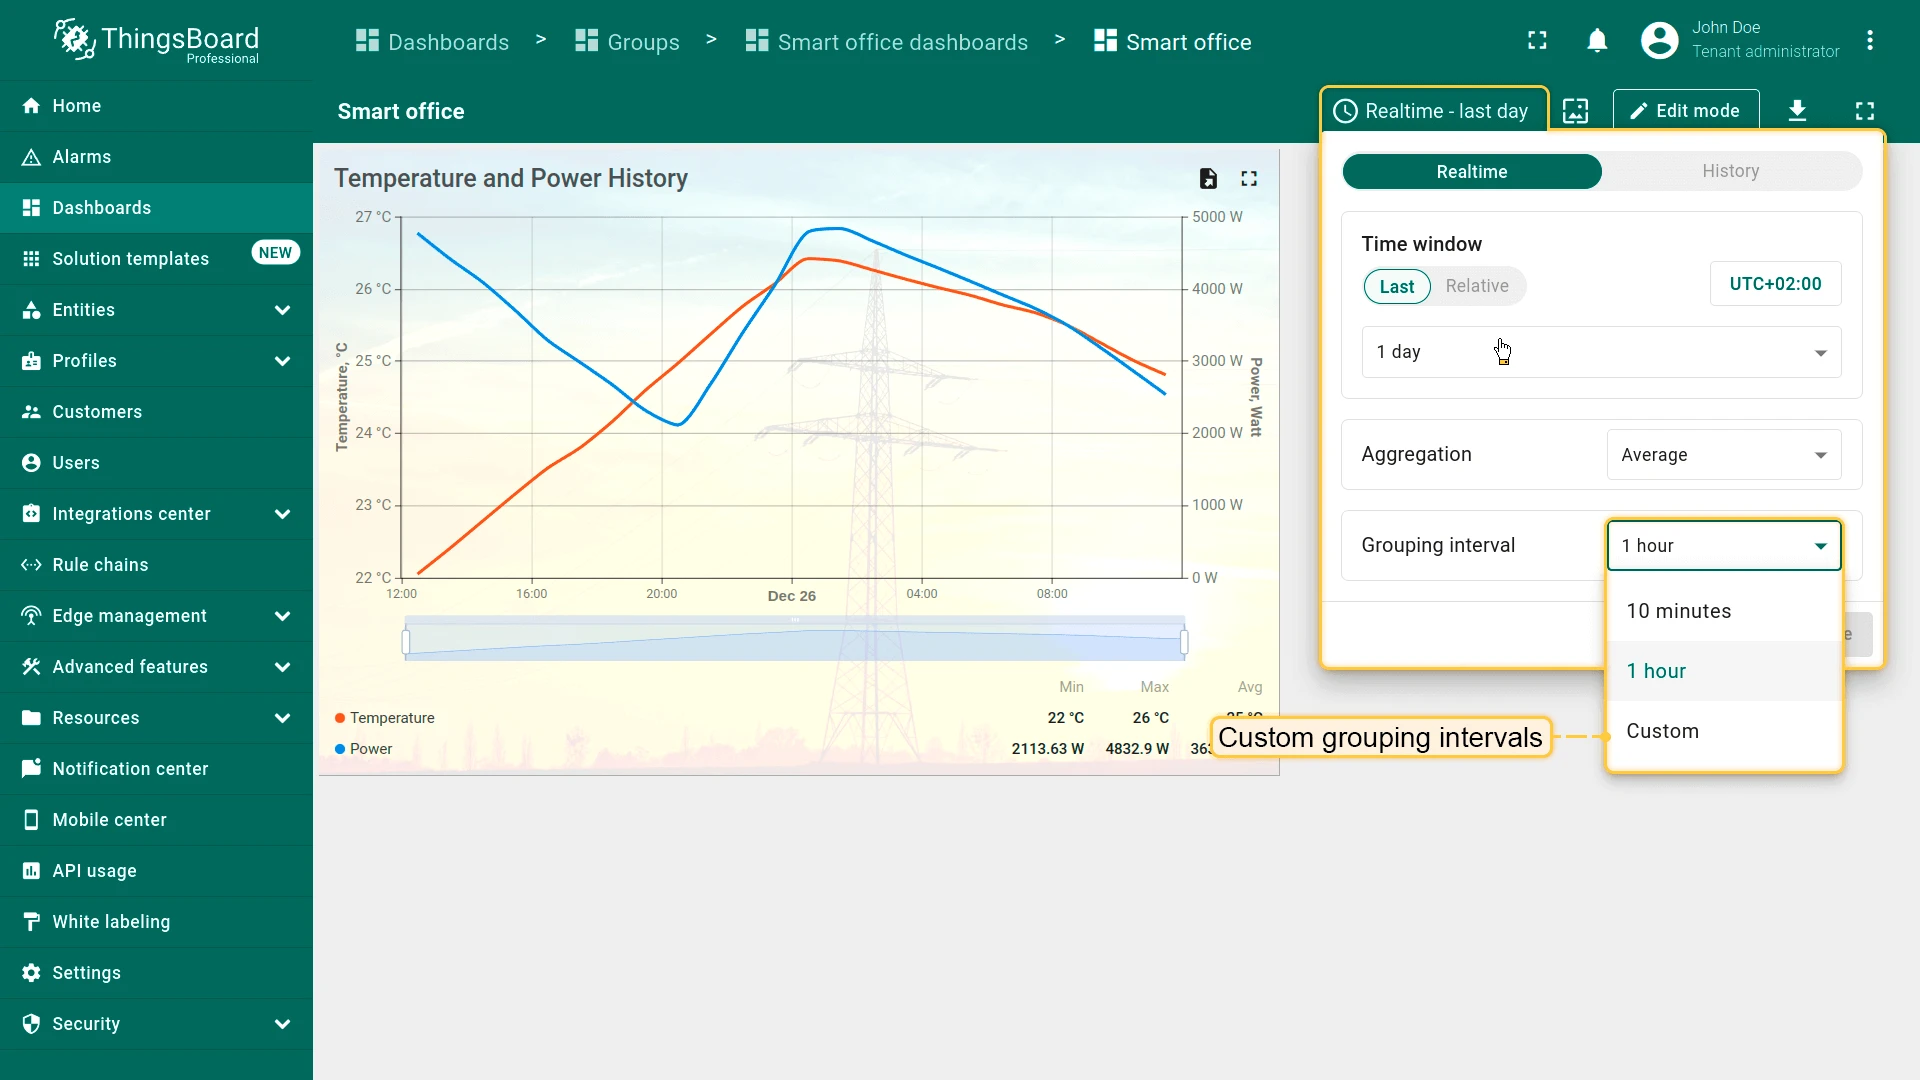
To restrict the available intervals and configure the default grouping interval per option, enable Disable custom interval selection and click the pencil icon.
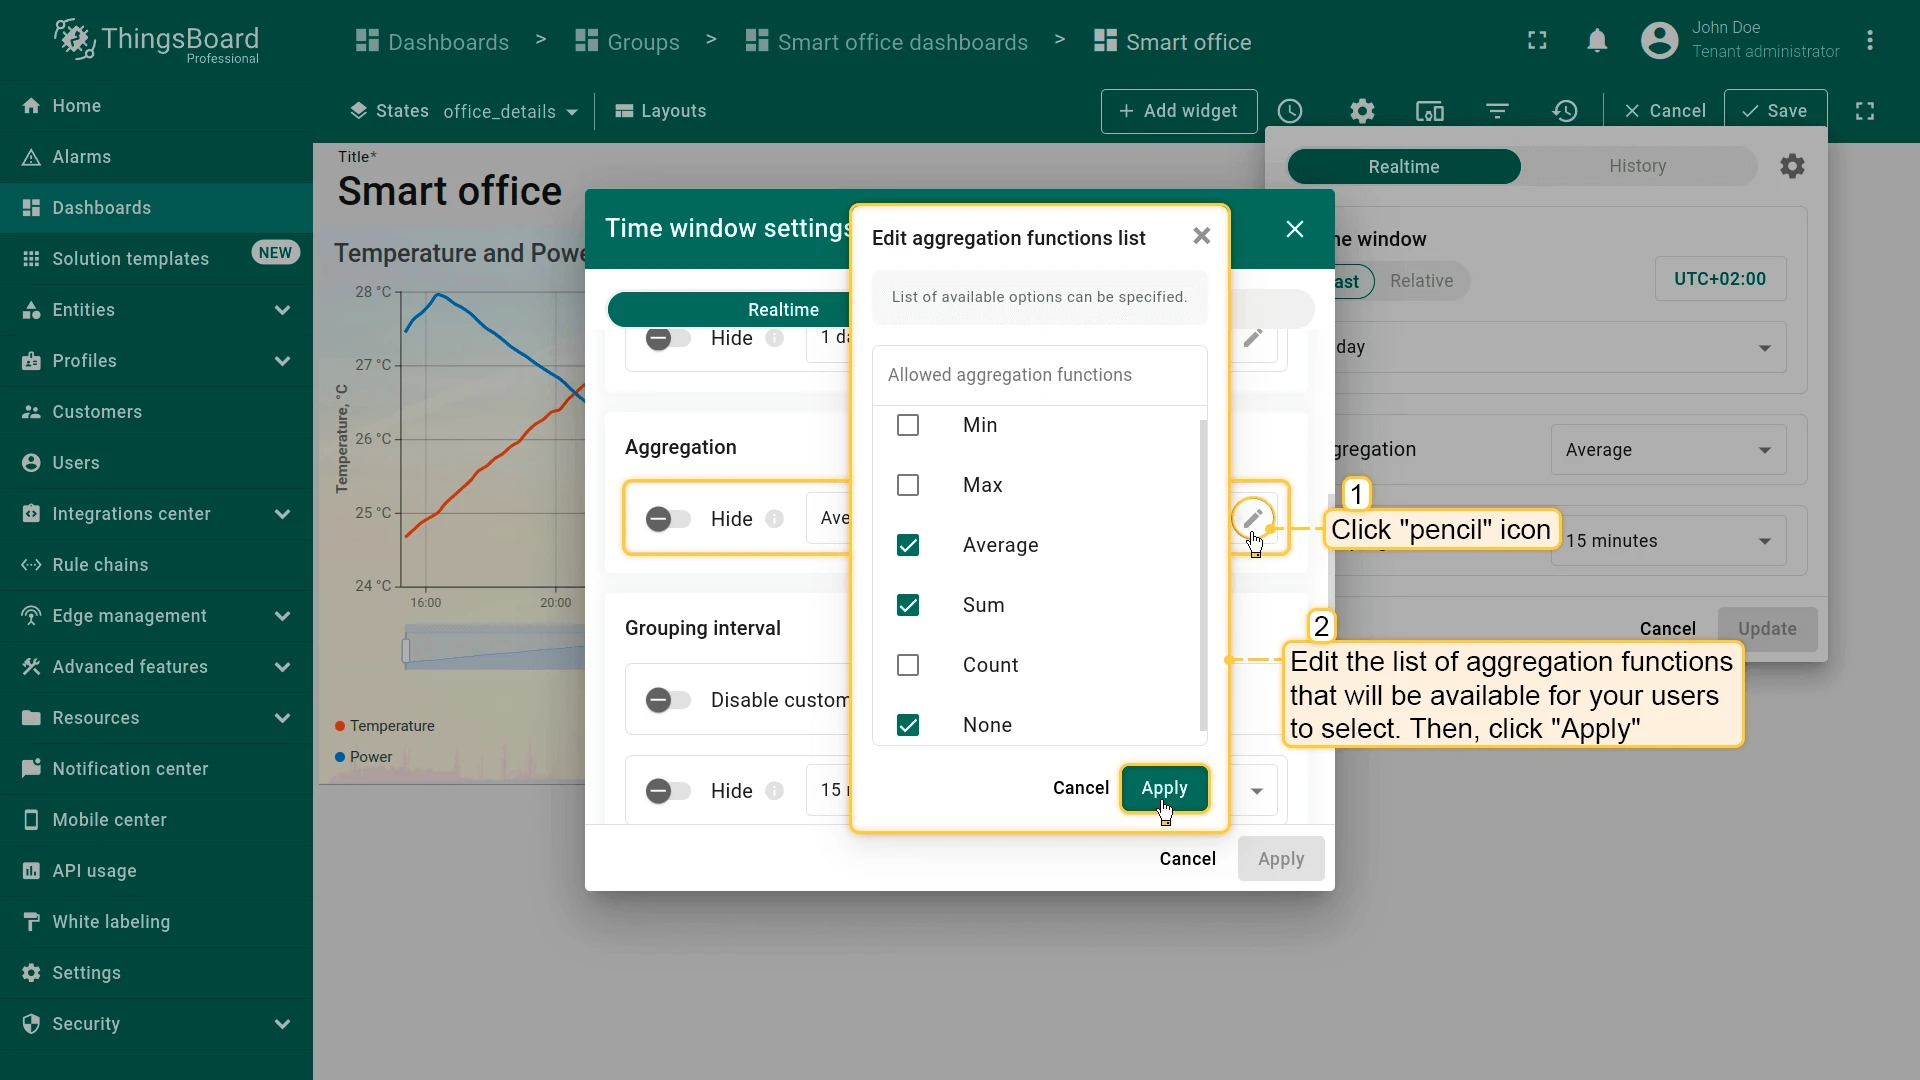
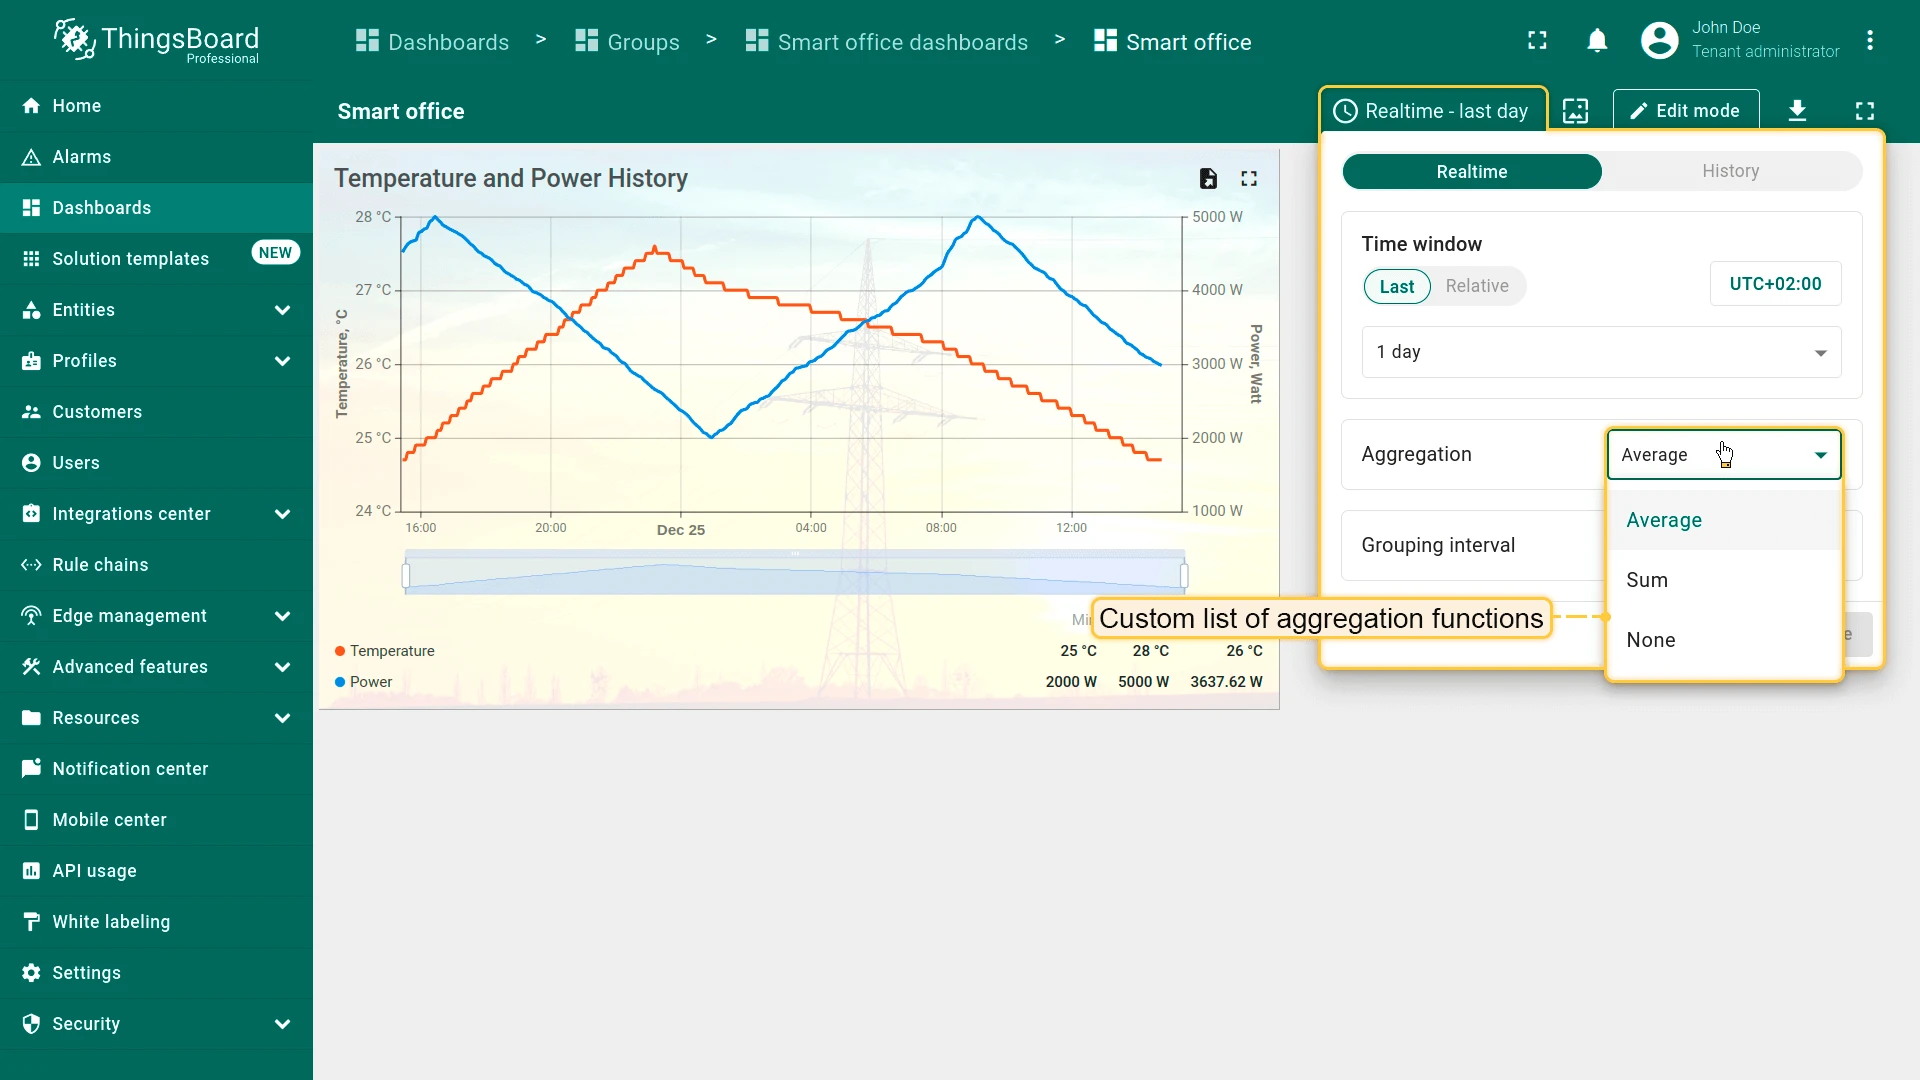
Hide the Aggregation
When enabled, users cannot change or disable the configured aggregation function.
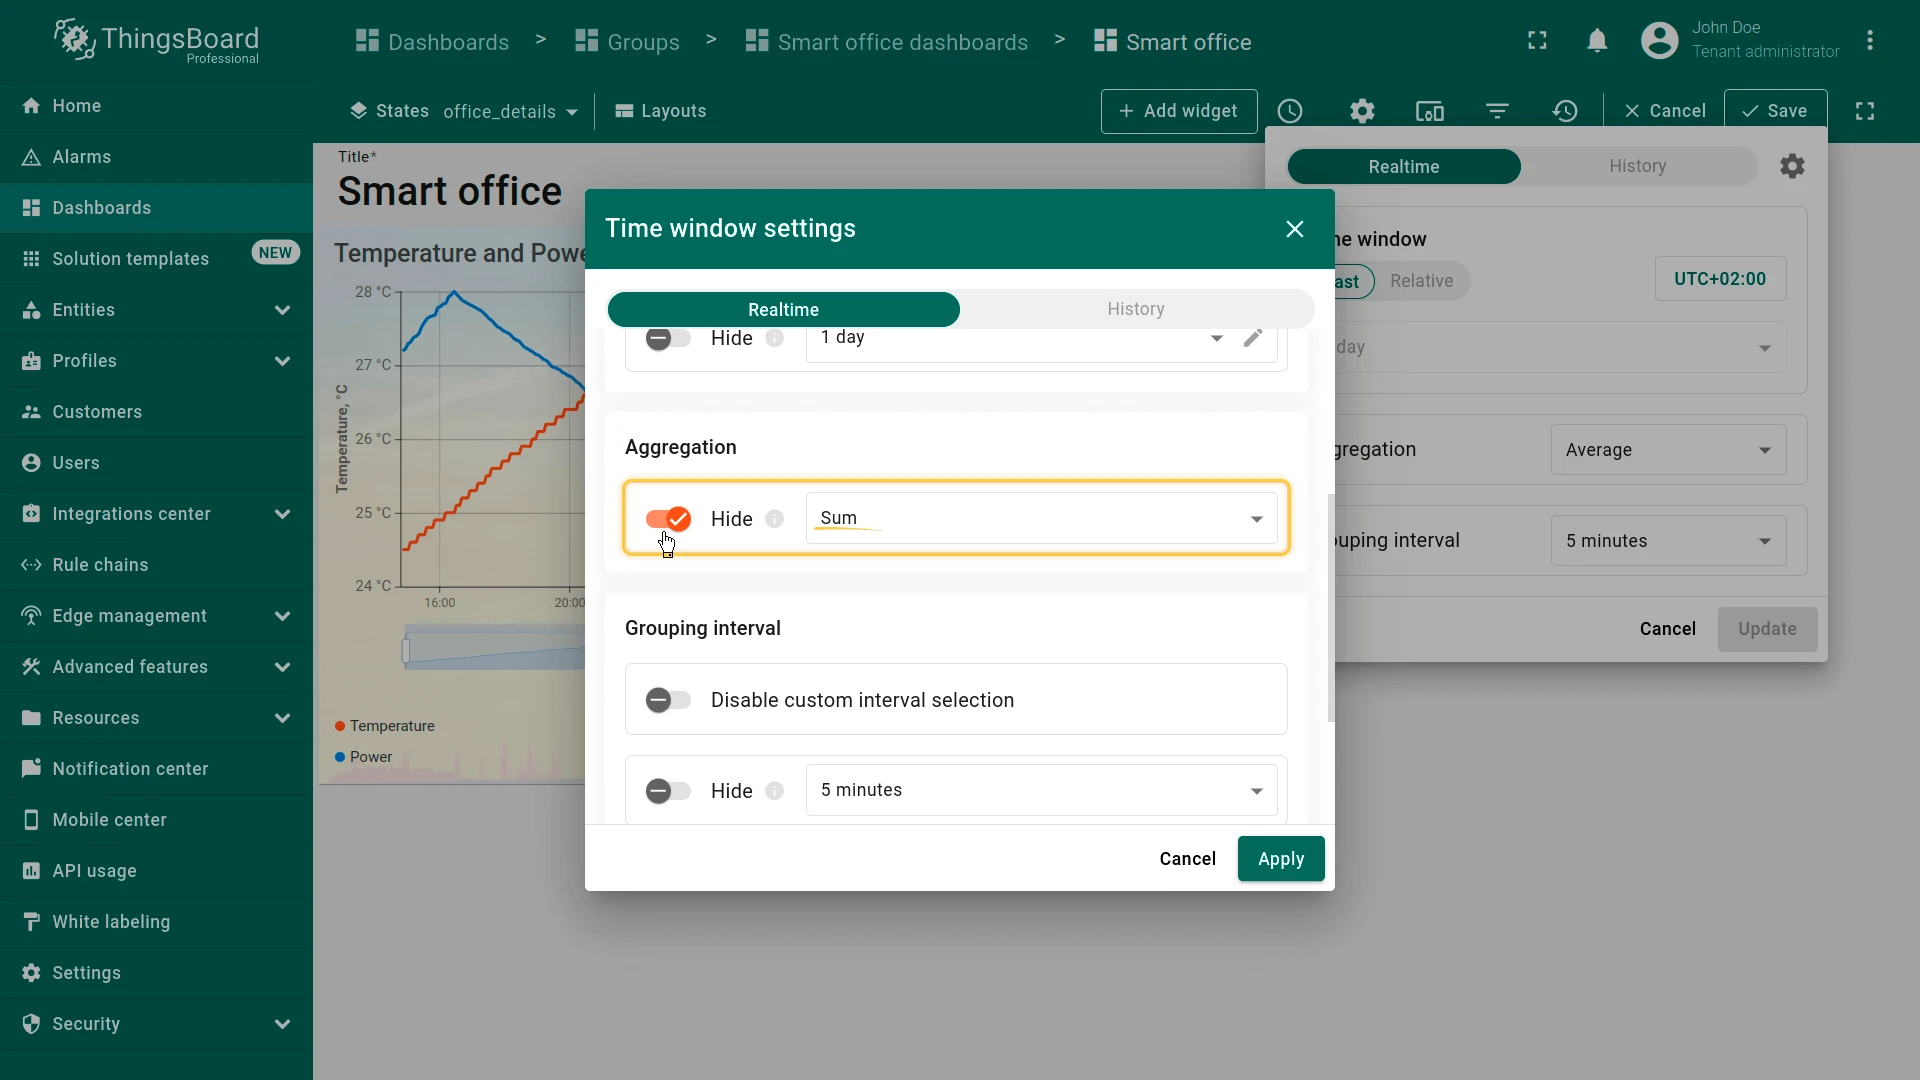
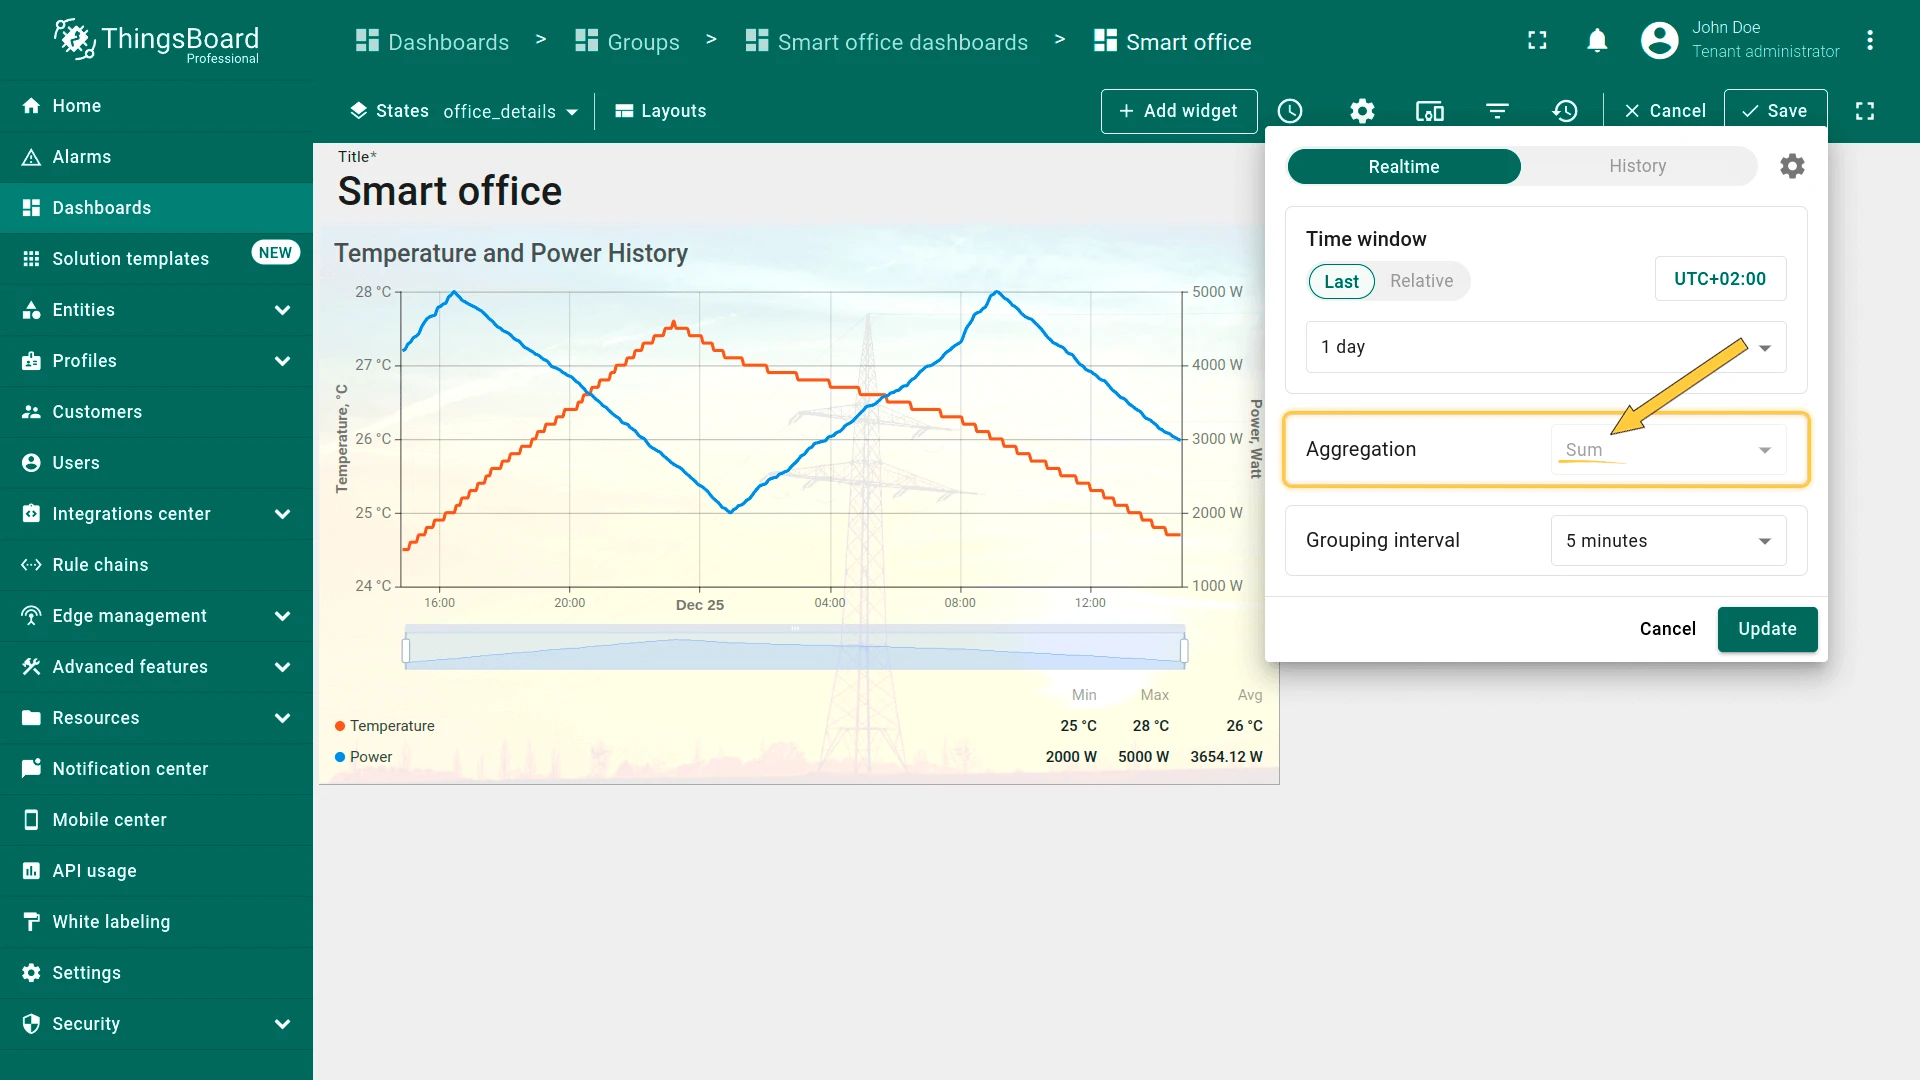
To restrict the list of available aggregation functions, click the pencil icon next to the aggregation row.
Hide the Grouping Interval
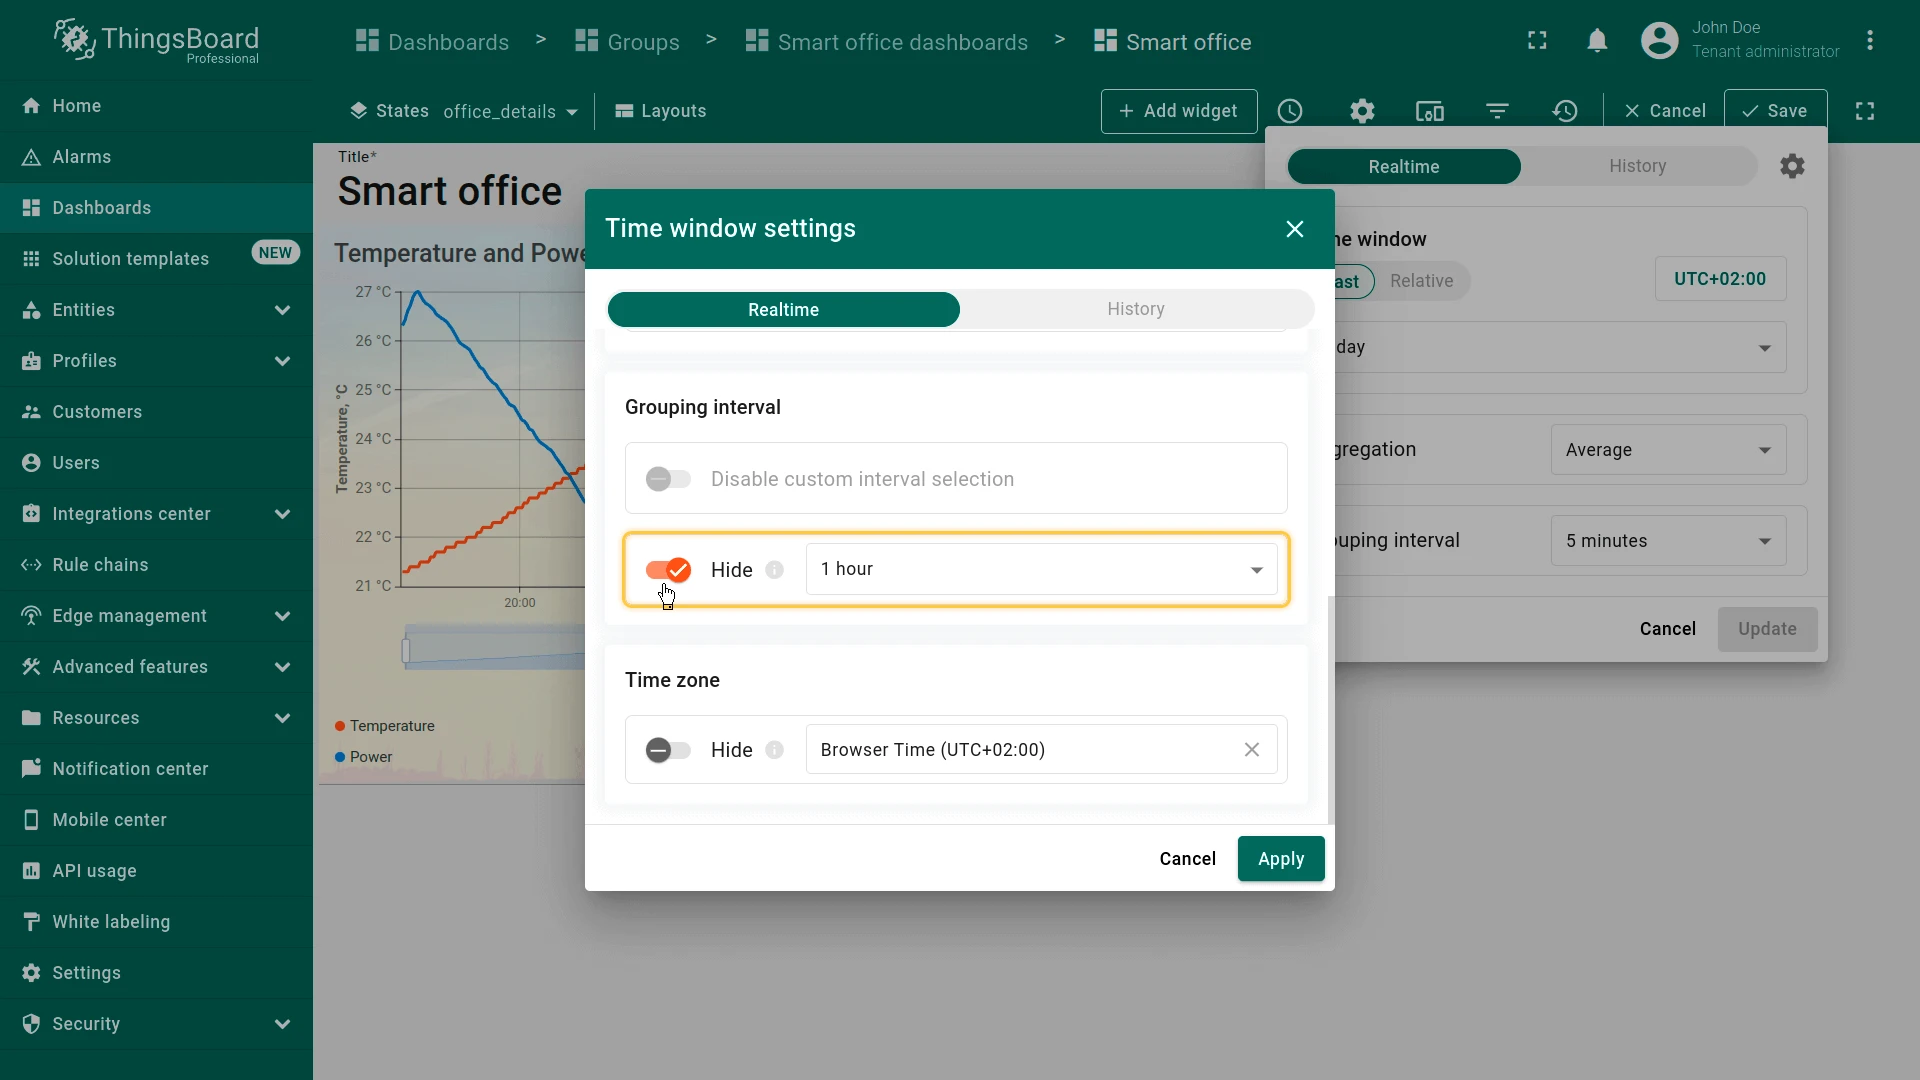
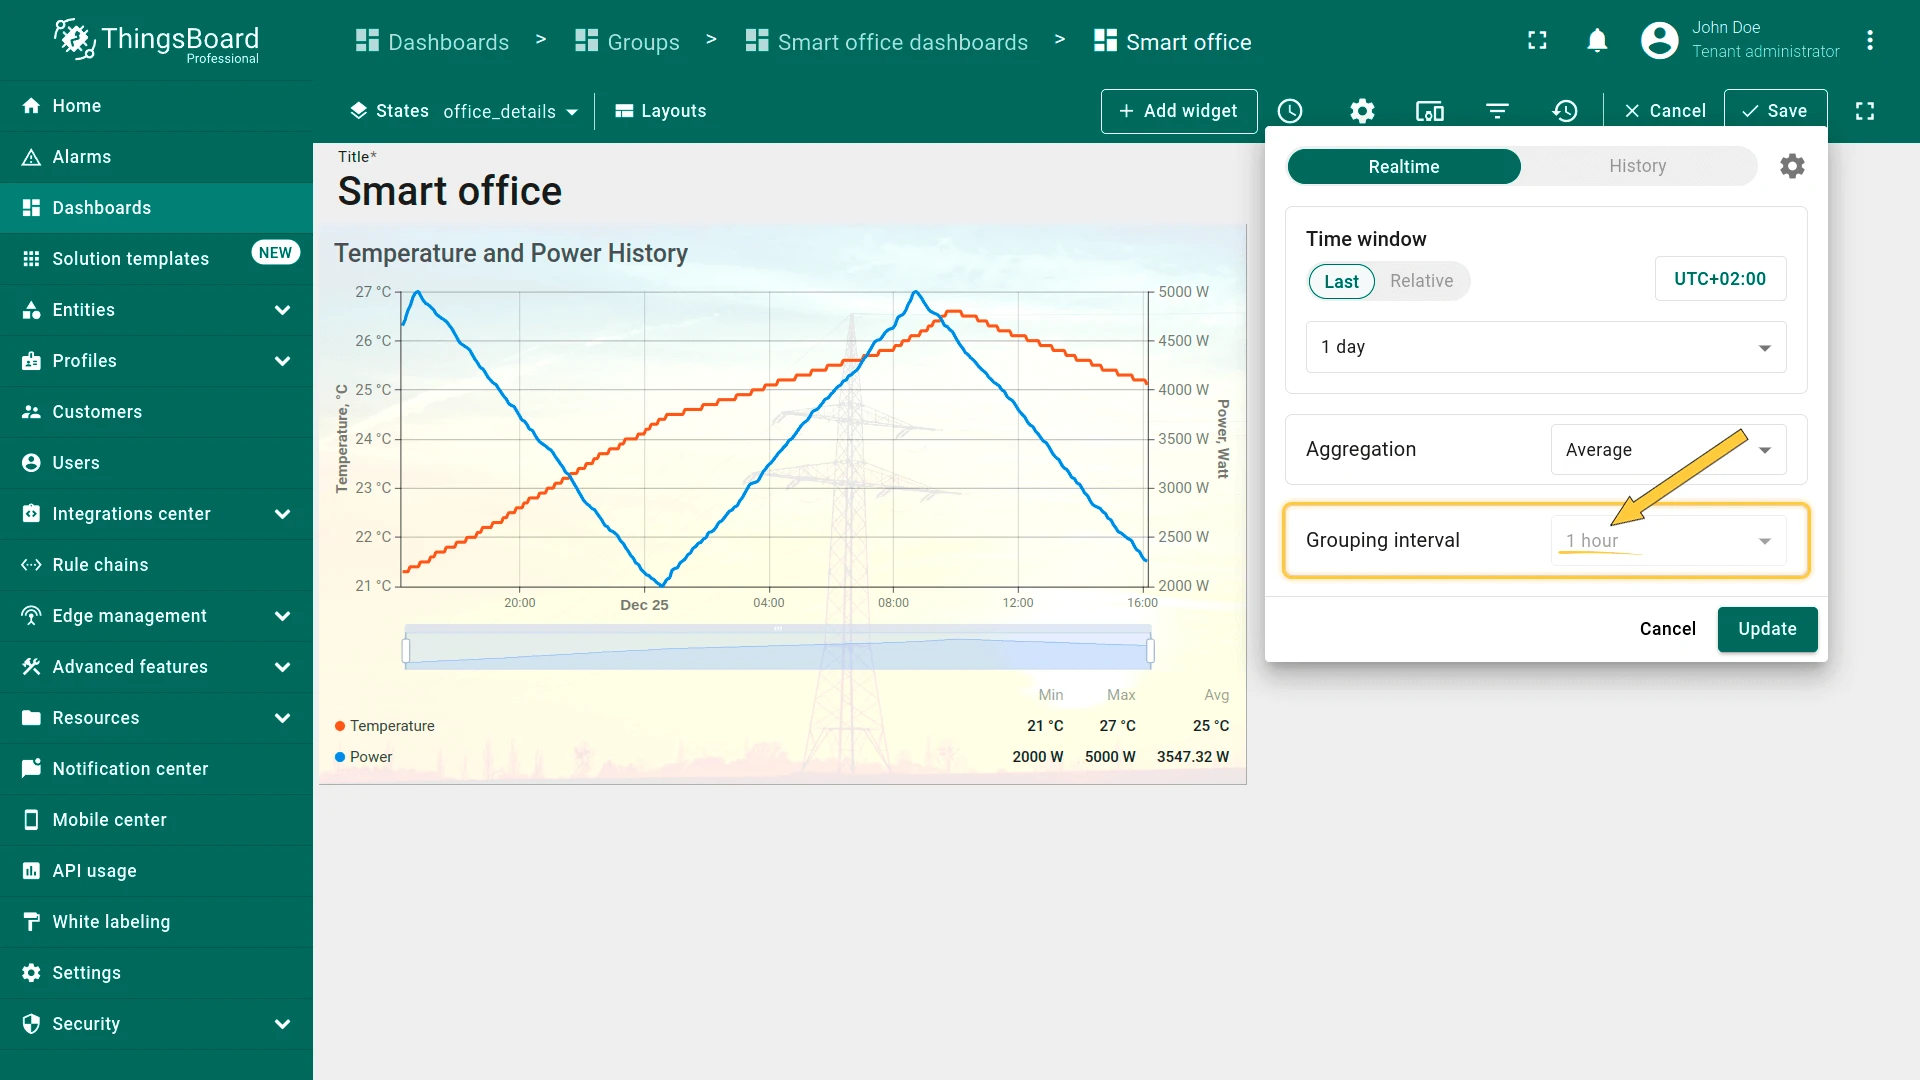
When enabled, users cannot change the configured grouping interval.
Hide the Time Zone
When enabled, users cannot change the time zone.
Was this helpful?