Tuya Integration
Tuya Integration connects ThingsBoard to the Tuya IoT Platform (Tuya Cloud). It subscribes to the Tuya Message Service and receives status reports from devices added in the Smart Life or Tuya Smart app. An uplink data converter turns each report into telemetry and attributes. ThingsBoard can also send downlink commands to the devices through the Tuya OpenAPI.
Use Tuya Integration when:
- Your devices are Tuya-based and already connected to Tuya Cloud through the Smart Life or Tuya Smart app.
- You want to monitor them in ThingsBoard dashboards and process their data in the Rule Engine.
- You need to control them from ThingsBoard, for example switch a smart plug on or off.
This guide uses a Tuya Smart Plug. A virtual Tuya device works for testing too.
Architecture
Section titled “Architecture”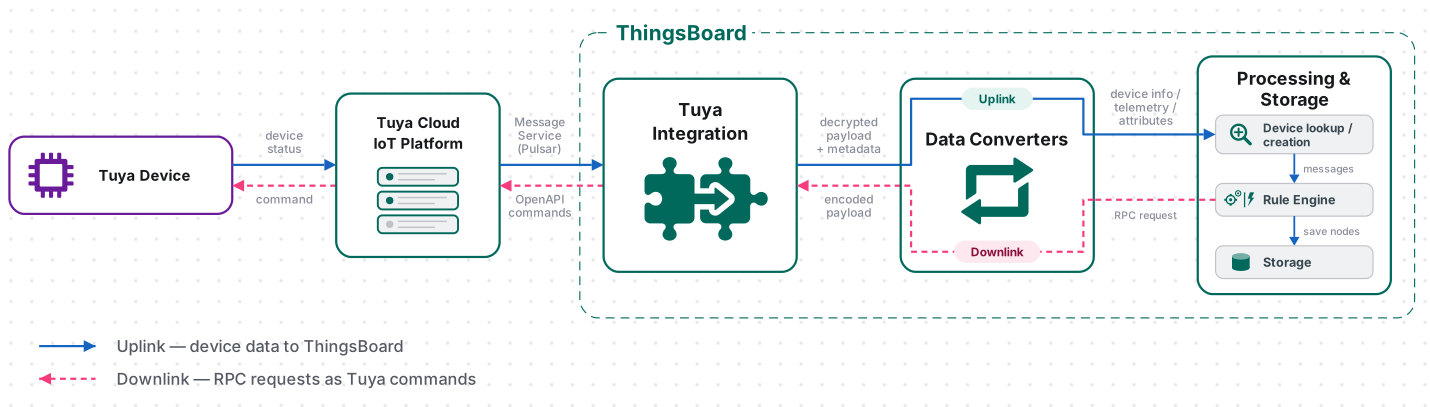
- Receive data. The device reports its status to Tuya Cloud over Wi-Fi. The integration subscribes to the Message Service (an Apache Pulsar queue) with your cloud project credentials and receives each status report.
- Decode the payload. The integration decrypts the report and passes it to the uplink converter, which returns the device name, telemetry, and attributes.
- Process the message. ThingsBoard processes the converted data through the Rule Engine. If Allow create devices or assets is enabled, ThingsBoard creates the device on its first report.
- Send downlink data (optional). The Rule Engine passes an RPC message to the integration. The downlink converter encodes it as a Tuya command, and the integration sends it to the Tuya OpenAPI, which delivers it to the device.
Prerequisites
Section titled “Prerequisites”- Access to ThingsBoard or ThingsBoard Cloud with integrations enabled for your tenant.
- Permission to create integrations and data converters, and to edit rule chains for downlink.
- A Tuya IoT Platform account. To create one, see Create a Tuya IoT Platform Account.
- An active IoT Core subscription of the cloud project (the free trial is enough) to send commands to devices. Status reports arrive without it. Check it in Cloud ⇾ Cloud Services.
- A Tuya device (physical or virtual) added in the Smart Life or Tuya Smart app. To add a smart plug, see Register the Smart Plug in the Tuya App.
Set Up Tuya
Section titled “Set Up Tuya”Add the device to the Tuya app, create a cloud project, enable the Message Service, and link the app account to the project.
Register the Smart Plug in the Tuya App
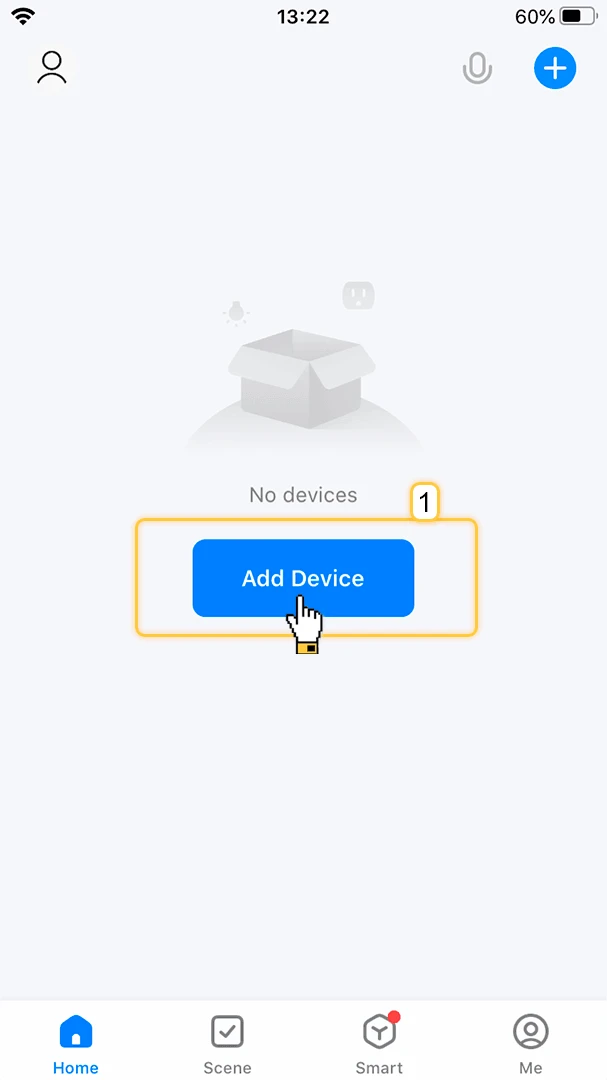
Section titled “Register the Smart Plug in the Tuya App”- Open the Smart Life (or Tuya Smart) app and tap Add Device.
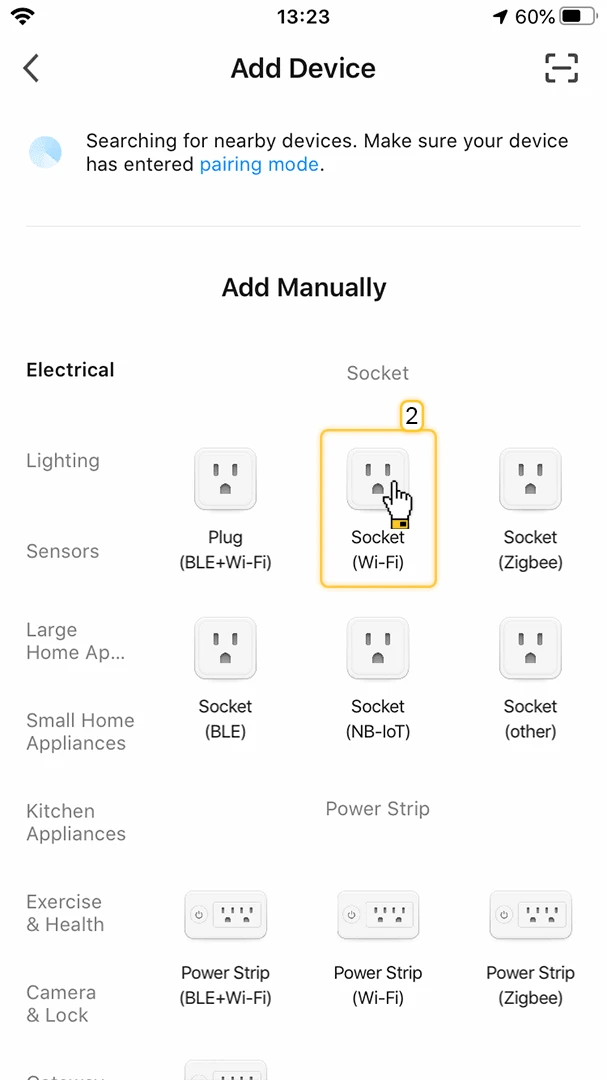
- Open the Electrical category and tap Socket (Wi-Fi).
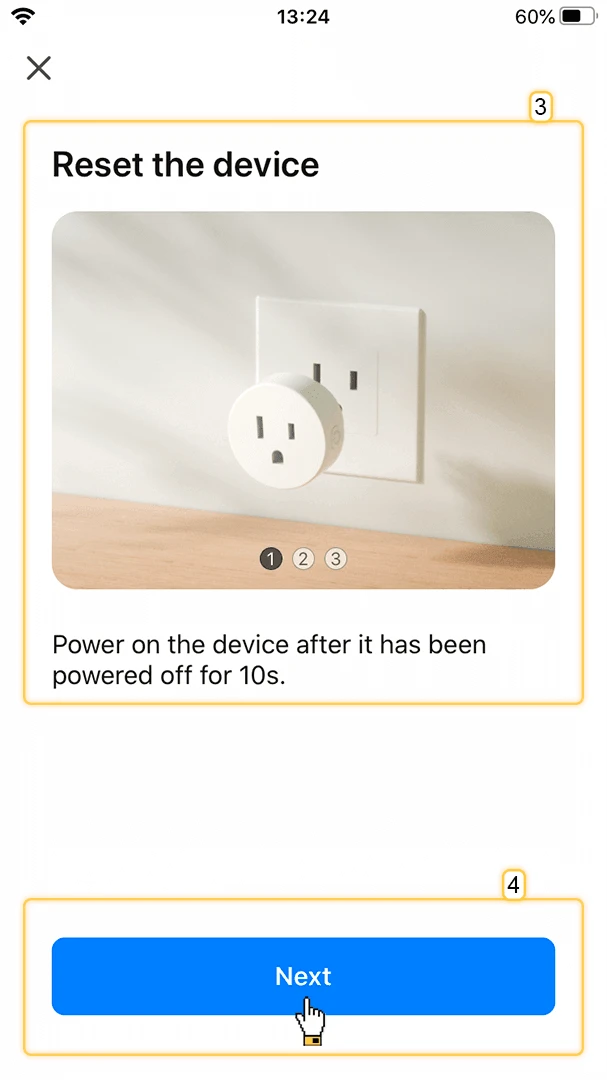
- Power the plug off for 10 seconds, then power it back on.
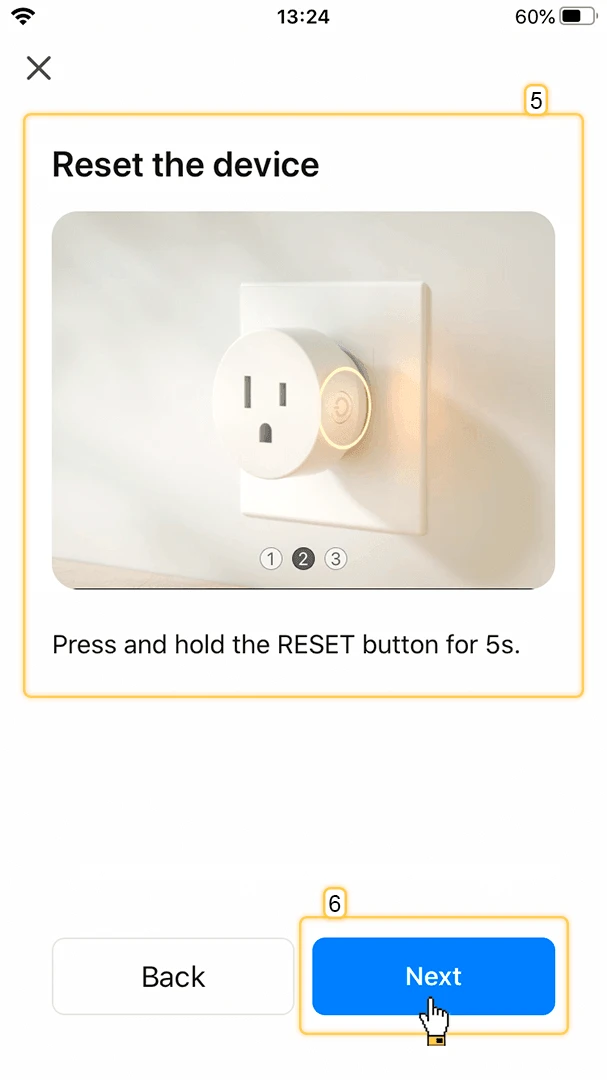
- Press and hold the RESET button for 5 seconds.
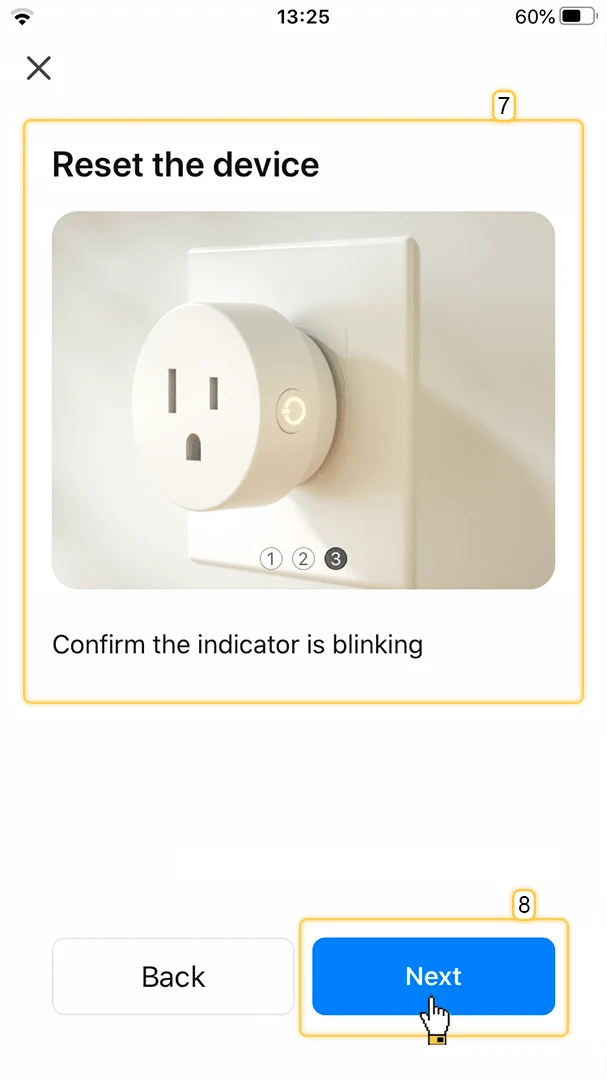
- Check that the indicator blinks rapidly, then tap Next.
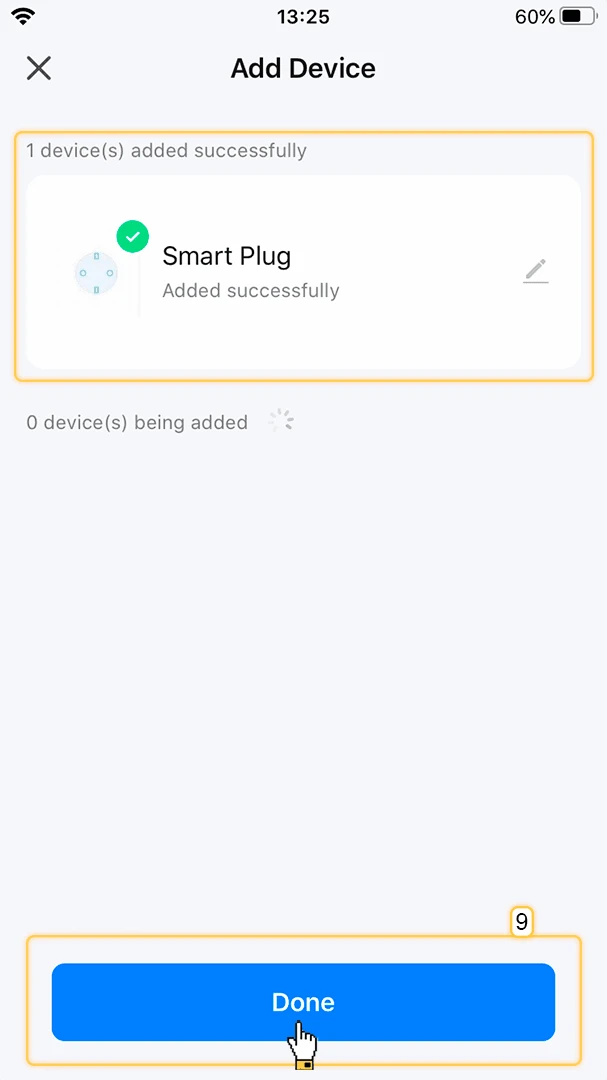
- Wait until the app adds the device, then tap Done.
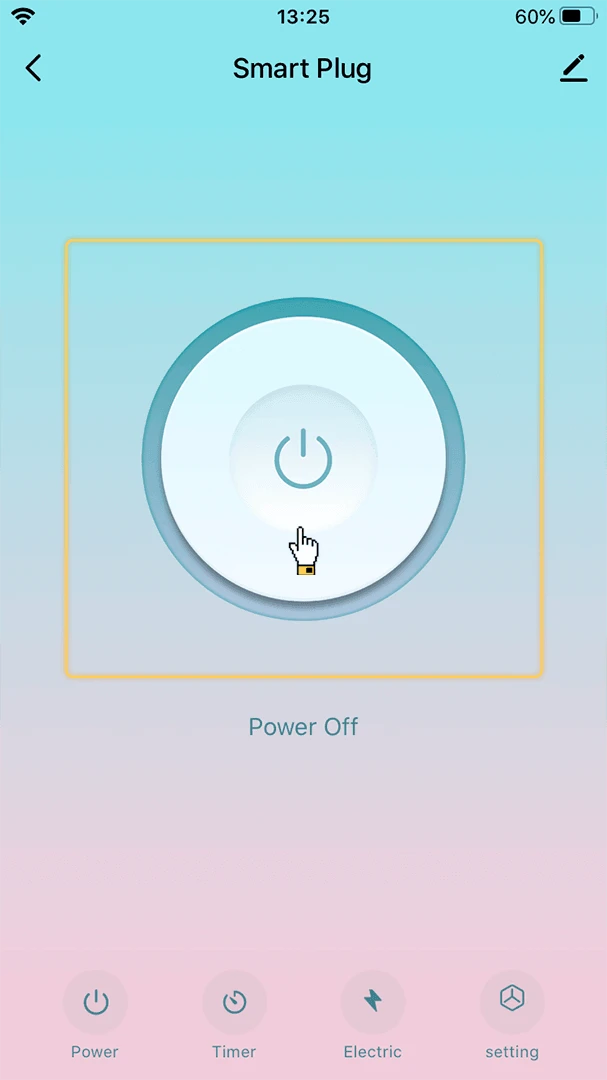
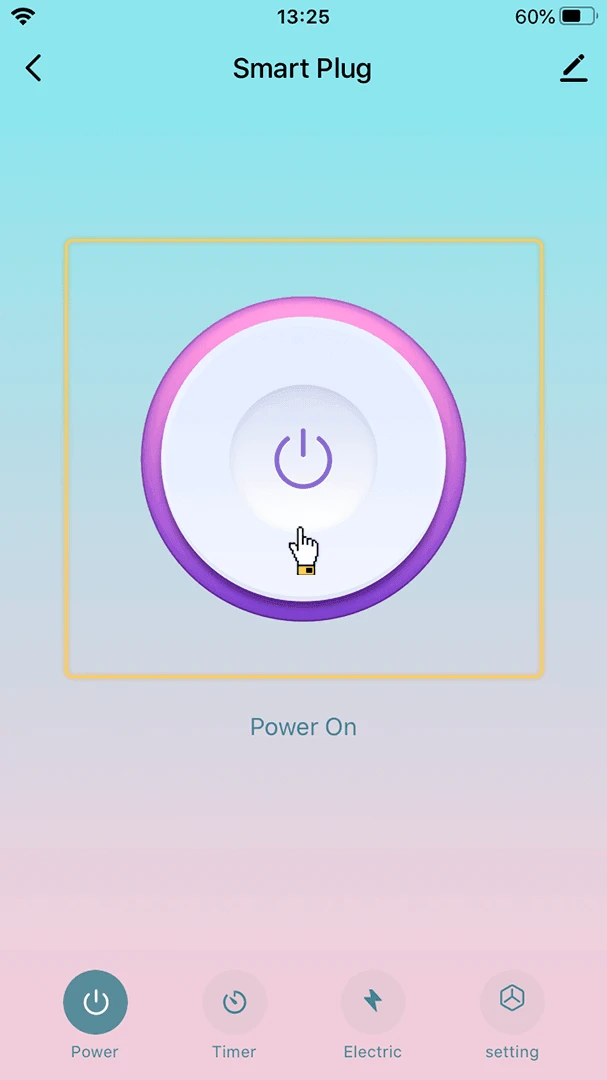
- Open the device card and tap the power button to check that the plug responds.
Create a Tuya IoT Platform Account
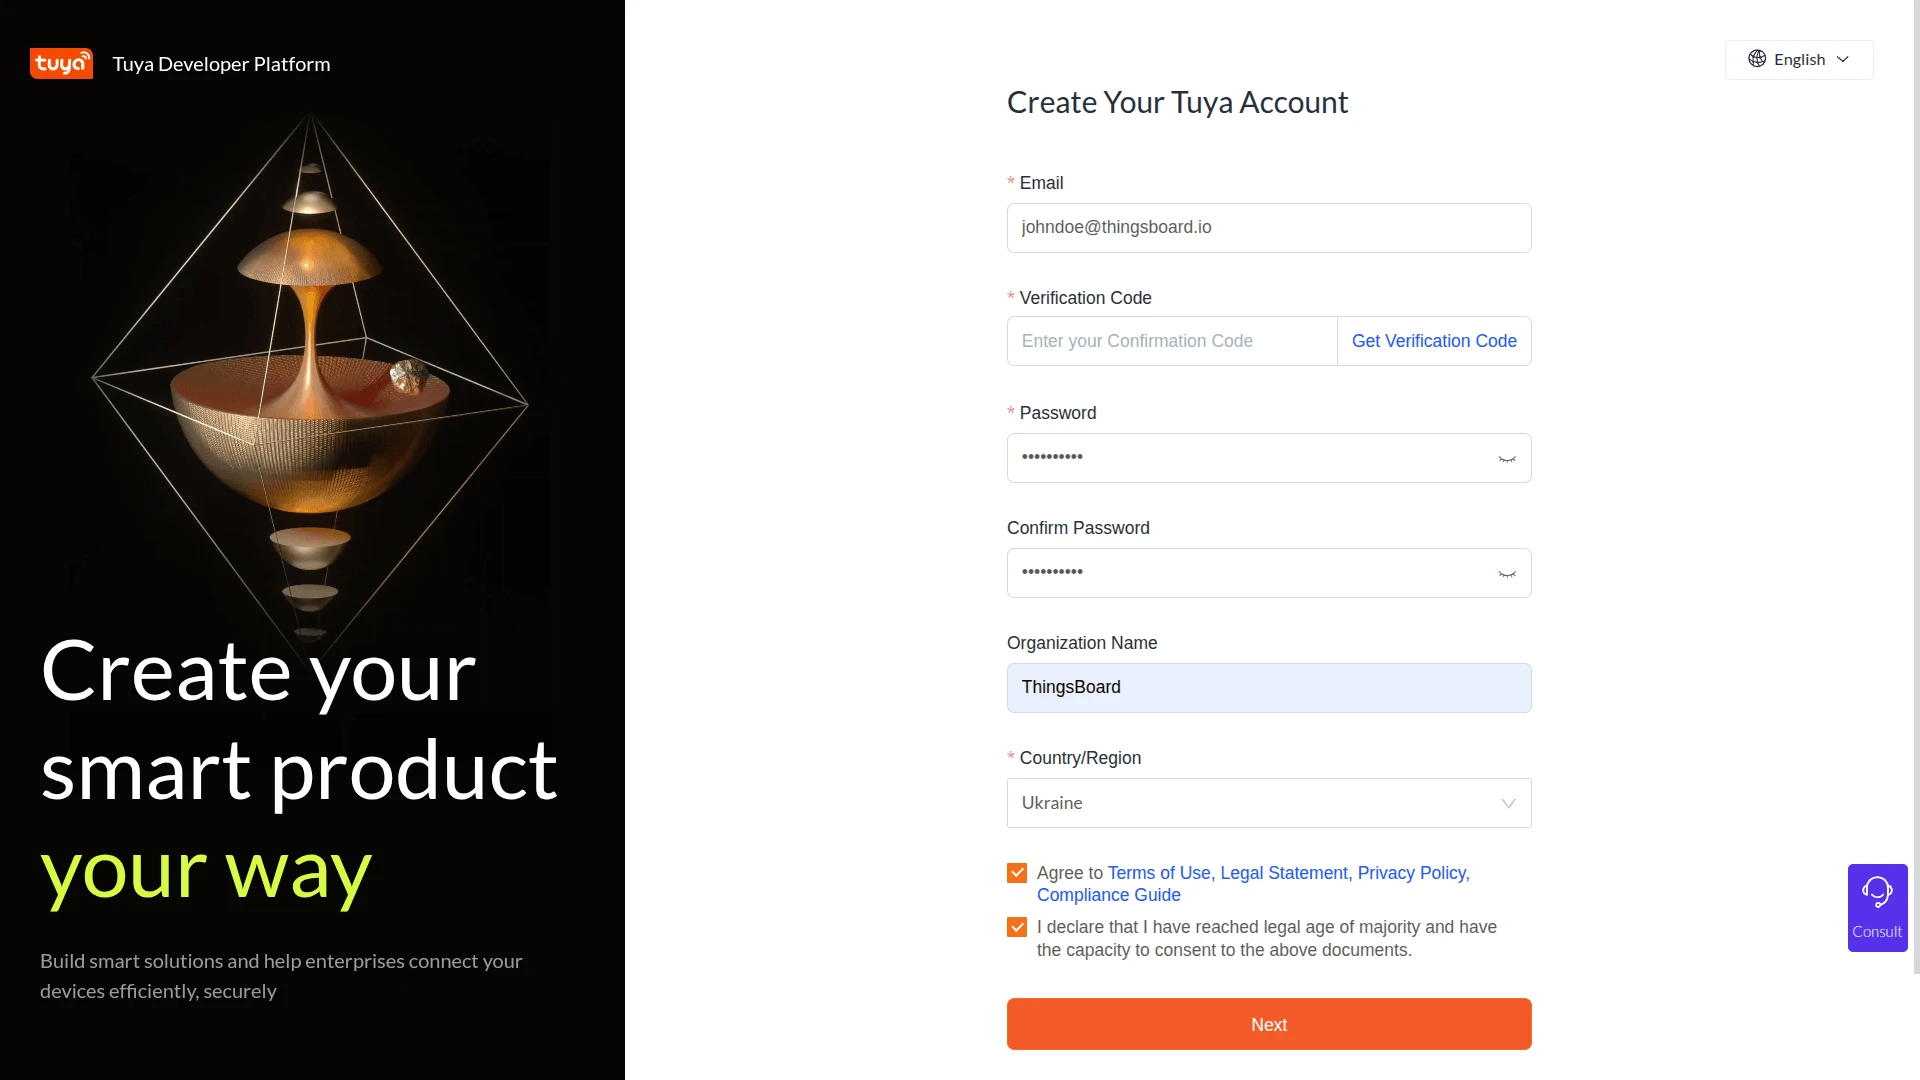
Section titled “Create a Tuya IoT Platform Account”- Open the Tuya IoT Platform login page and click Sign Up.
- Enter your Email, the Verification Code sent to it, a Password, the Organization Name, and the Country/Region. Accept the terms and click Next.
- Log in with the new account.

Create a Cloud Project
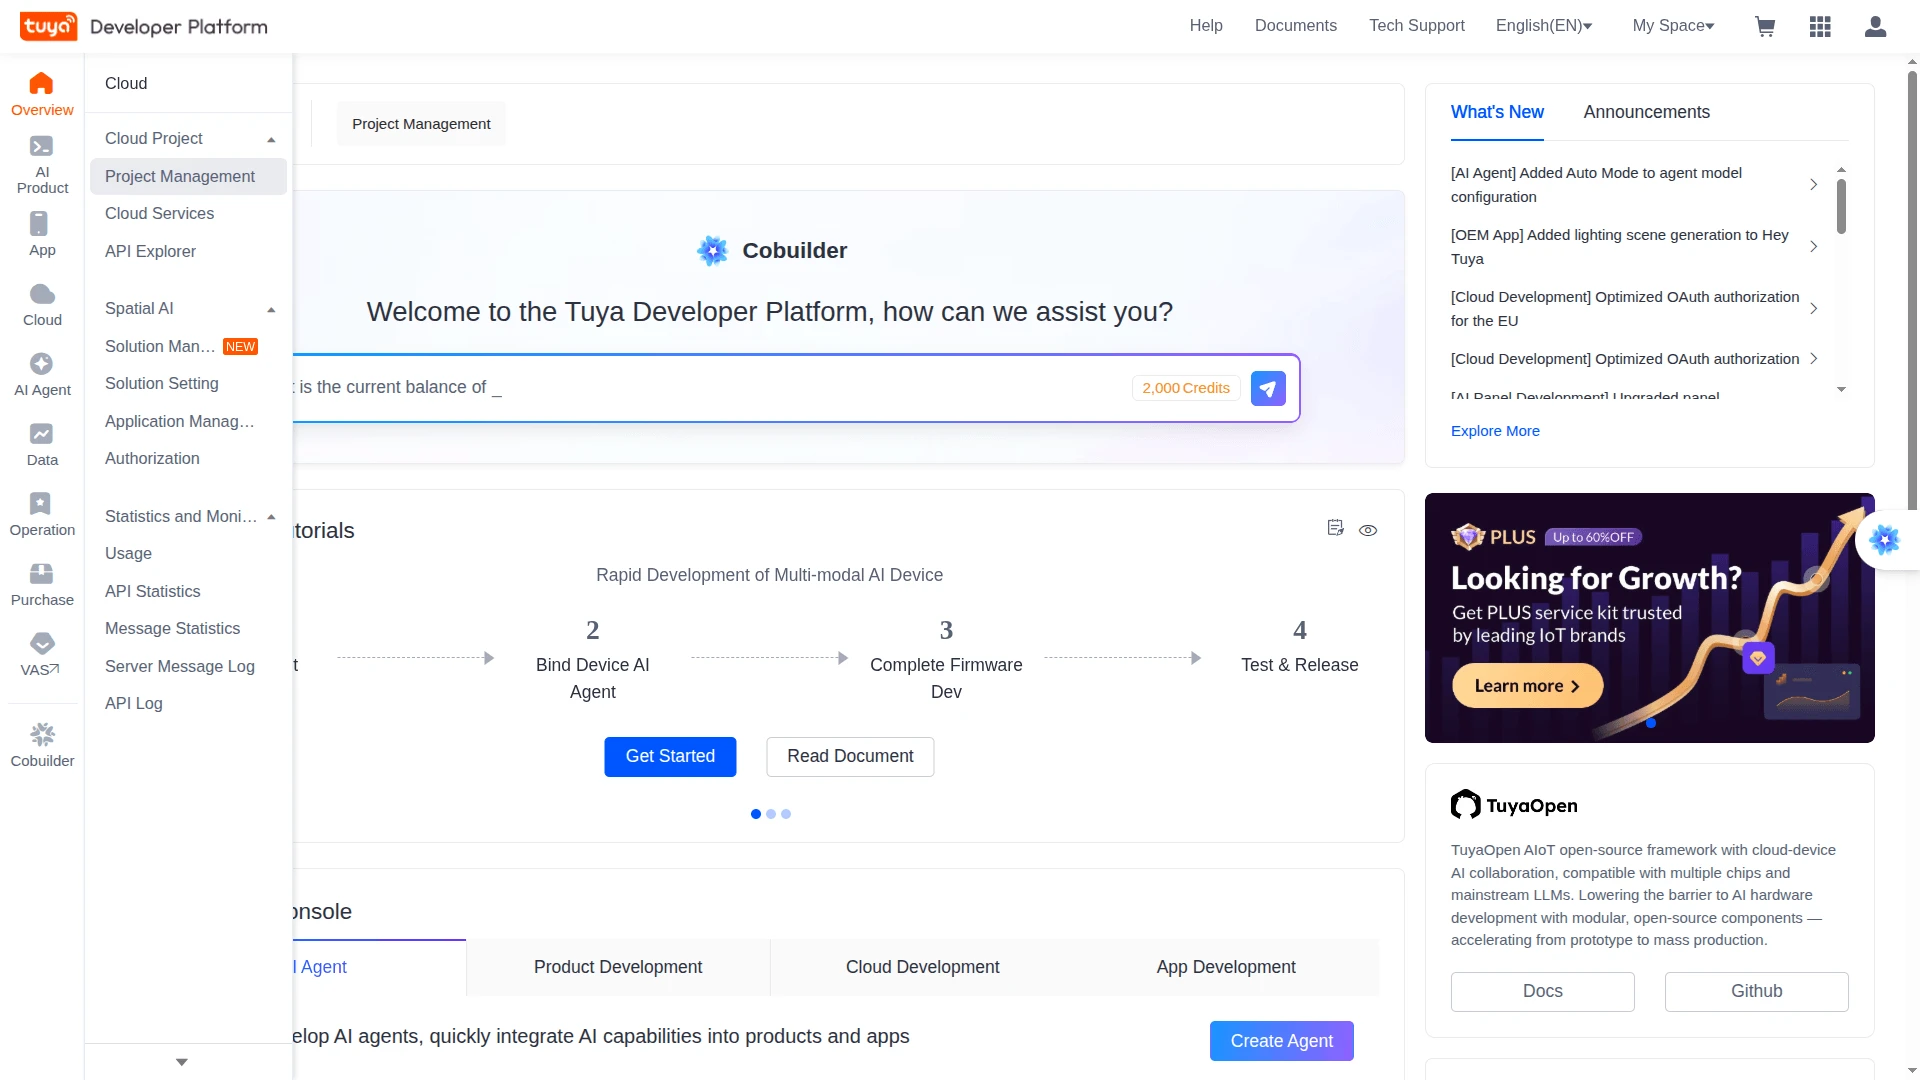
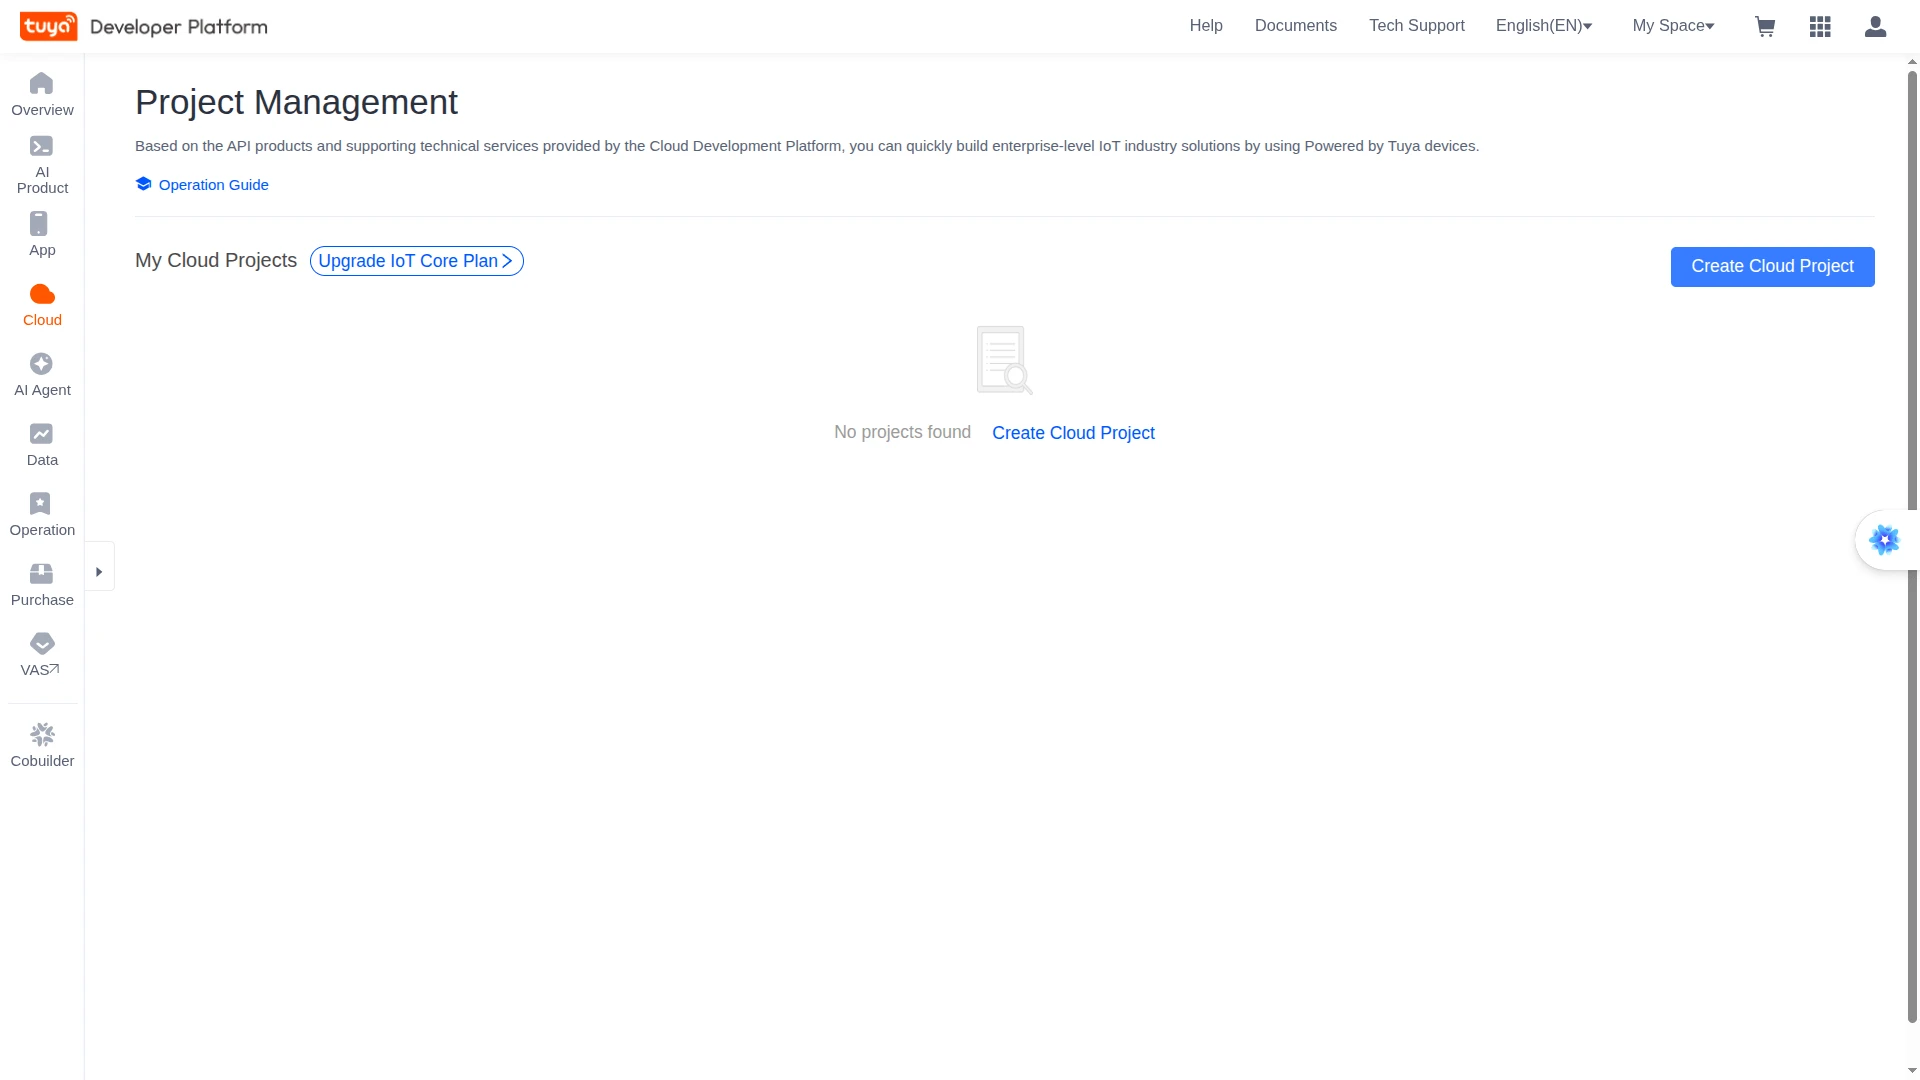
Section titled “Create a Cloud Project”- In the sidebar, go to Cloud ⇾ Cloud Project ⇾ Project Management.
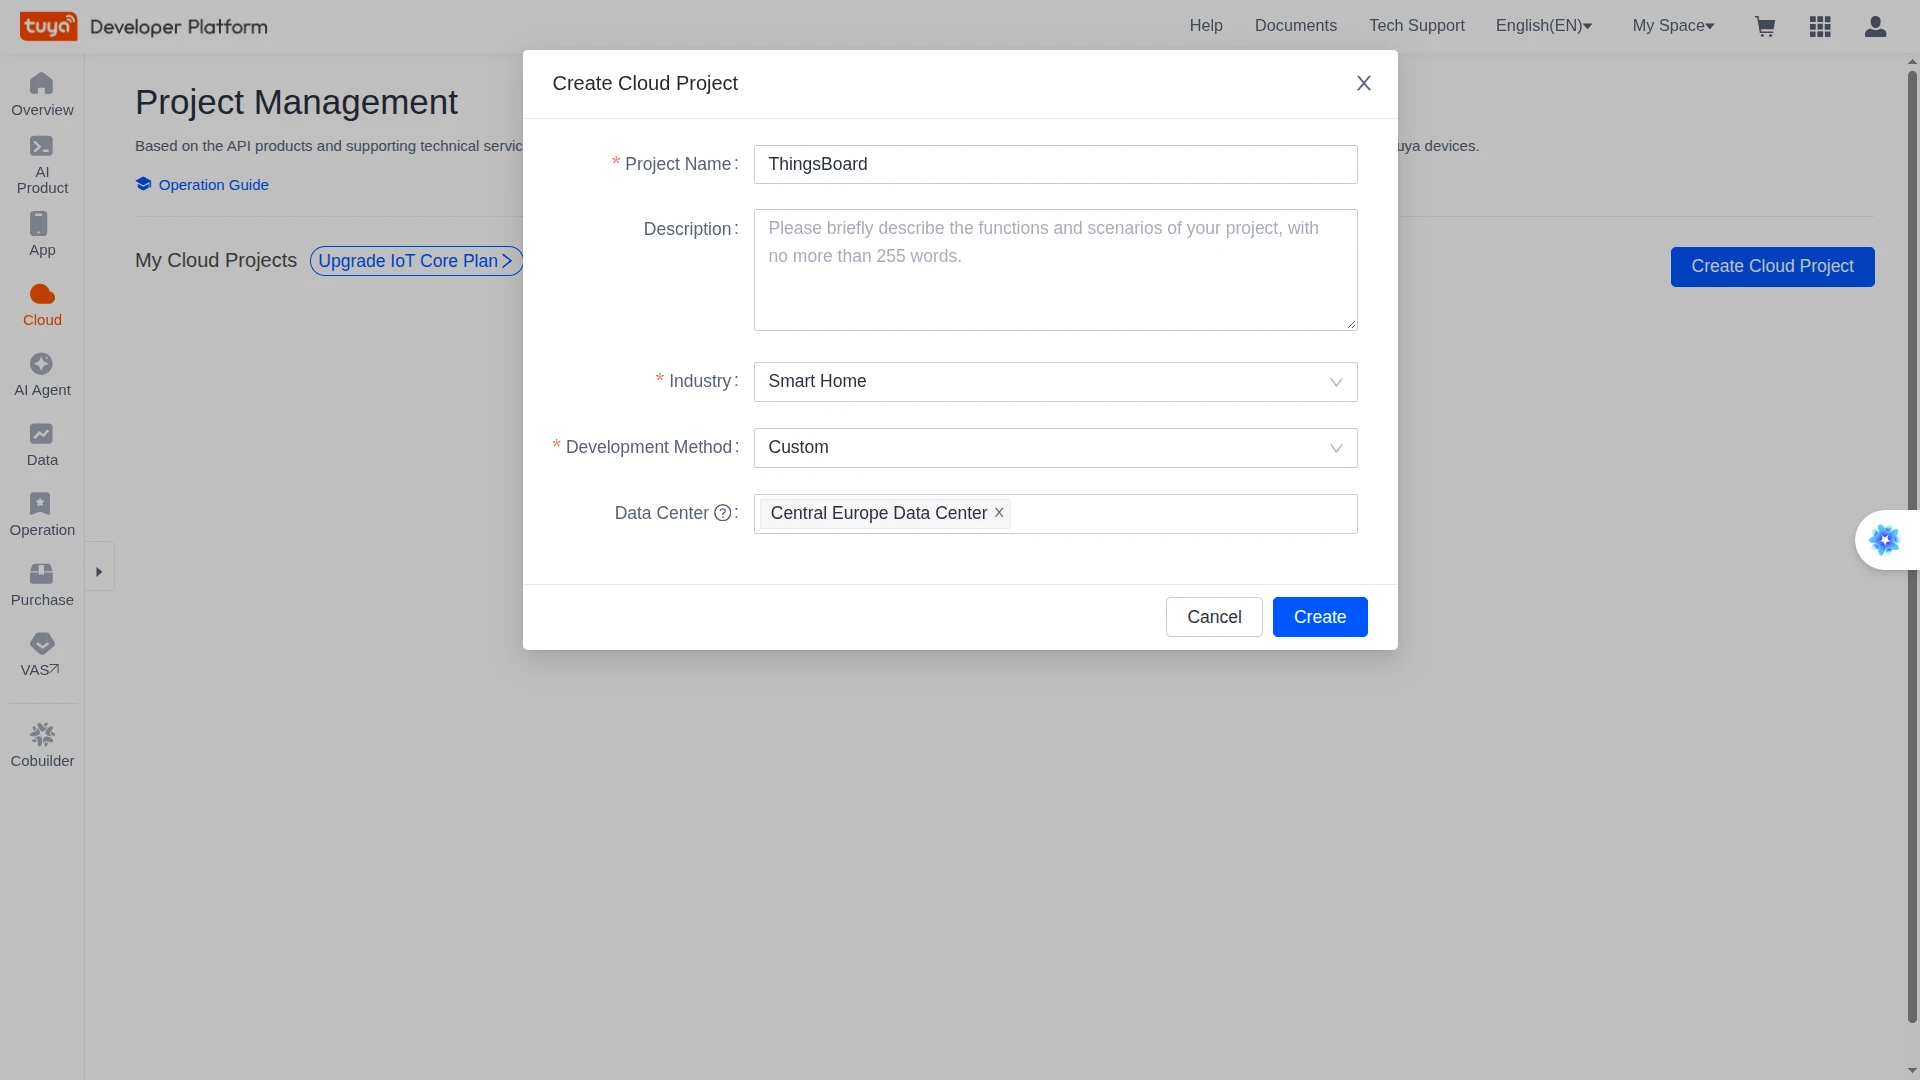
- Click Create Cloud Project. Enter a Project Name (for example,
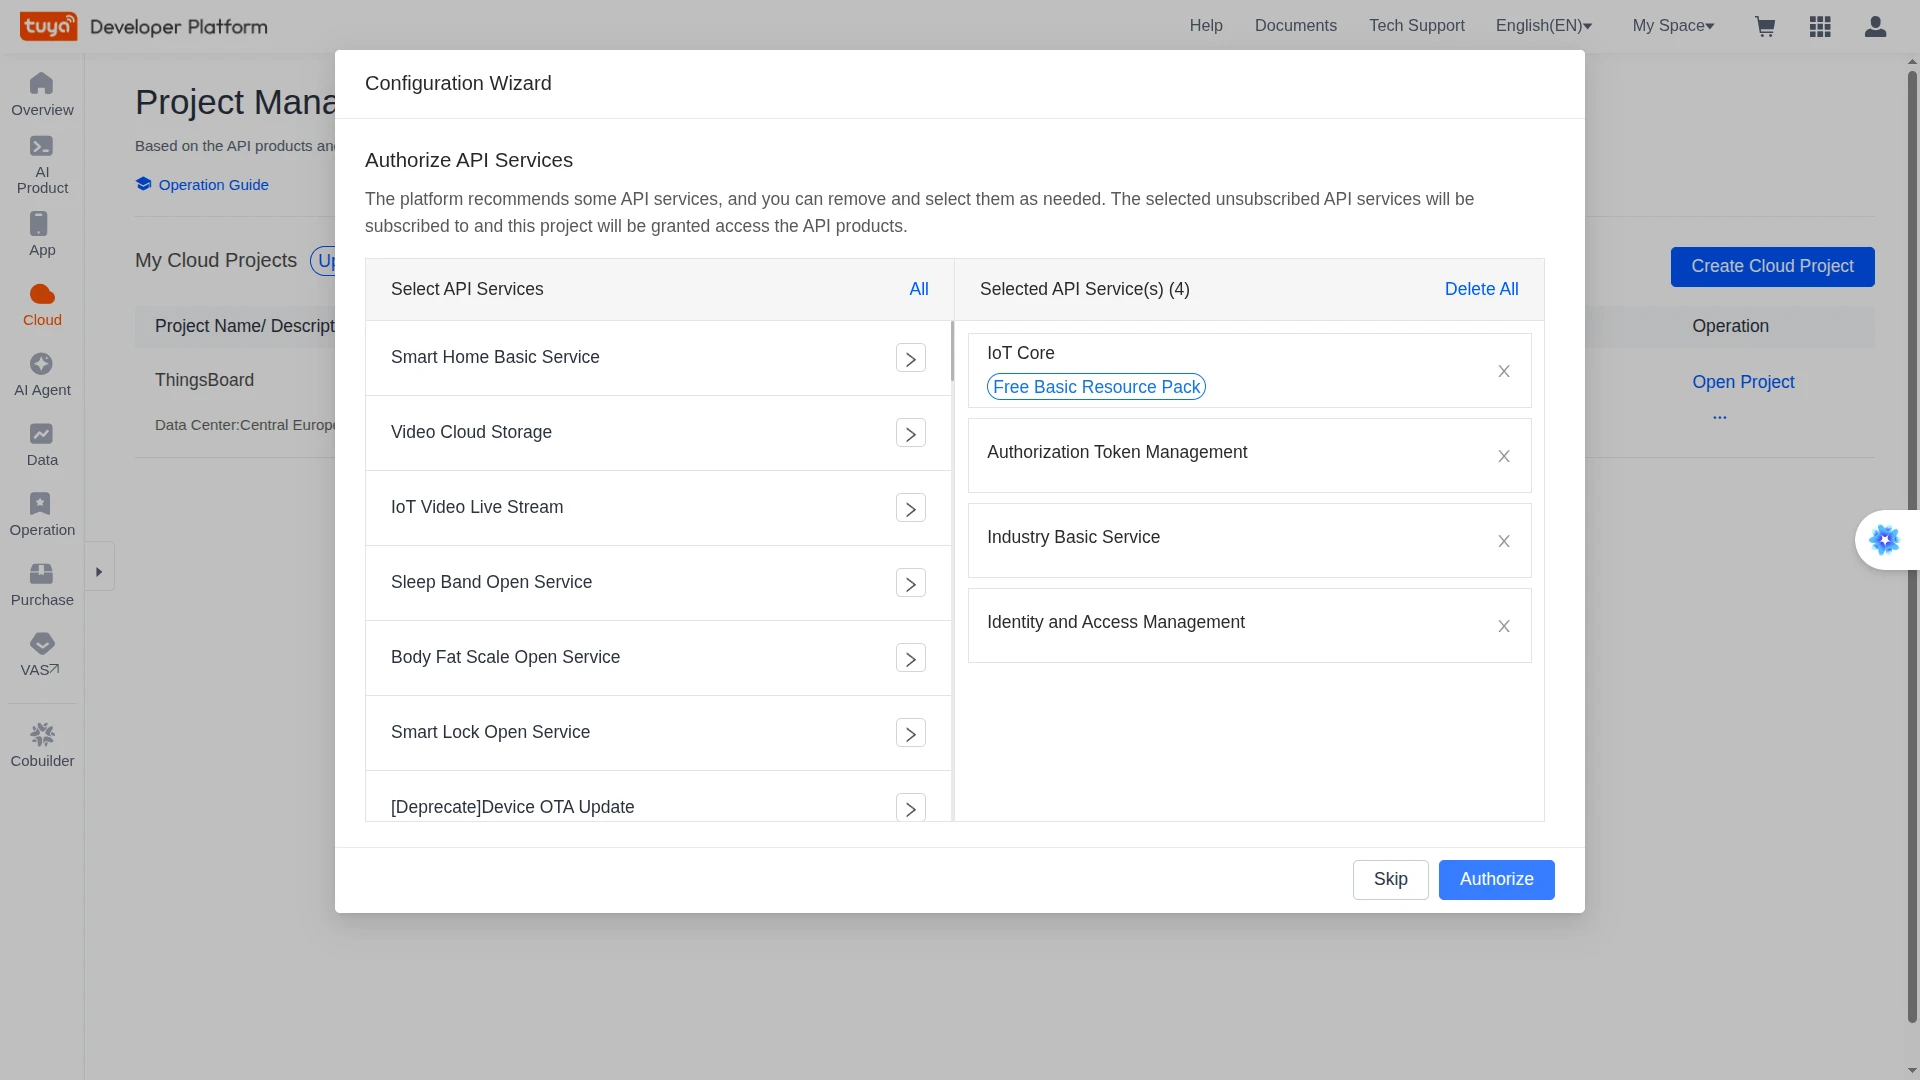
ThingsBoard), choose an Industry and a Development Method (for example, Custom), and select the Data Center. Click Create. - On the Authorize API Services screen, keep the recommended services (IoT Core is required) and click Authorize.
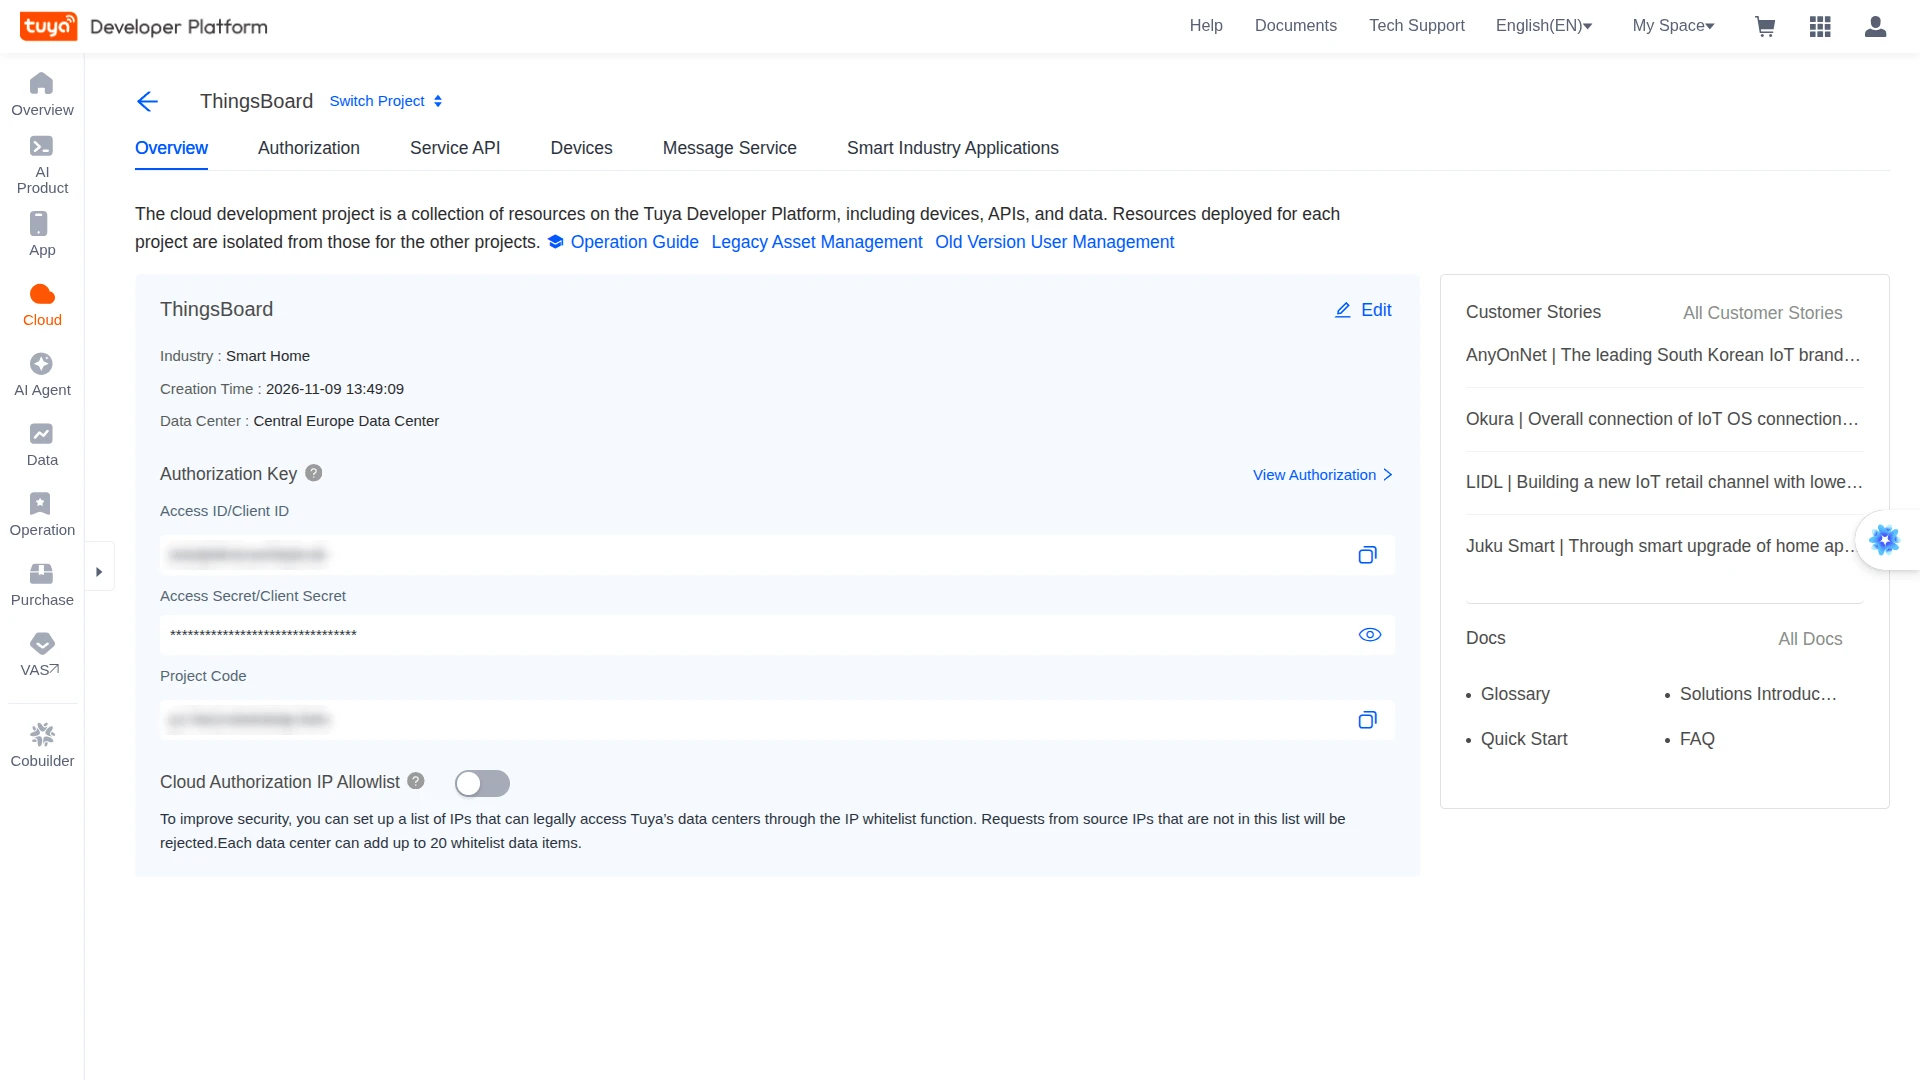
- On the project Overview page, copy the Access ID/Client ID and Access Secret/Client Secret under Authorization Key. You need them, together with the data center, to create the integration.
Enable the Message Service
Section titled “Enable the Message Service”The Message Service pushes device status reports to subscribers such as the integration. Without it, no uplinks arrive.
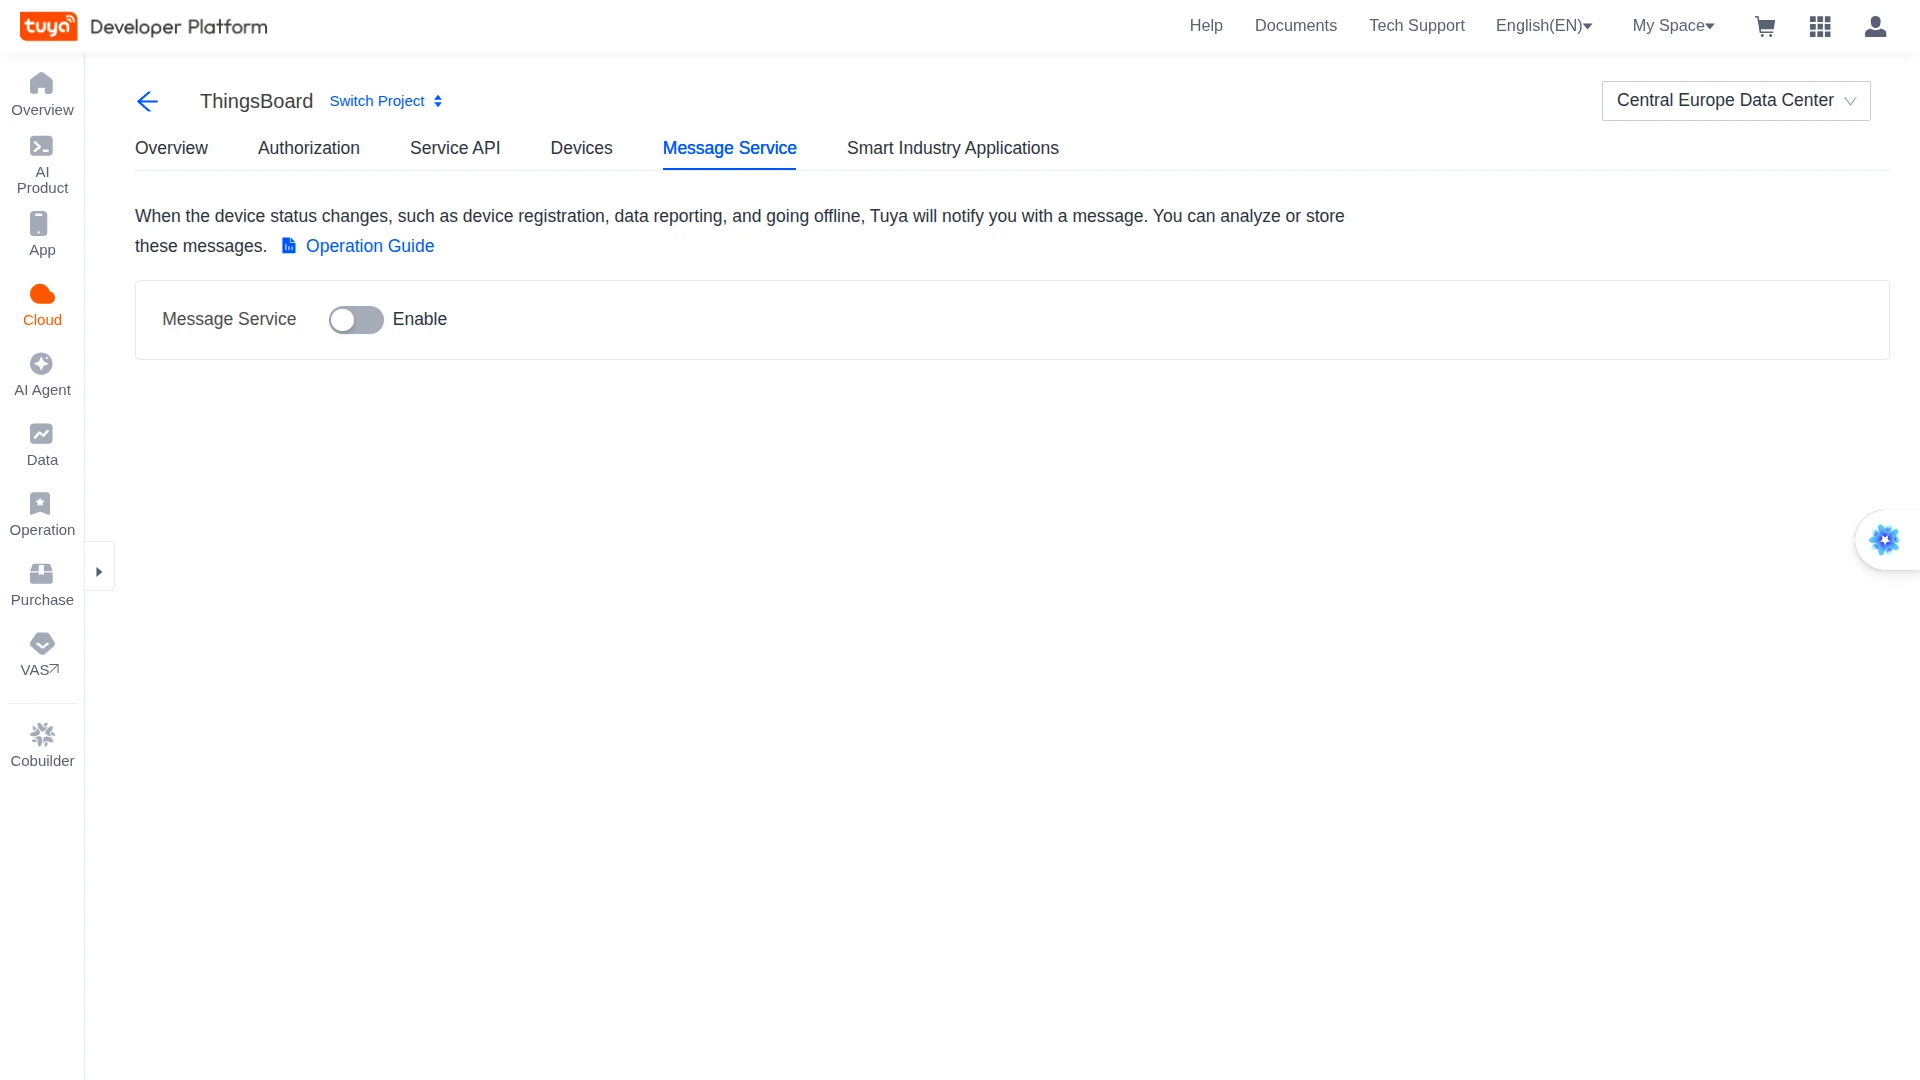
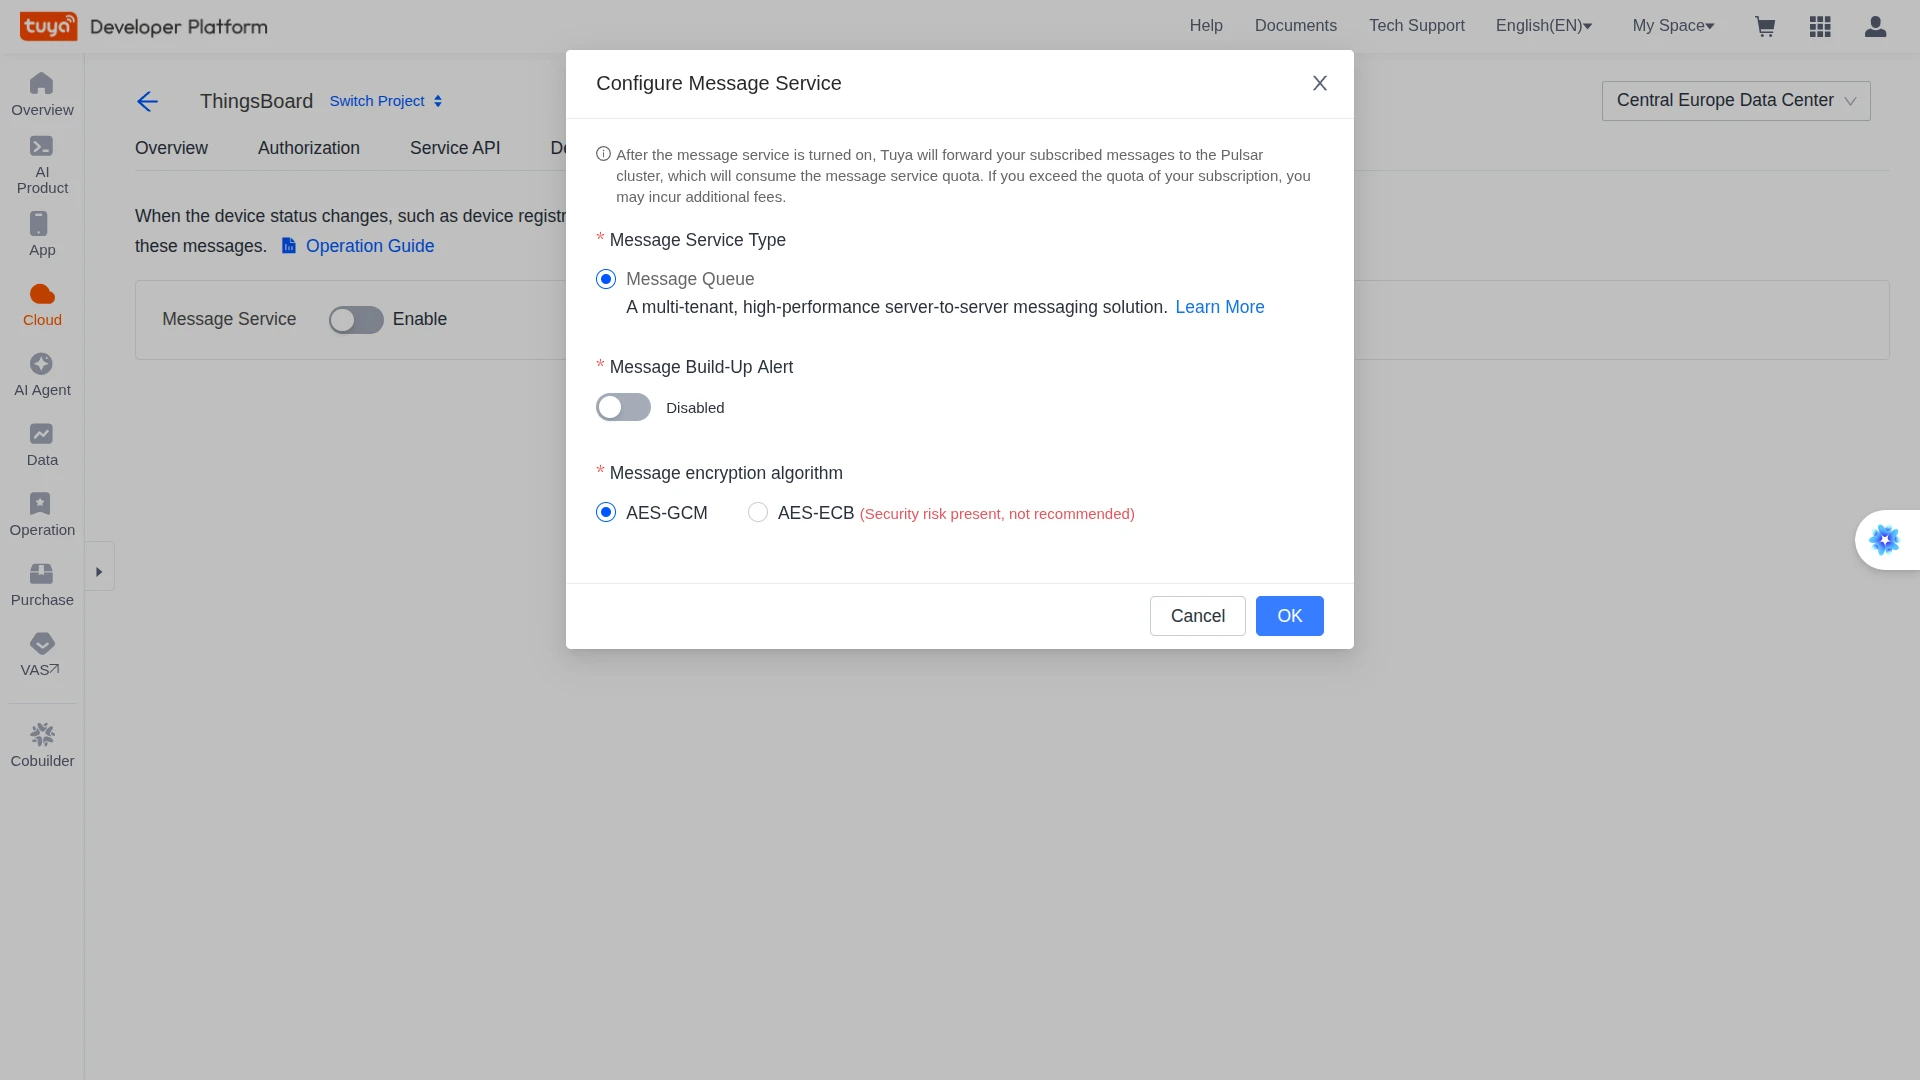
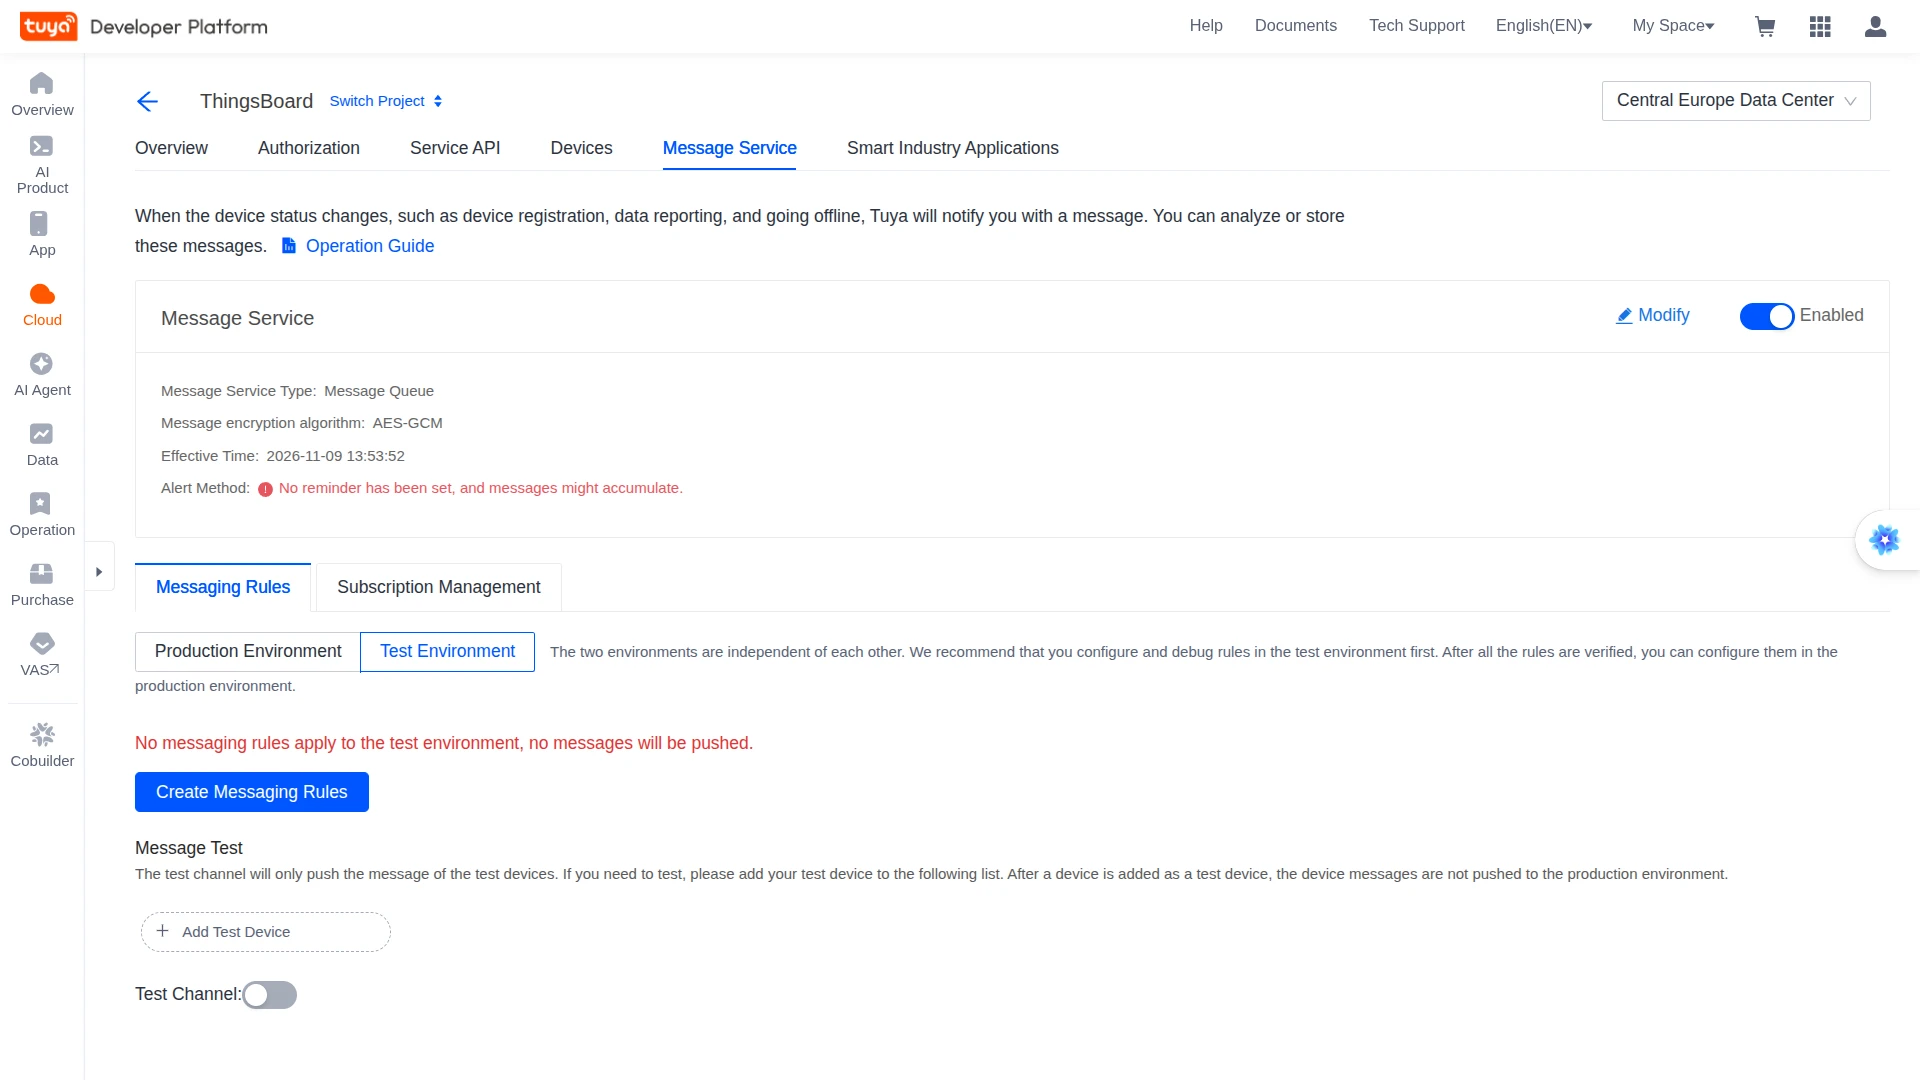
- In the cloud project, open the Message Service tab and turn on Message Service.
- In the Configure Message Service dialog, select the Message Service Type and the Message encryption algorithm, then click OK. The integration decrypts both AES-ECB and AES-GCM messages.
- Check that the tab shows the service as Enabled.
Configure Messaging Rules
Section titled “Configure Messaging Rules”A messaging rule defines which messages Tuya pushes. Tuya keeps separate rules and subscriptions for two environments:
| Tuya environment | Devices | Integration Environment |
|---|---|---|
| Production | Real (physical) devices. | PROD |
| Test | Only devices you add as test devices, for example virtual devices. | TEST |
The rule must be enabled in the environment where your device reports, and the integration must use the same environment. Otherwise the integration connects, but no uplinks arrive.
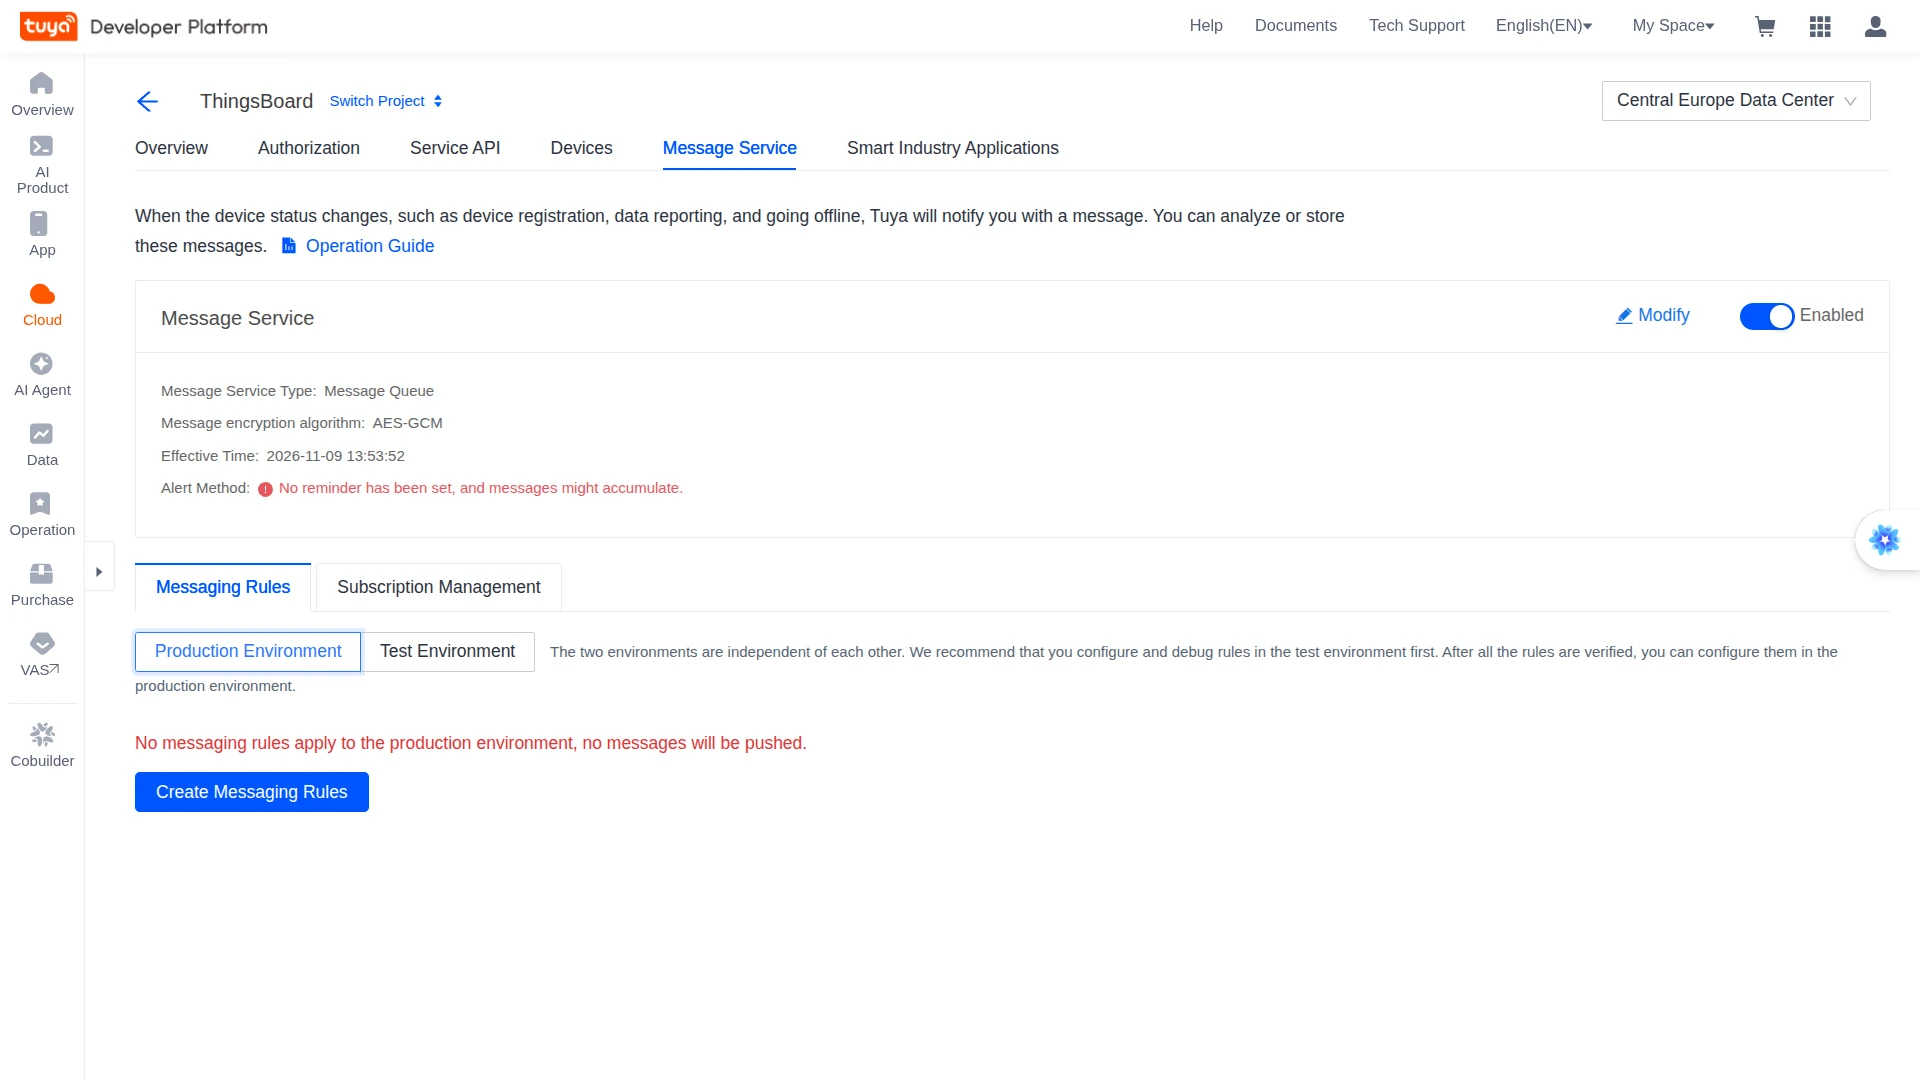
- In the cloud project, open Message Service ⇾ Messaging Rules and select Production Environment for a real device, or Test Environment for a test device.
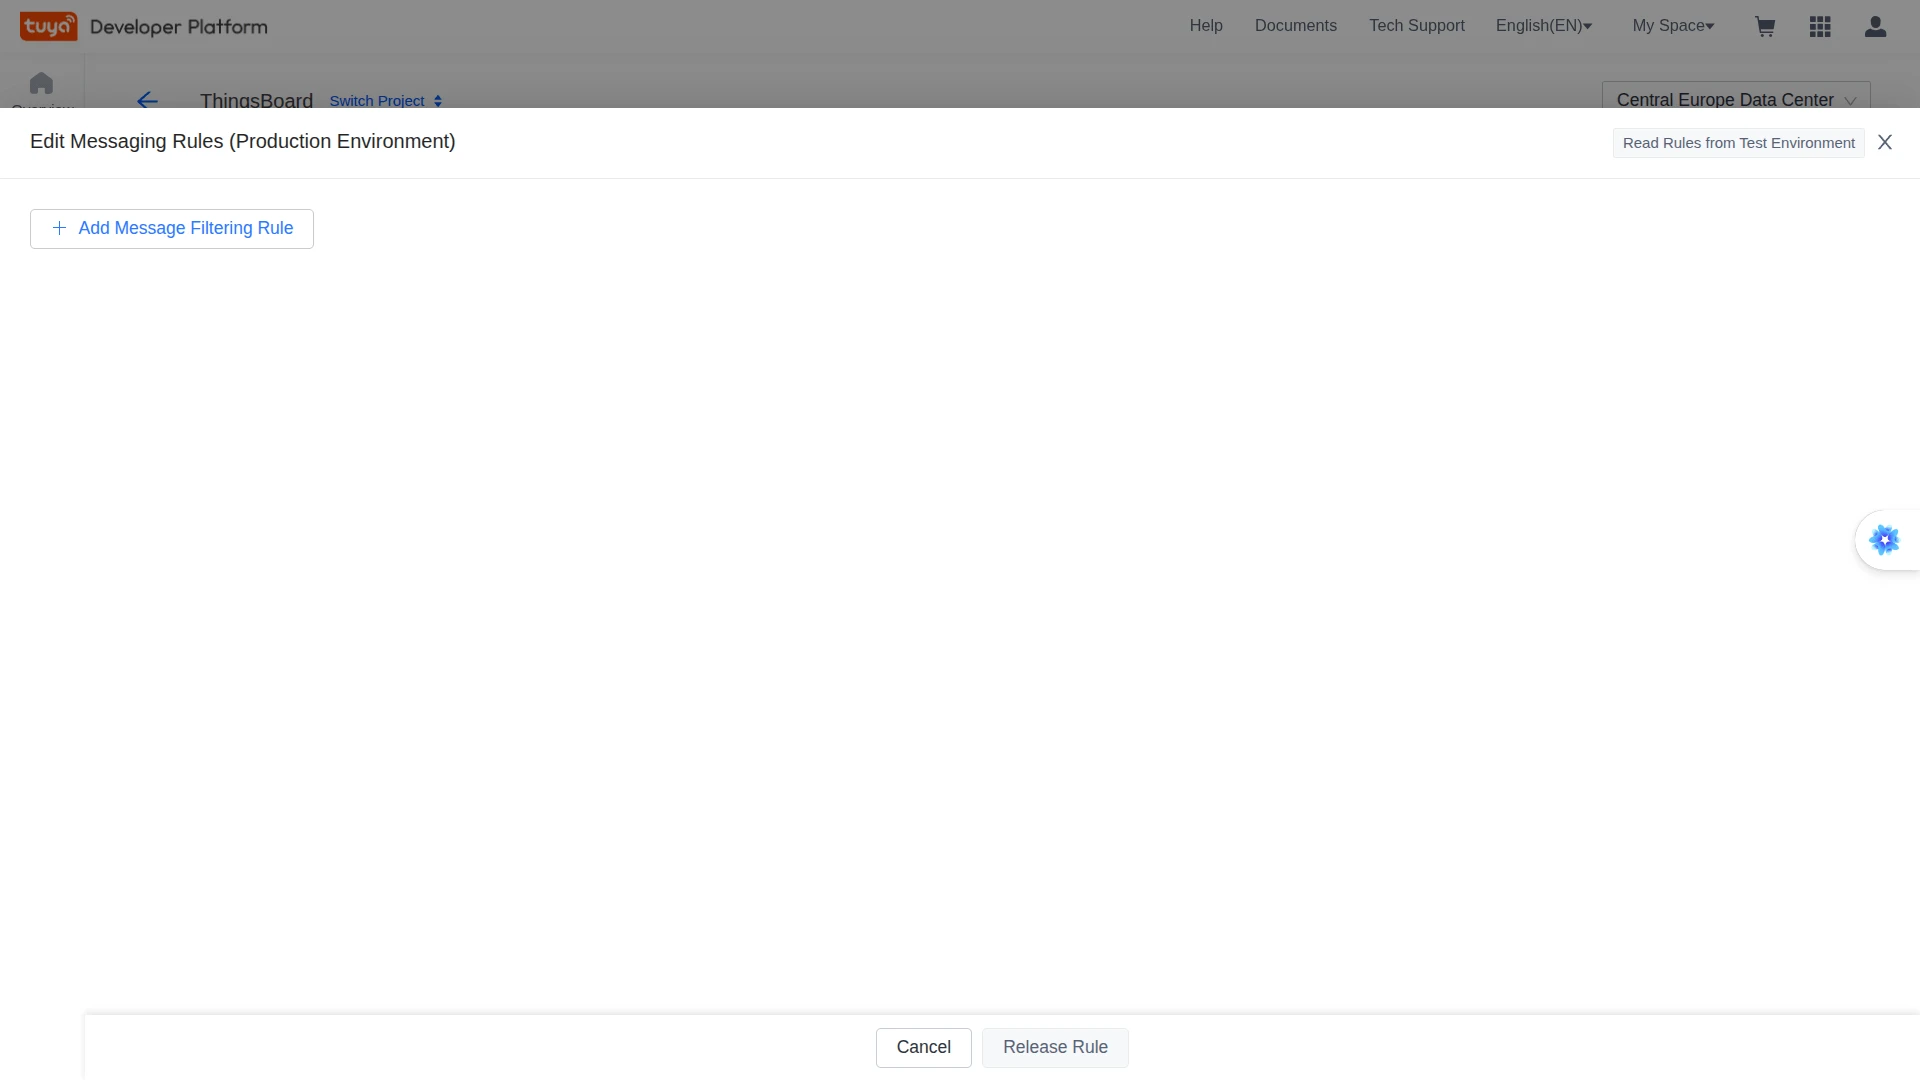
- If the tab shows “No messaging rules apply to the production environment, no messages will be pushed”, click Create Messaging Rules, then Add Message Filtering Rule. If a rule already exists, click Modify Messaging Rules.
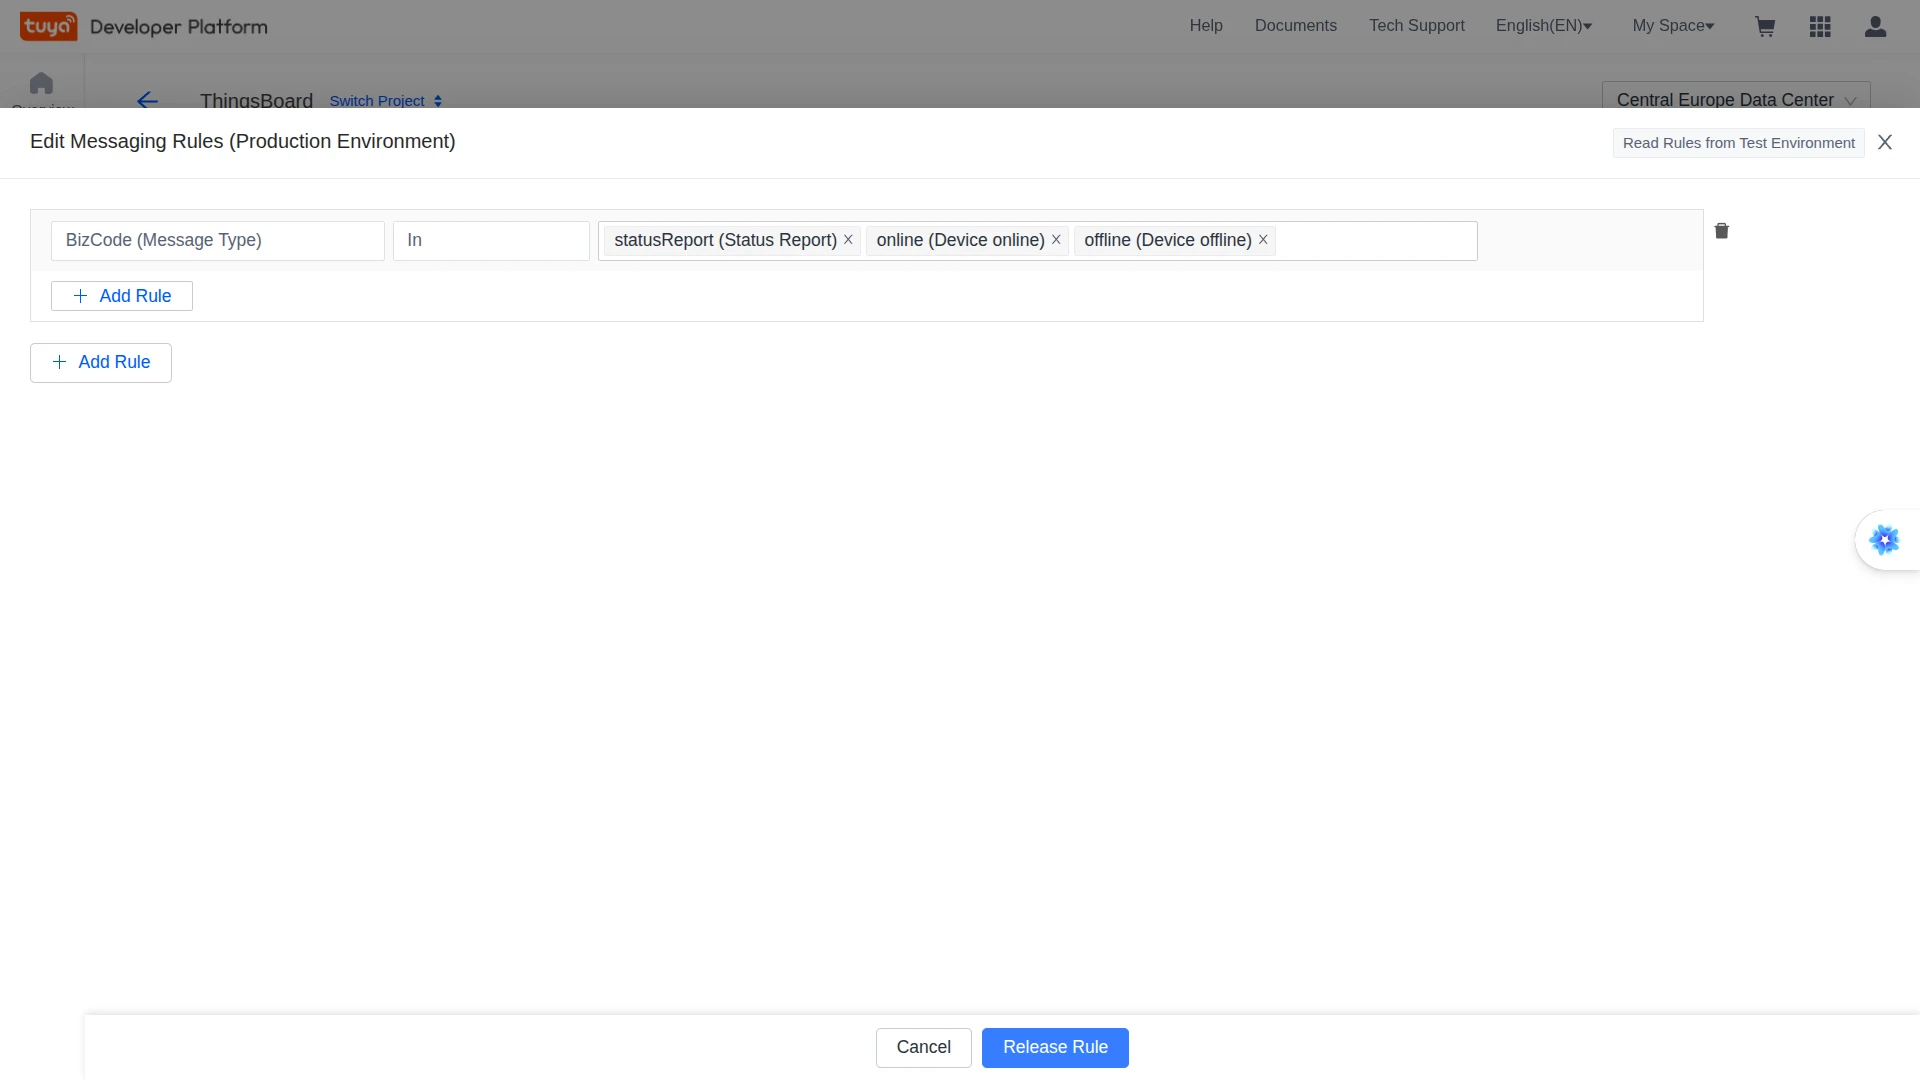
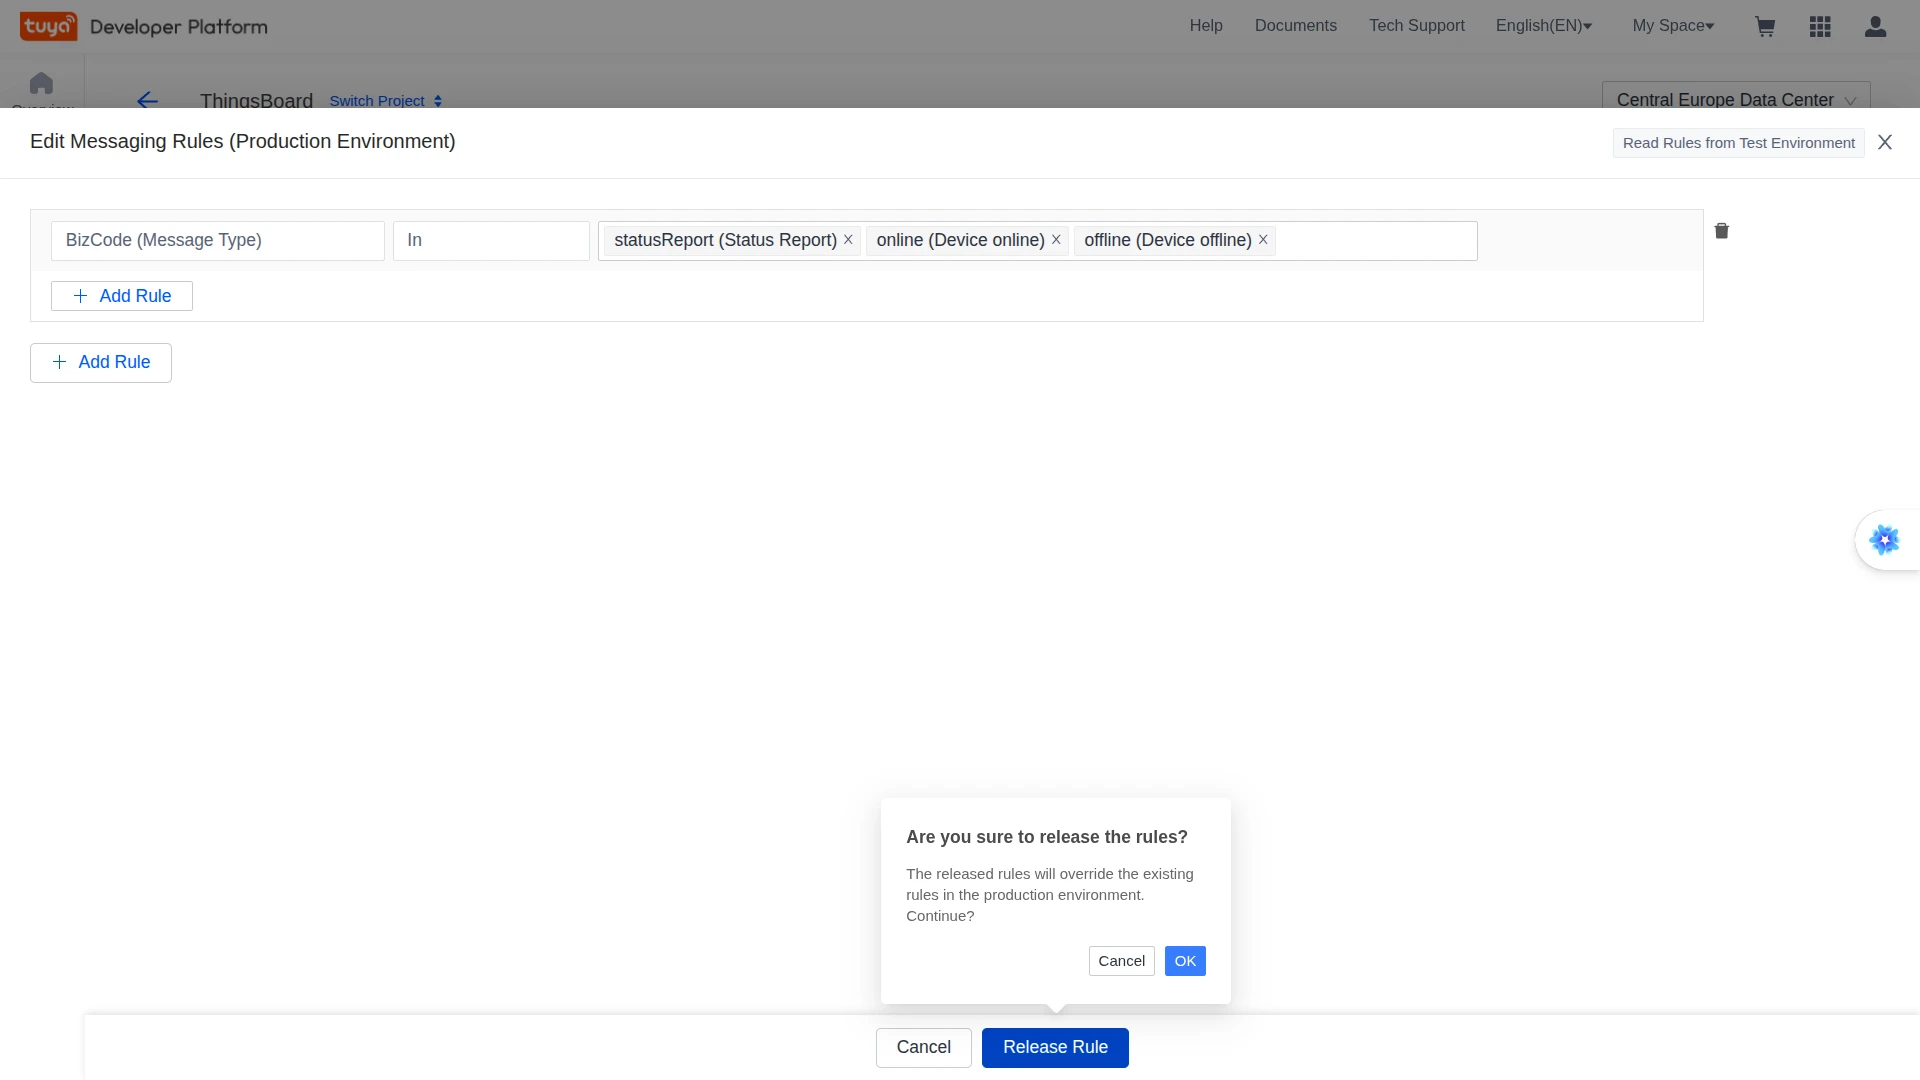
- Set the rule to BizCode (Message Type) In
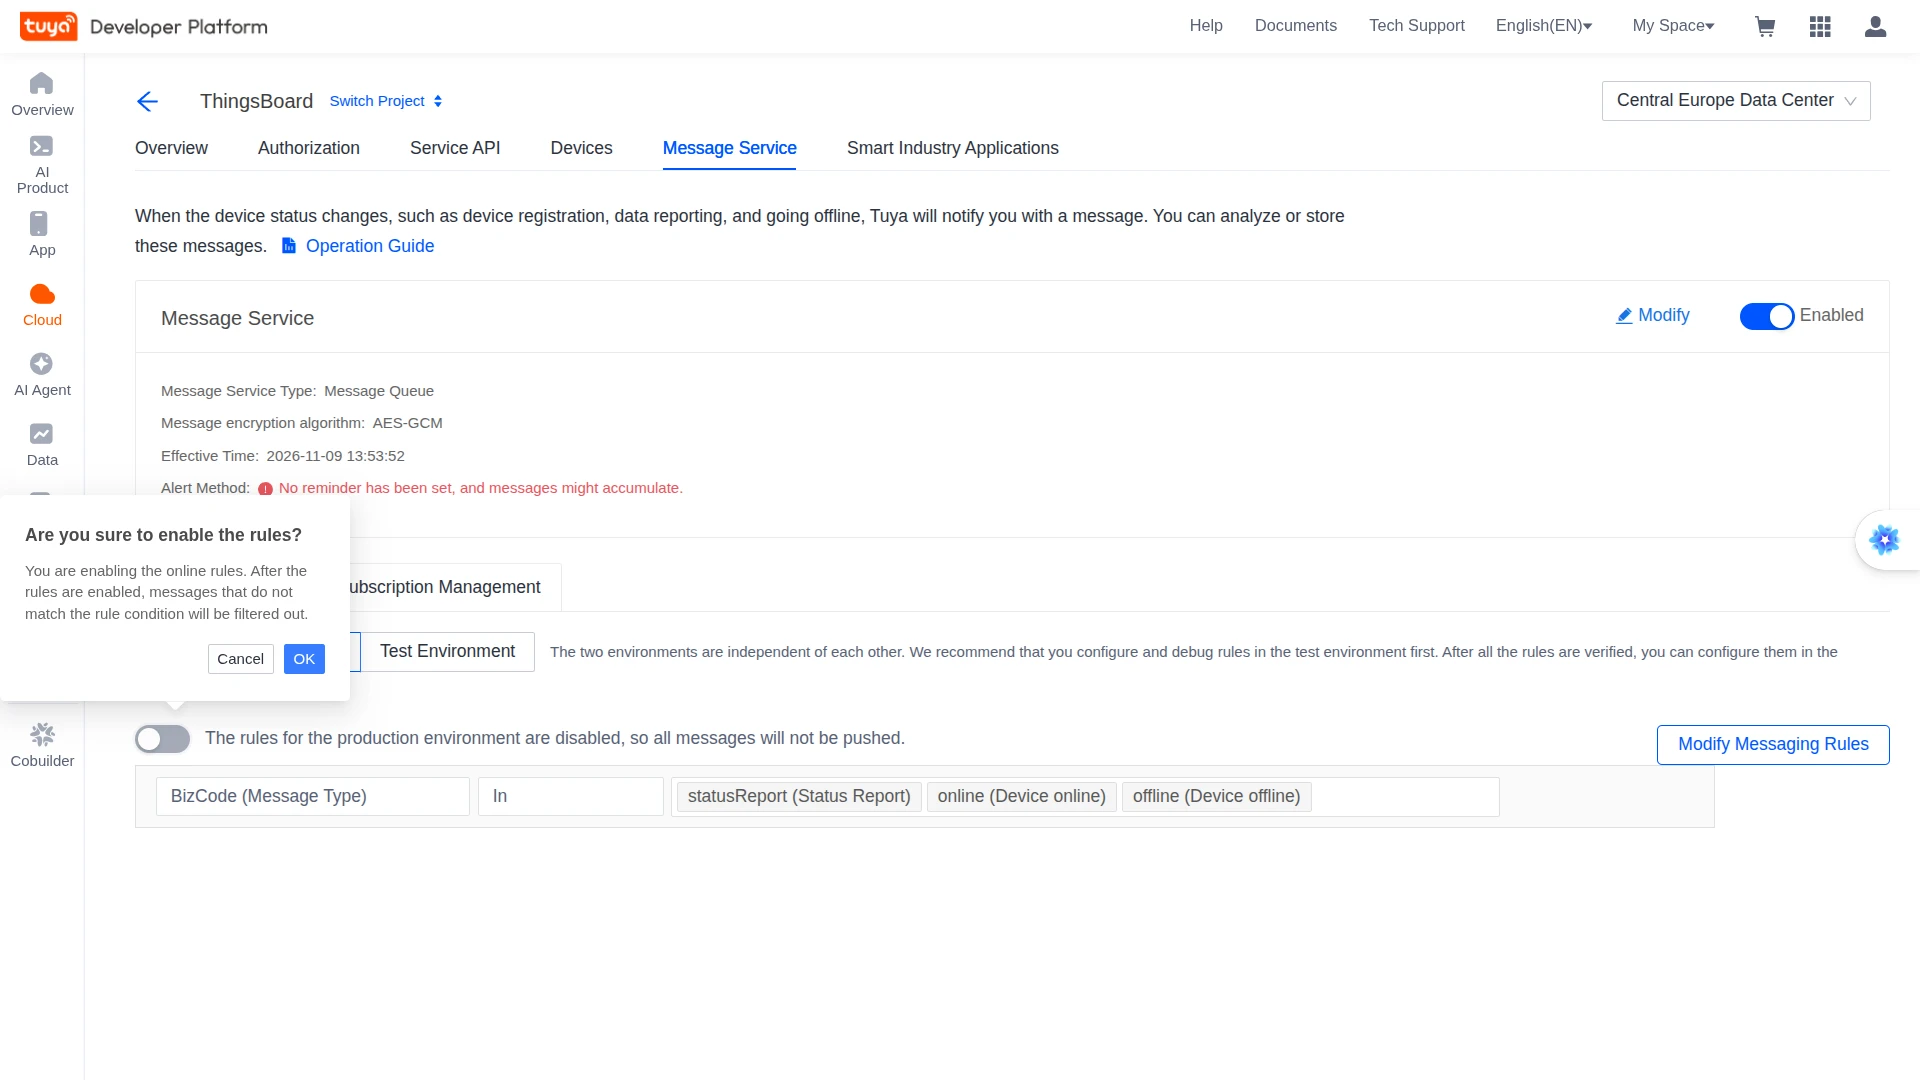
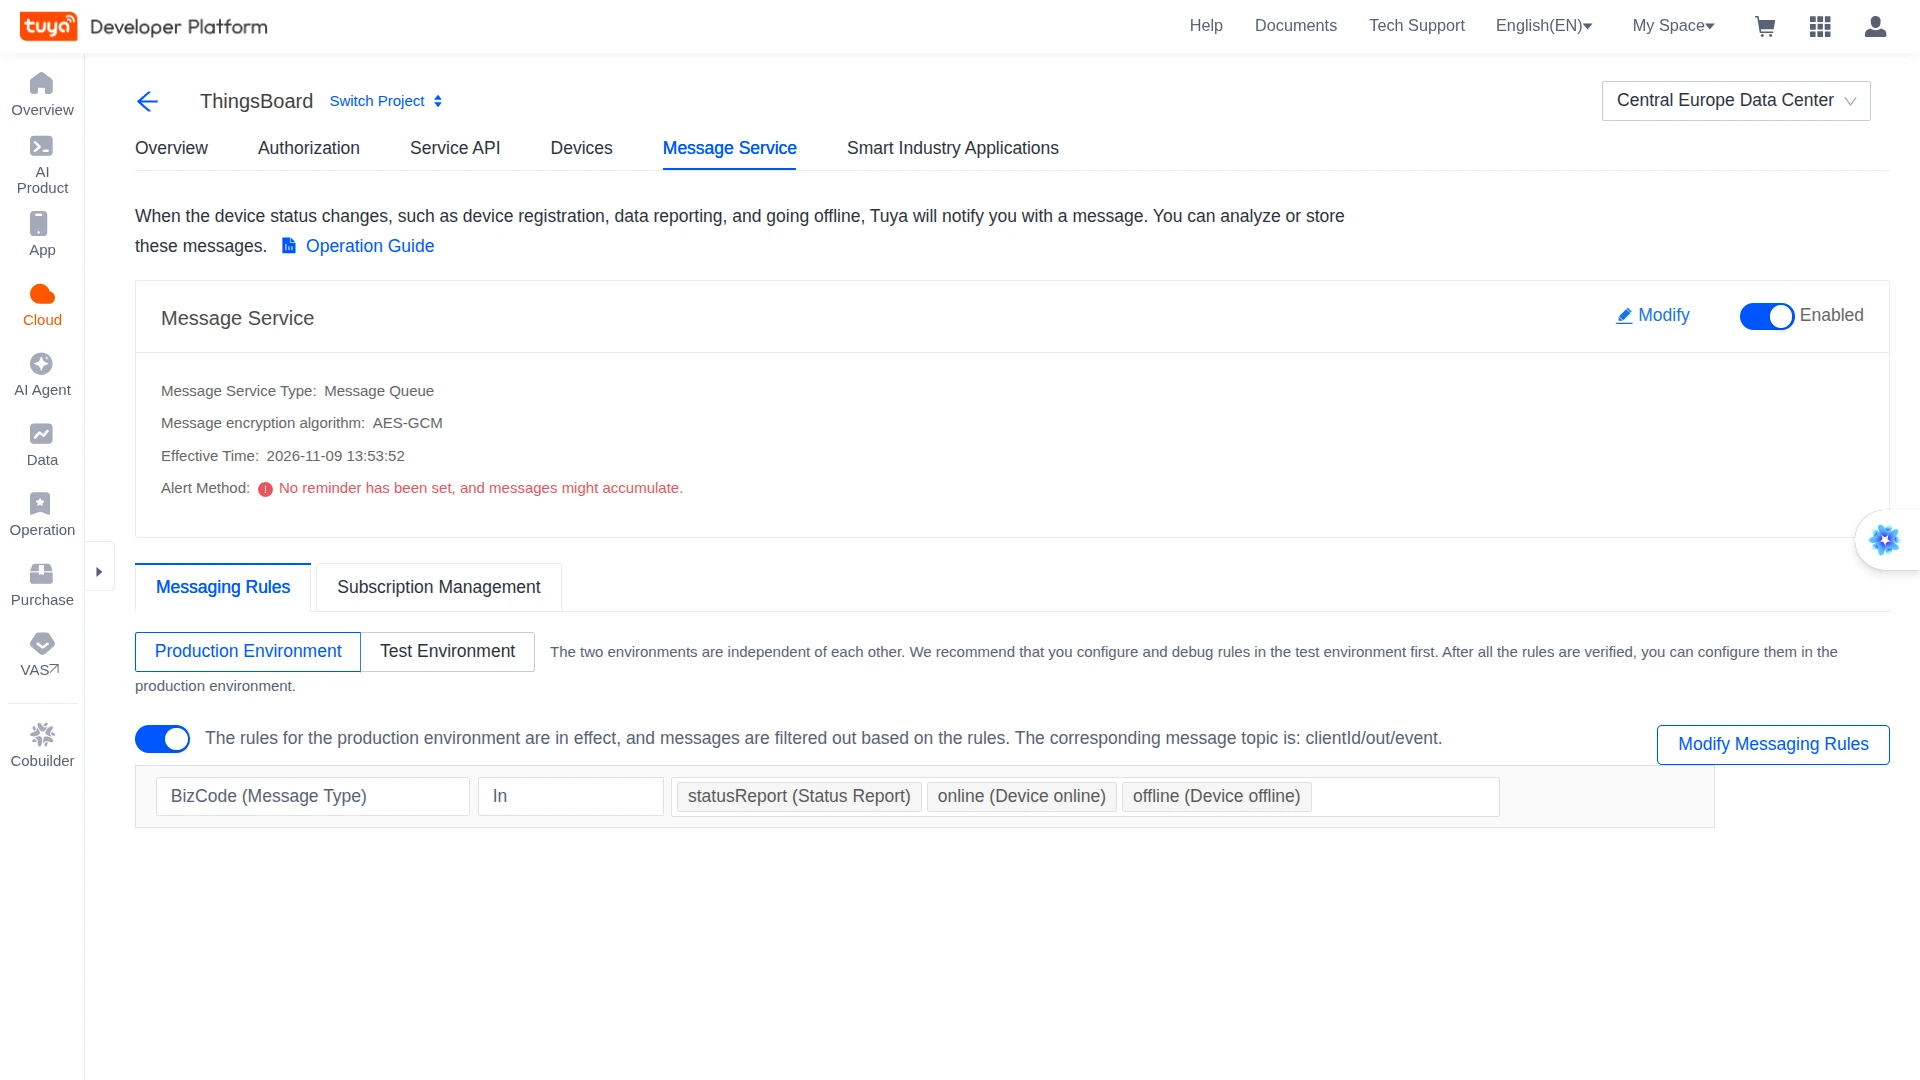
statusReport(Status Report). Optionally addonlineandoffline: the decoder in this guide stores them as theonlineattribute. Click Release Rule, then OK. - Turn on the rule and confirm with OK. The tab then shows “The rules for the production environment are in effect … The corresponding message topic is: clientId/out/event”. While the rule is off, it shows “The rules for the production environment are disabled, so all messages will not be pushed”.
- Open Subscription Management, select the same environment, and check that the subscription
<Access ID>-subhas Status = Good. Consumers shows1once the integration is connected.
Link Your Tuya App Account
Section titled “Link Your Tuya App Account”Linking the app account adds its devices to the cloud project.
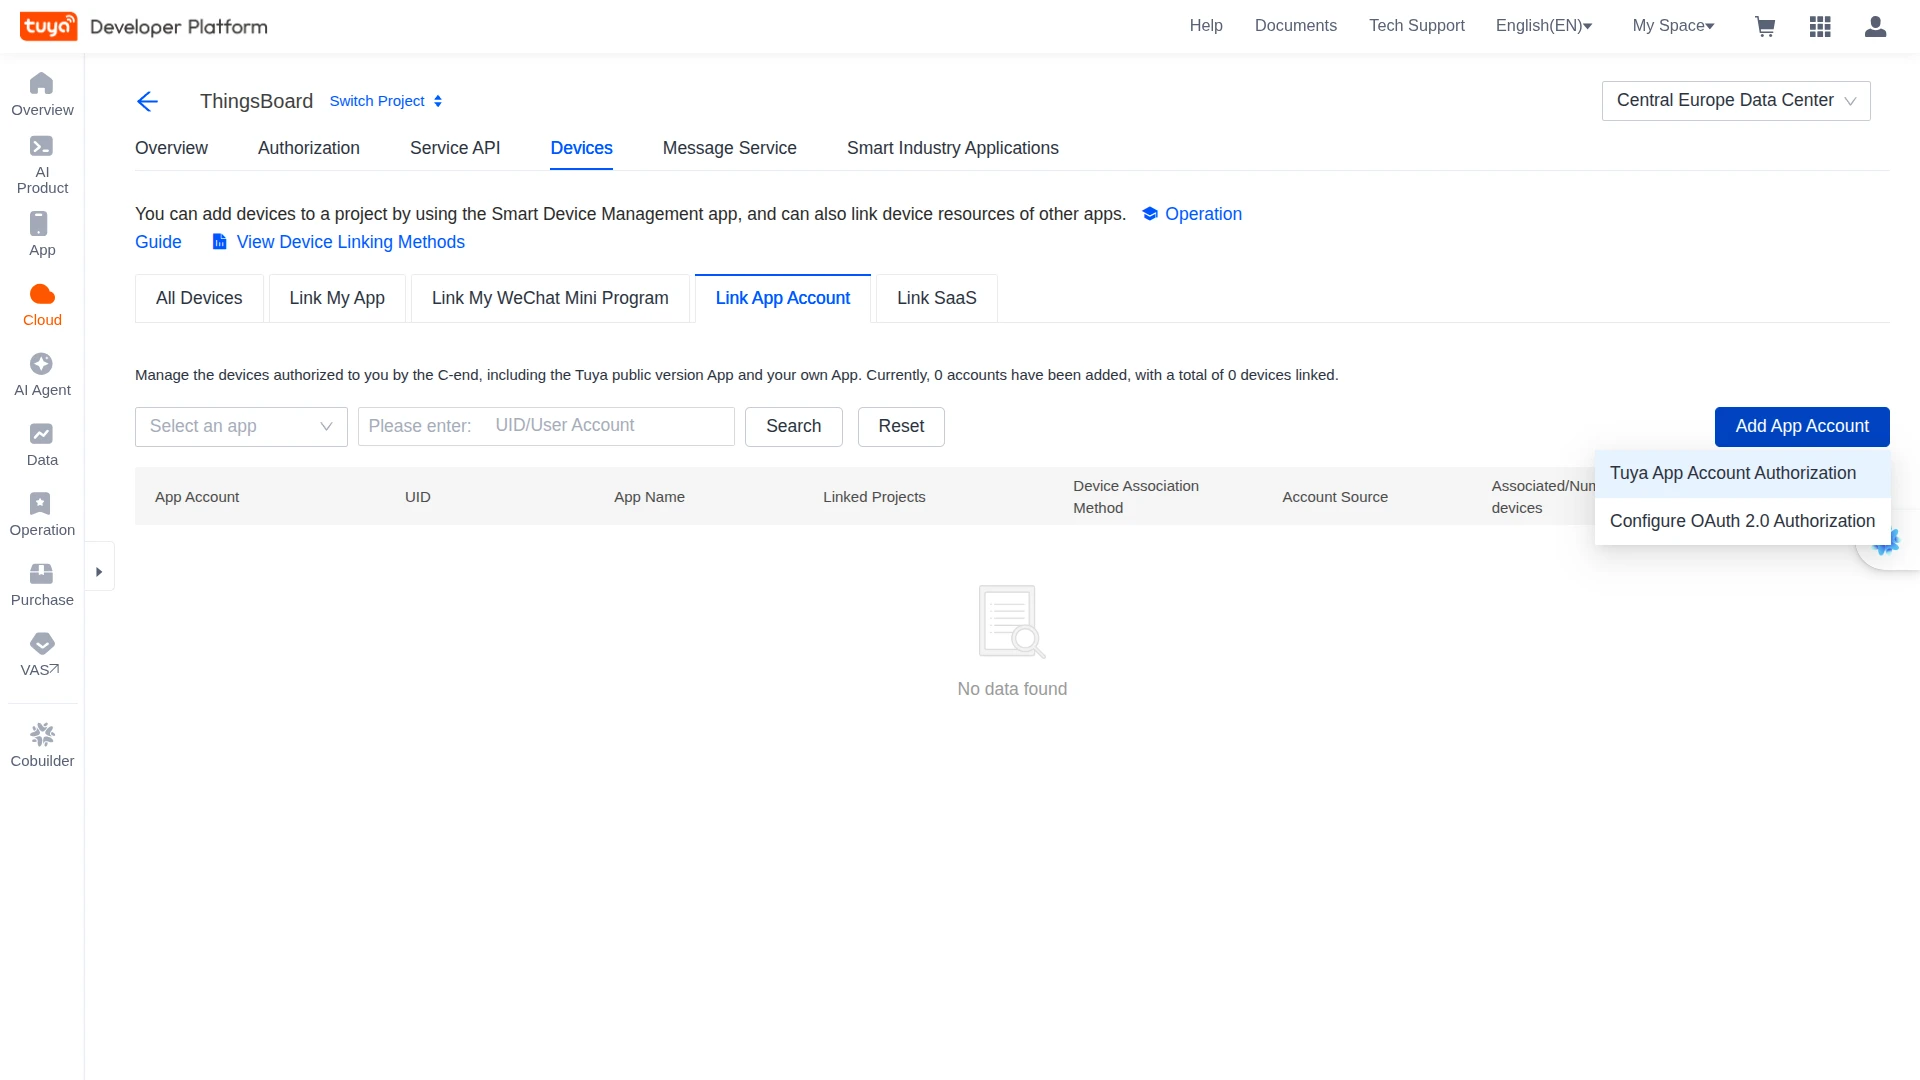
- Go to Devices ⇾ Link App Account, click Add App Account, and select Tuya App Account Authorization.
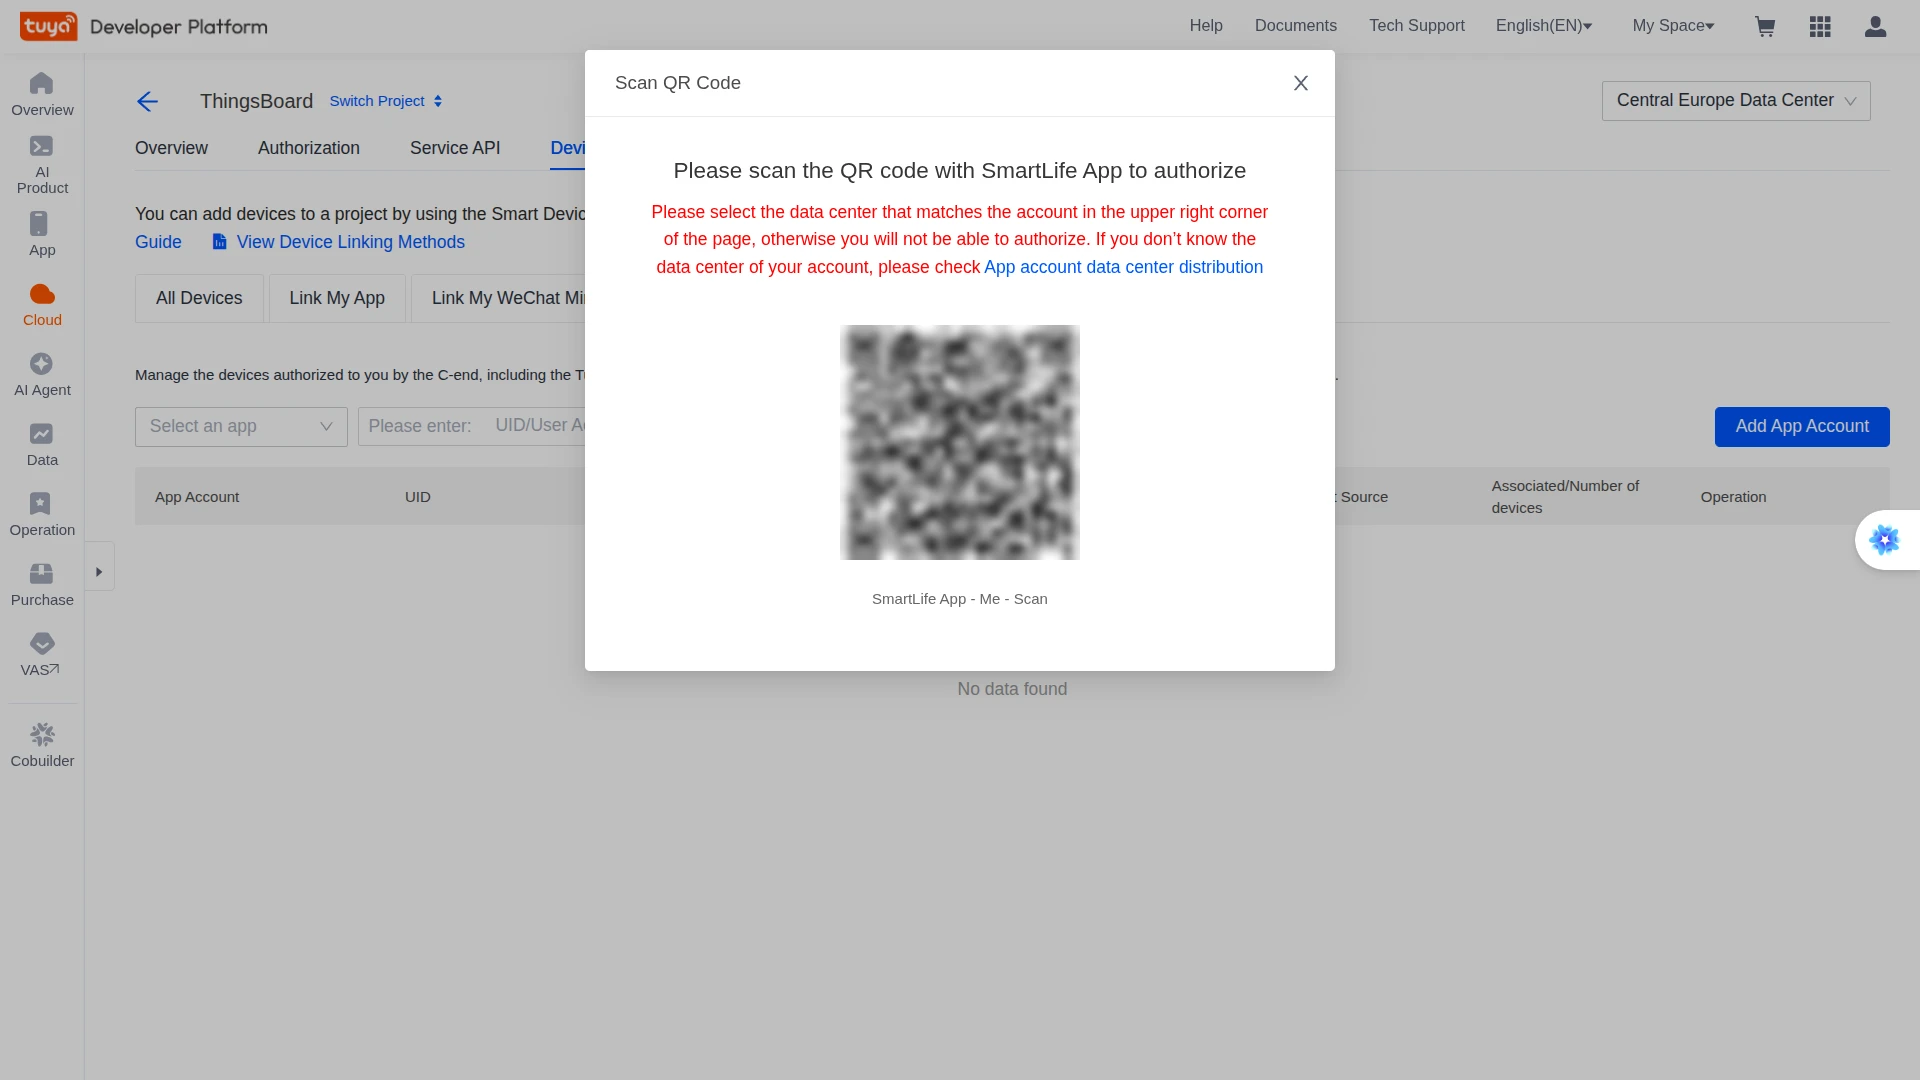
- Scan the QR code in the Smart Life (or Tuya Smart) app: Me ⇾ Scan.
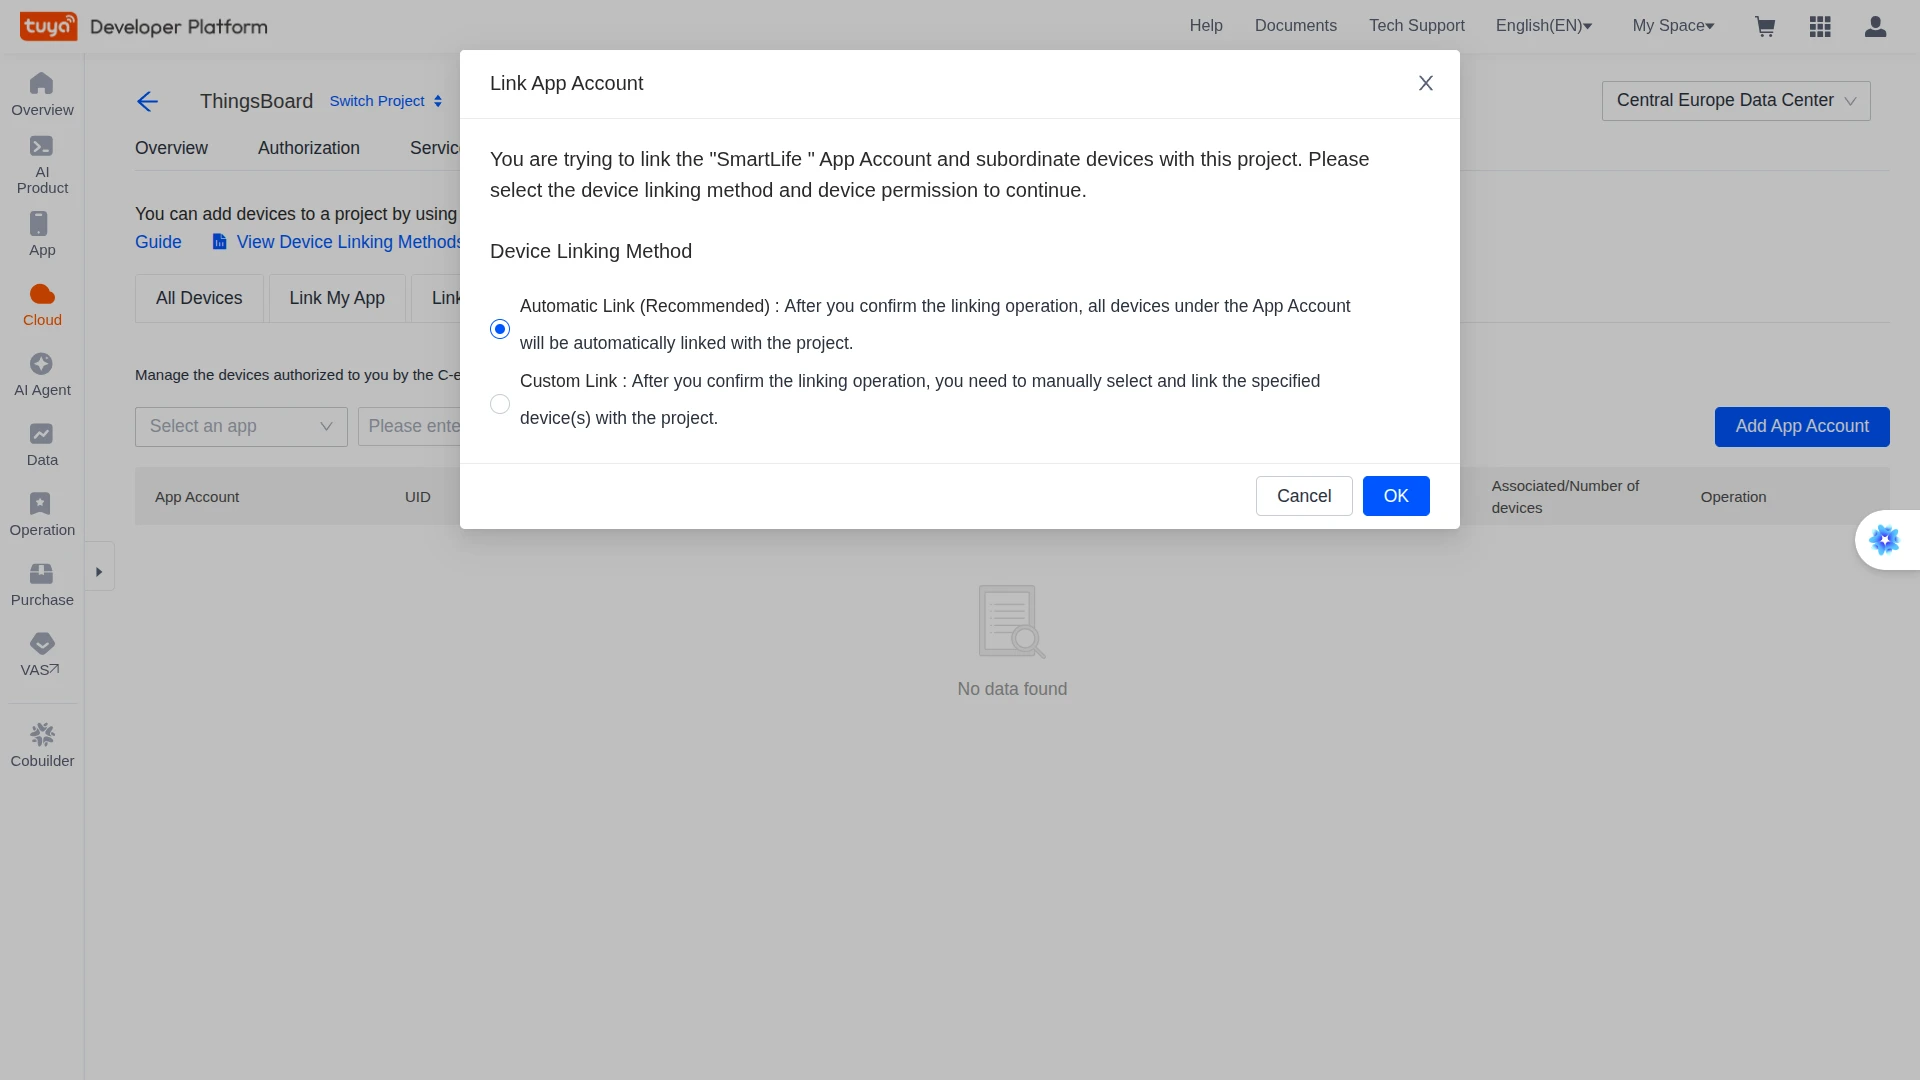
- In the Link App Account dialog, select Automatic Link and click OK.
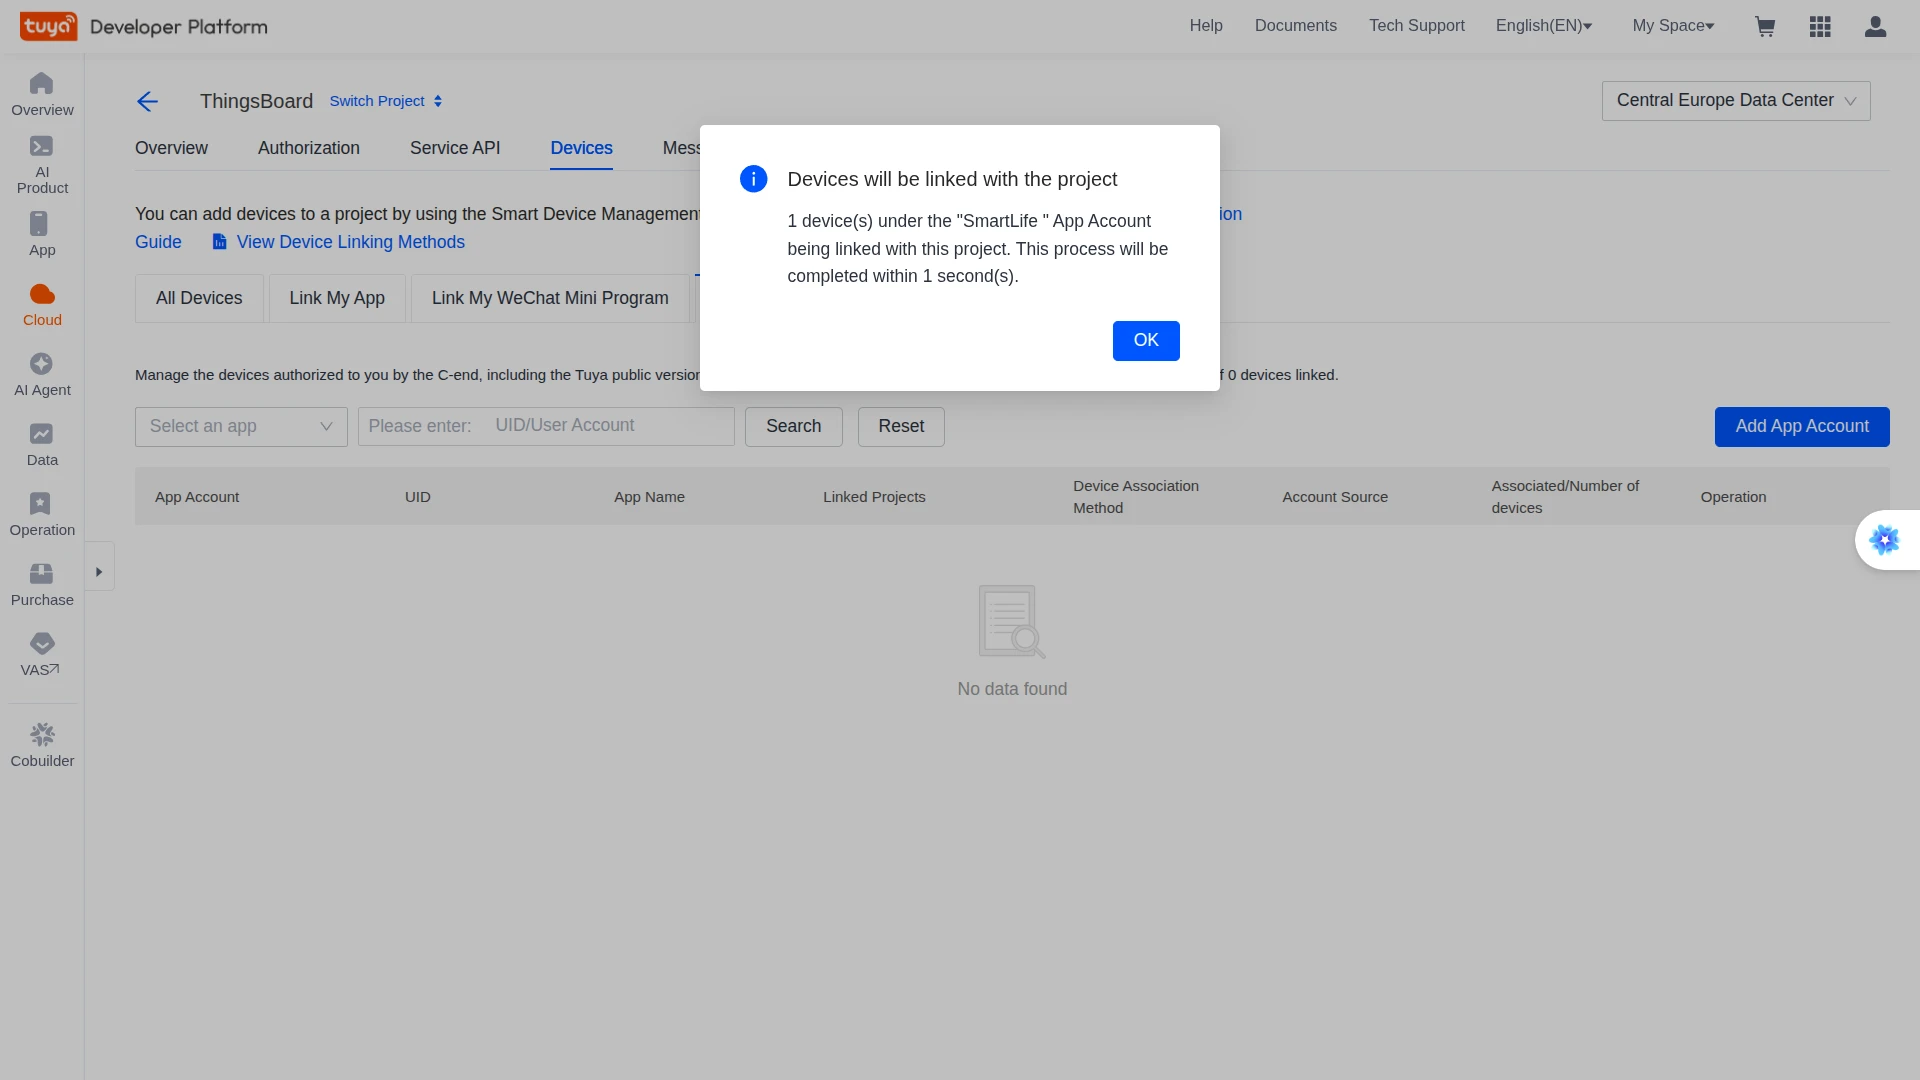
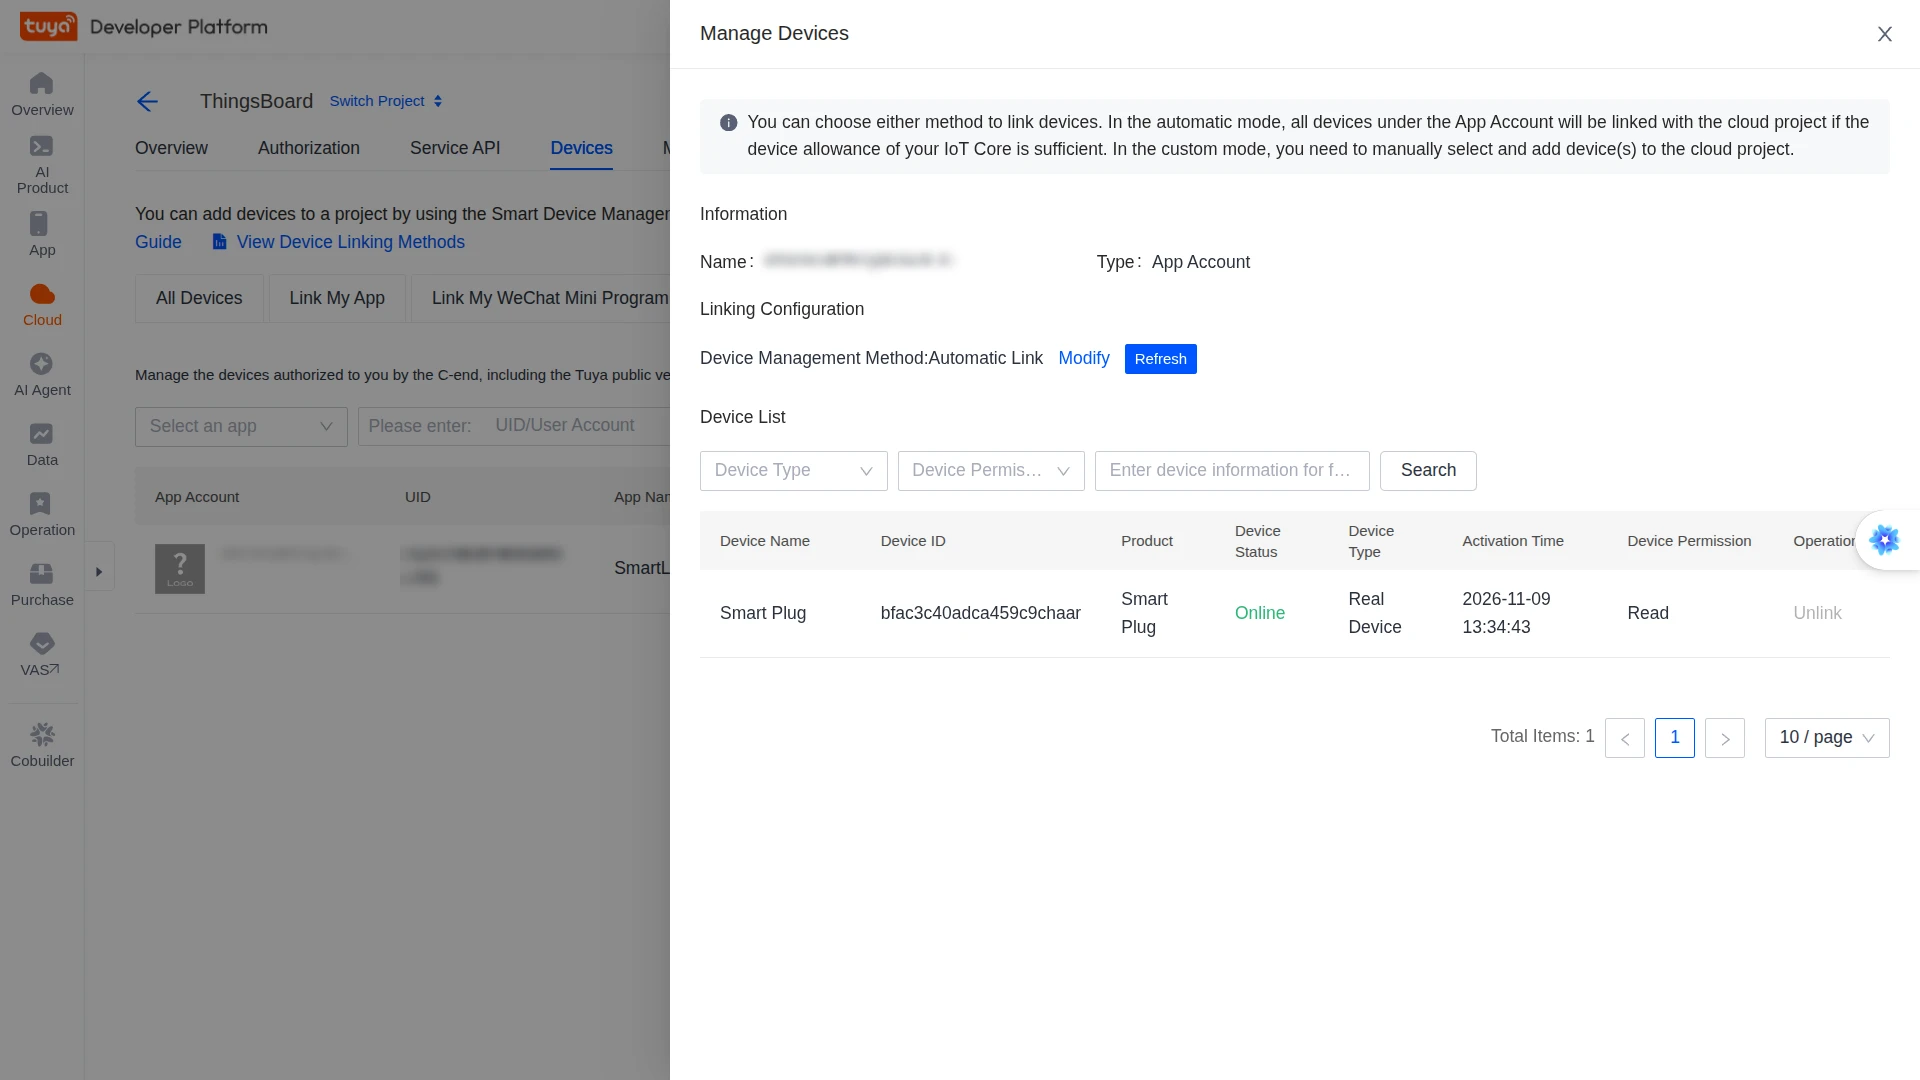
- Confirm the linking. Click Manage Devices on the app account row and check that the smart plug appears as Online.
Set Up Tuya Integration
Section titled “Set Up Tuya Integration”Create the uplink converter, assign it to a new Tuya integration, and trigger a status report from the device.
Create the Uplink Data Converter
Section titled “Create the Uplink Data Converter”The uplink converter receives each status report as JSON, resolves the device by its Tuya ID, and returns its telemetry. Tuya Integration uses the Generic converter: you write the decoder in TBEL or JavaScript. For converter types and the full decoder reference, see Uplink data converter.
-
Go to Integrations ⇾ Data converters and click + Add data converter ⇾ Create new converter.
-
Converter type — keep Uplink.
-
Integration type — select Tuya.
-
Name — enter a name, for example
Tuya Uplink Converter. -
Main decoding configuration — the editor opens with the default Tuya decoder, which is the decoder below. Keep it, or write your own. It reads the
code–valuepairs from thestatusarray and scales the smart plug readings:cur_voltage(V) andcur_power(W) ÷ 10,cur_current(reported in mA) ÷ 1000 to get A. Each value keeps the device timetof its report. It storesonlineandofflinemessages as theonlineattribute and skips other messages, so they do not create or update a device. If the message has no Tuya device ID, it stops with the errorTuya message has no devId. The editor opens in TBEL; use the TBEL / JS toggle to switch to JavaScript./** Decoder **/// Tuya Message Service pushes each device report as JSON.// This example handles status reports (statusReport) and online/offline messages// of a Tuya smart plug. Other messages are skipped.// Parse the incoming payload (byte array) into a JSON object.var data = decodeToJson(payload);// Use the Tuya device ID as the device name.// Keep it unchanged: the downlink sends commands to the Tuya device with this ID.var deviceName = data.devId;if (deviceName == null || deviceName.trim().isEmpty()) {raiseError("Tuya message has no devId");}// Fixed device type, used as the device profile name.var deviceType = "Tuya device";if (data.status != null) {// Status report: each status entry is a data point with code, value and time t (ms).var telemetry = [];for (var i = 0; i < data.status.length; i++) {var code = data.status[i].code;var value = data.status[i].value;// The smart plug reports integers: voltage (V) and power (W) multiplied by 10,// current in mA. Convert them to V, W and A.if (code == "cur_voltage" || code == "cur_power") {value = value / 10;} else if (code == "cur_current") {value = value / 1000;}var values = {};values[code] = value;// Store the value with the device time, or with the server time if t is missing.if (data.status[i].t != null) {telemetry.push({ts: data.status[i].t, values: values});} else {telemetry.push(values);}}return {deviceName: deviceName,deviceType: deviceType,attributes: {},telemetry: telemetry};}if (data.bizCode == "online" || data.bizCode == "offline") {// Online/offline message: store the connection state as an attribute.var noTelemetry = [];return {deviceName: deviceName,deviceType: deviceType,attributes: {online: data.bizCode == "online"},telemetry: noTelemetry};}// Skip other messages, for example nameUpdate or delete: an empty result creates or updates no device.return [];/** Helper functions 'decodeToString' and 'decodeToJson' are already built-in **//** Decoder **/// Tuya Message Service pushes each device report as JSON.// This example handles status reports (statusReport) and online/offline messages// of a Tuya smart plug. Other messages are skipped.// Parse the incoming payload (byte array) into a JSON object.var data = decodeToJson(payload);// Use the Tuya device ID as the device name.// Keep it unchanged: the downlink sends commands to the Tuya device with this ID.var deviceName = data.devId;if (typeof deviceName !== "string" || !deviceName.trim()) {throw new Error("Tuya message has no devId");}// Fixed device type, used as the device profile name.var deviceType = "Tuya device";if (data.status != null) {// Status report: each status entry is a data point with code, value and time t (ms).var telemetry = [];for (var i = 0; i < data.status.length; i++) {var code = data.status[i].code;var value = data.status[i].value;// The smart plug reports integers: voltage (V) and power (W) multiplied by 10,// current in mA. Convert them to V, W and A.if (code === "cur_voltage" || code === "cur_power") {value = value / 10;} else if (code === "cur_current") {value = value / 1000;}var values = {};values[code] = value;// Store the value with the device time, or with the server time if t is missing.if (data.status[i].t != null) {telemetry.push({ts: data.status[i].t, values: values});} else {telemetry.push(values);}}return {deviceName: deviceName,deviceType: deviceType,attributes: {},telemetry: telemetry};}if (data.bizCode === "online" || data.bizCode === "offline") {// Online/offline message: store the connection state as an attribute.return {deviceName: deviceName,deviceType: deviceType,attributes: {online: data.bizCode === "online"},telemetry: []};}// Skip other messages, for example nameUpdate or delete: an empty result creates or updates no device.return [];/** Helper functions **/function decodeToString(payload) {return String.fromCharCode.apply(String, payload);}function decodeToJson(payload) {var str = decodeToString(payload);var data = JSON.parse(str);return data;}To adapt:
- Other data points — add or change the
codebranches. Codes without a branch are stored as received. - Other scaling — change the divisors. For example, some models report
add_ele(energy, kWh) that needs ÷ 100 or ÷ 1000. - Friendly key names — map codes explicitly, for example
cur_voltagetovoltage. - Server time — to store values with the time ThingsBoard receives them instead of the device time
t, pushvaluesinstead of{ts: data.status[i].t, values: values}. - Device properties — add them to
attributes, for exampleproductKey: data.productKeyin theattributesof the status report result. - Device settings — after it reconnects, the plug reports its full state, including settings such as
child_lock,light_mode,relay_status, andcountdown_1. Store them inattributesinstead oftelemetryif you do not need their history.
- Other data points — add or change the
-
Click Test decoder function and check the result (see Test the Decoder).
-
Click Add.
Decoder Inputs
The decoder signature is function decoder(payload, metadata): object | object[].
| Variable | Type | Content |
|---|---|---|
payload |
byte array | The decrypted status report (JSON). Parse it with decodeToJson(payload). |
metadata |
{[key: string]: string} |
Message Service envelope: topic, t (send time, ms), pv (protocol version), protocol, and sign. Also integrationName and the key–value pairs from the integration’s Metadata field. |
Status report fields:
| Field | Content |
|---|---|
devId |
Tuya device ID, for example bfac3c40adca459c9chaar. |
productKey |
Product key of the device model, for example iq9hwd2bjsdgqiby. |
dataId |
Unique ID of the report. |
status |
Data points. Each entry has code, value, and t (ms). An entry also carries the data point number with the value as a string, for example "1": "false" for switch_1 or "20": "2072" for cur_voltage; the decoder ignores it. |
The integration’s Events tab shows each message as { "metadata": {...}, "data": {...} }. The decoder receives only data as payload. To test the decoder with a message from Events, paste only the data object as the payload.
Test the Decoder
Click Test decoder function below the editor. The default payload of a Tuya converter is this status report, with Payload content type set to JSON. If the payload differs, paste the report. Click Test:
{ "dataId": "000657E477596B12C80347616A03002A", "devId": "bfac3c40adca459c9chaar", "productKey": "iq9hwd2bjsdgqiby", "status": [ { "code": "cur_voltage", "t": 1785490000000, "value": 2086 }, { "code": "cur_power", "t": 1785490000000, "value": 142 }, { "code": "cur_current", "t": 1785490000000, "value": 63 } ]}The Output panel shows:
{ "deviceName": "bfac3c40adca459c9chaar", "deviceType": "Tuya device", "attributes": {}, "telemetry": [ { "ts": 1785490000000, "values": { "cur_voltage": 208.6 } }, { "ts": 1785490000000, "values": { "cur_power": 14.2 } }, { "ts": 1785490000000, "values": { "cur_current": 0.063 } } ]}Check that deviceName equals the devId and that telemetry holds the scaled values with the report time ts. If the output shows an error, fix the decoder and test again. An empty result [] means the decoder skipped the message: it has no status and is not online or offline.
Create the Integration
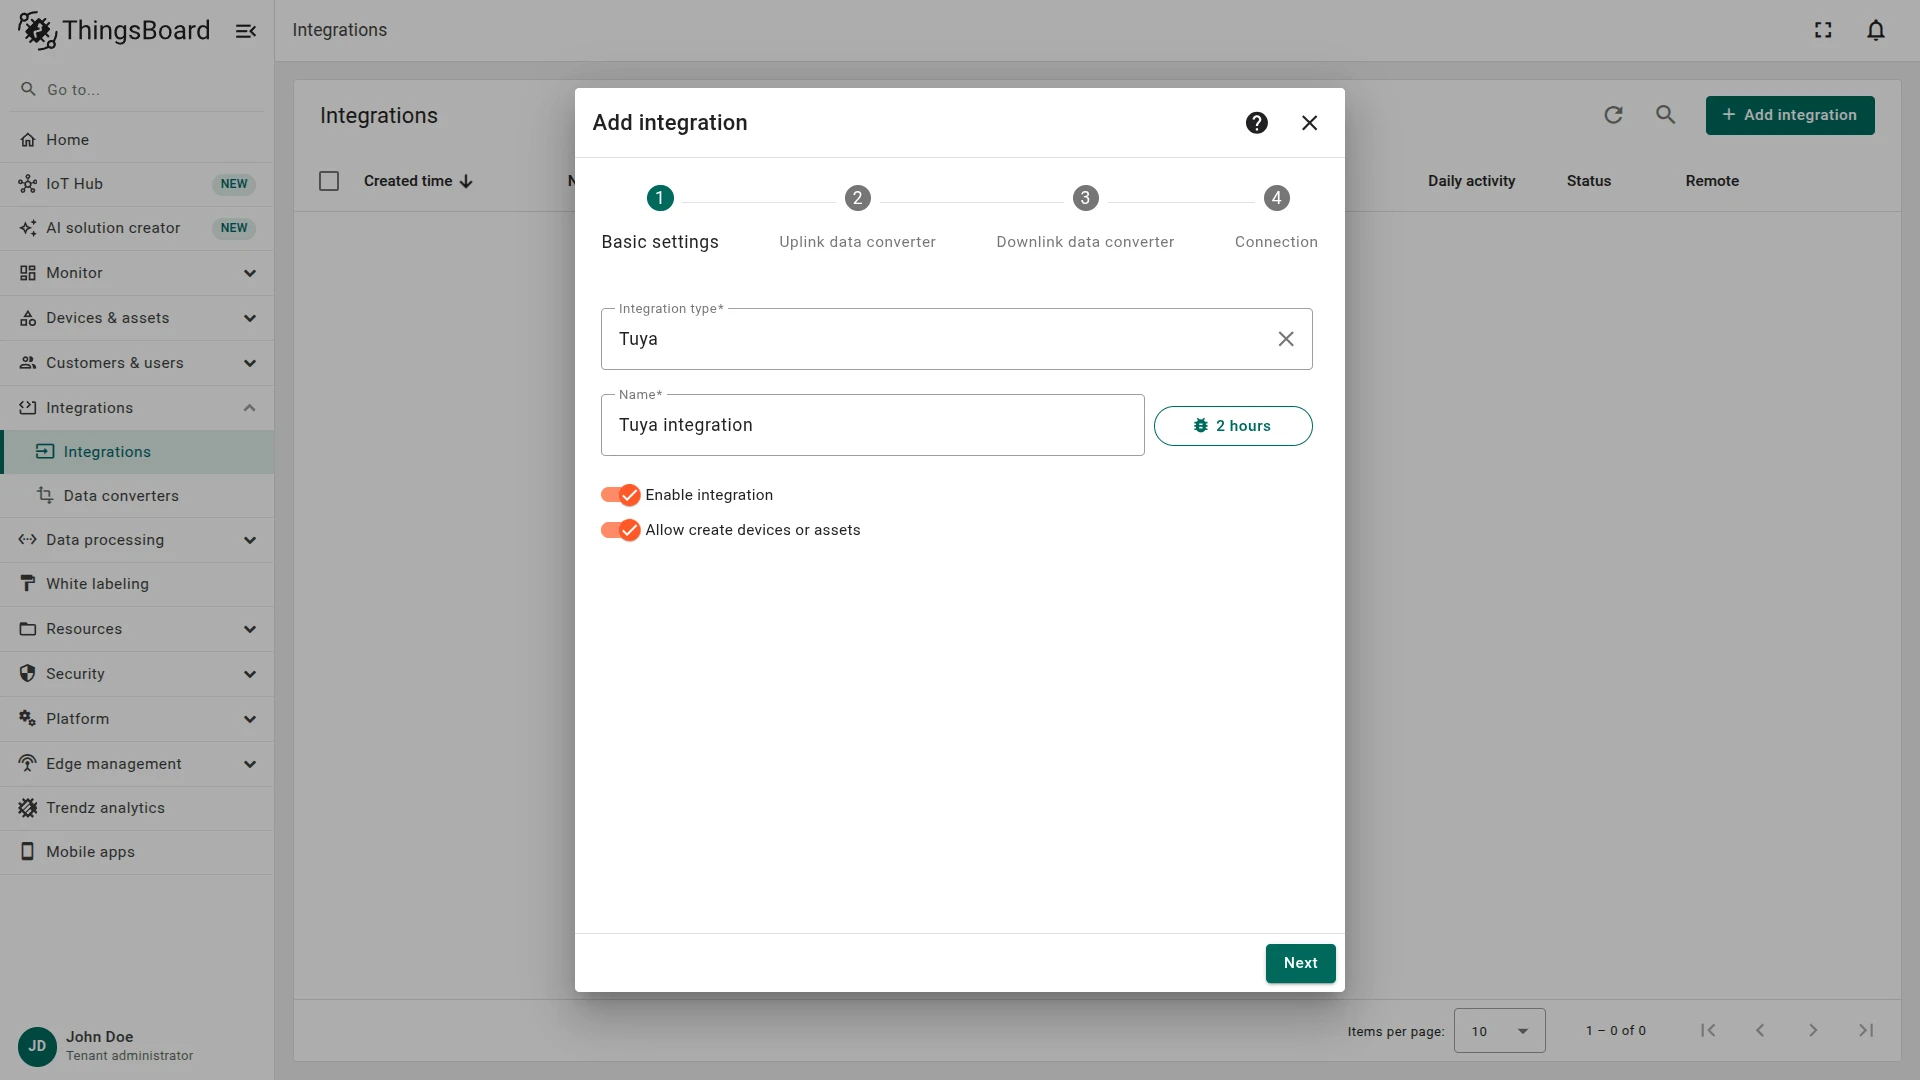
Section titled “Create the Integration”- Go to Integrations ⇾ Integrations and click + Add integration.
- Basic settings:
- Integration type — select Tuya.
- Name — enter a name, for example
Tuya integration. - Enable integration and Allow create devices or assets — keep both on, so the device is created on its first report.
- Click Next.
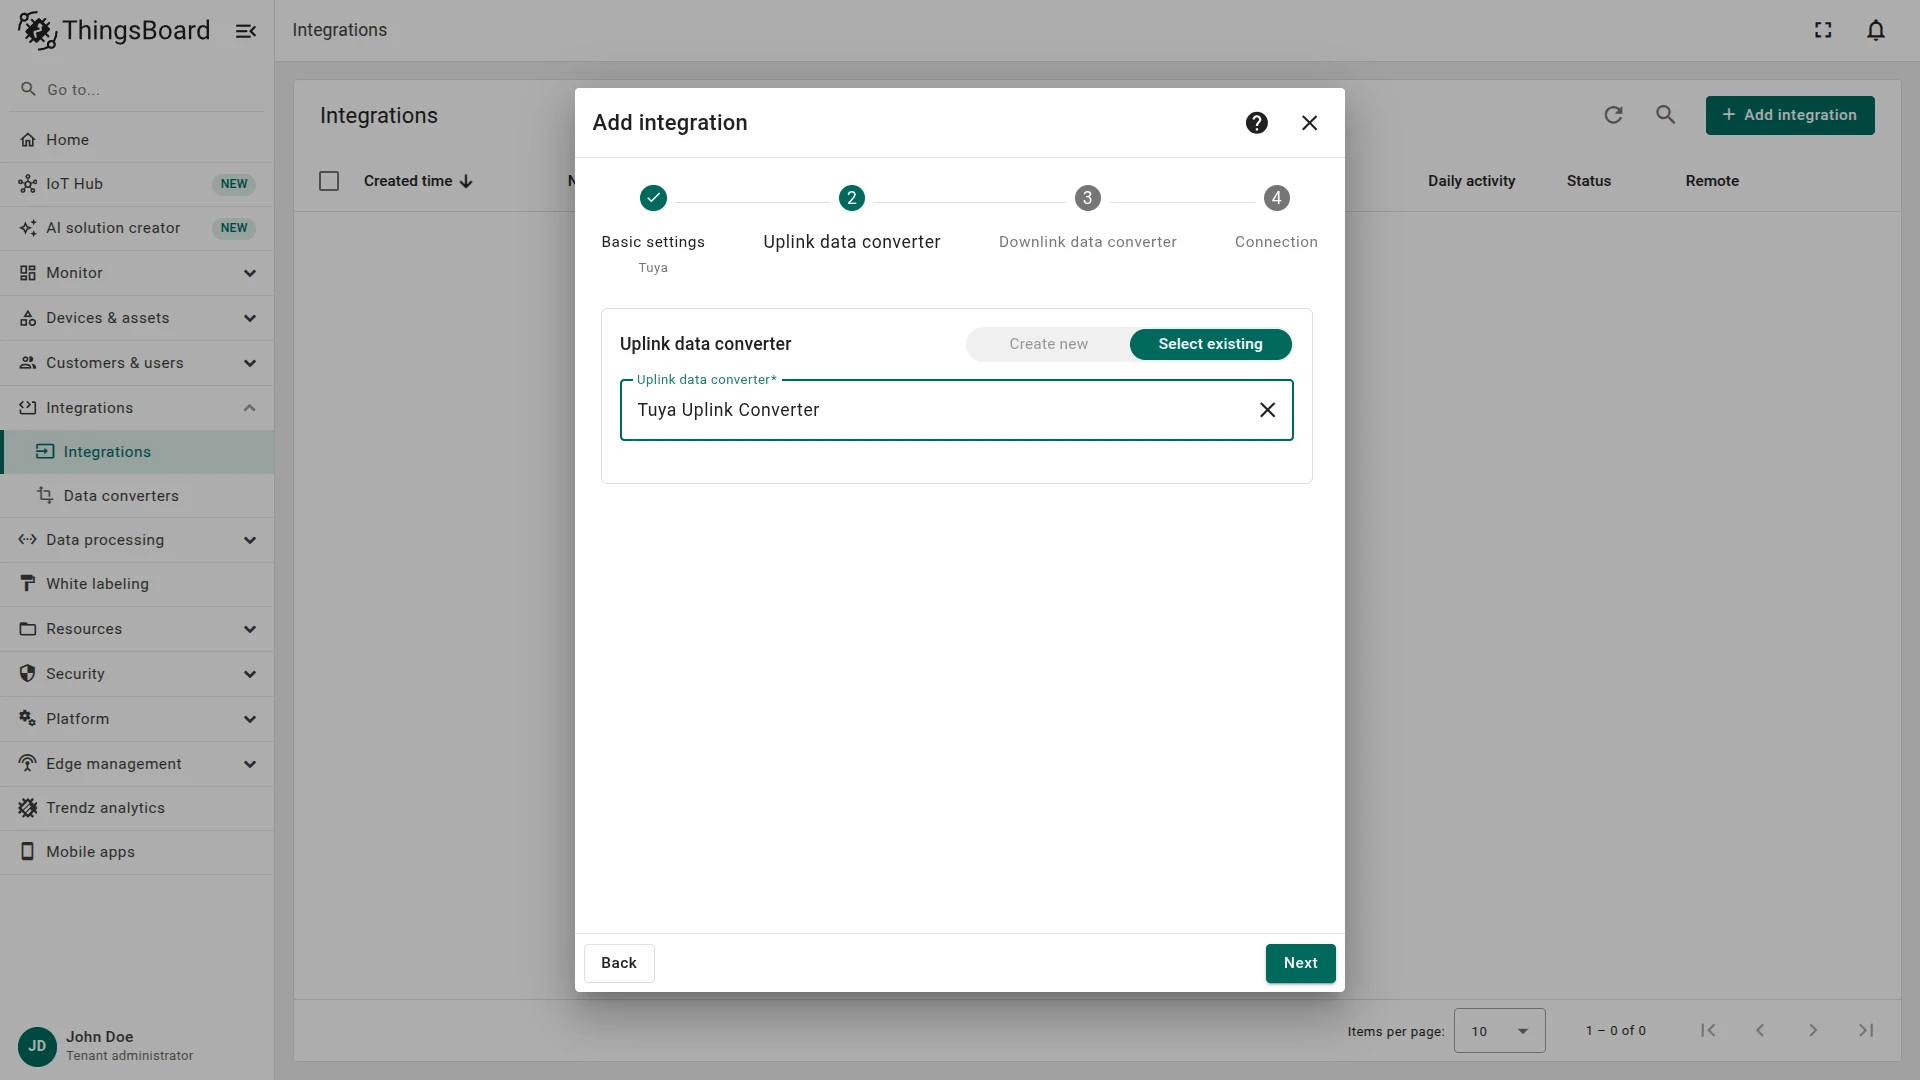
- Uplink data converter:
- Click Select existing and choose
Tuya Uplink Converter. - Alternatively, click Create new to write a decoder here.
- Click Next.
- Click Select existing and choose
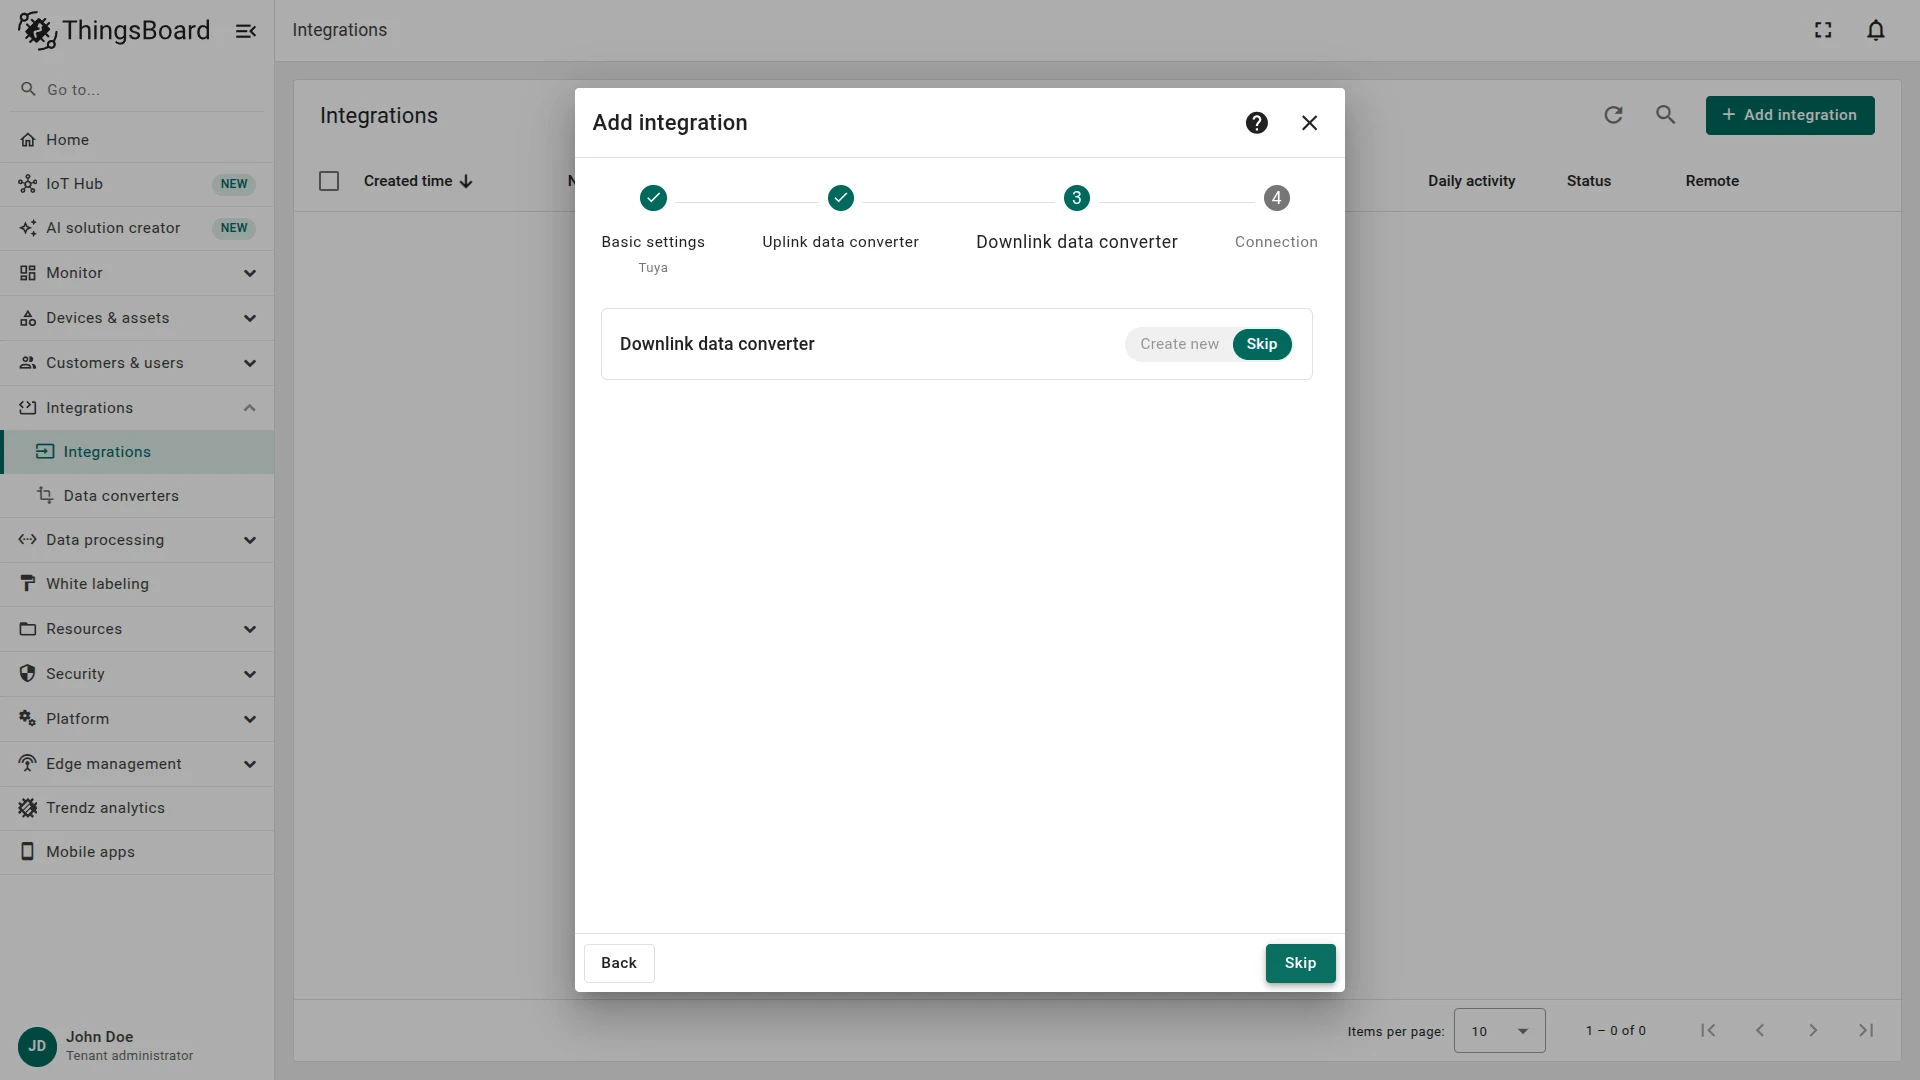
- Downlink data converter:
- Click Skip. Add a downlink converter later if you need to send commands to devices.
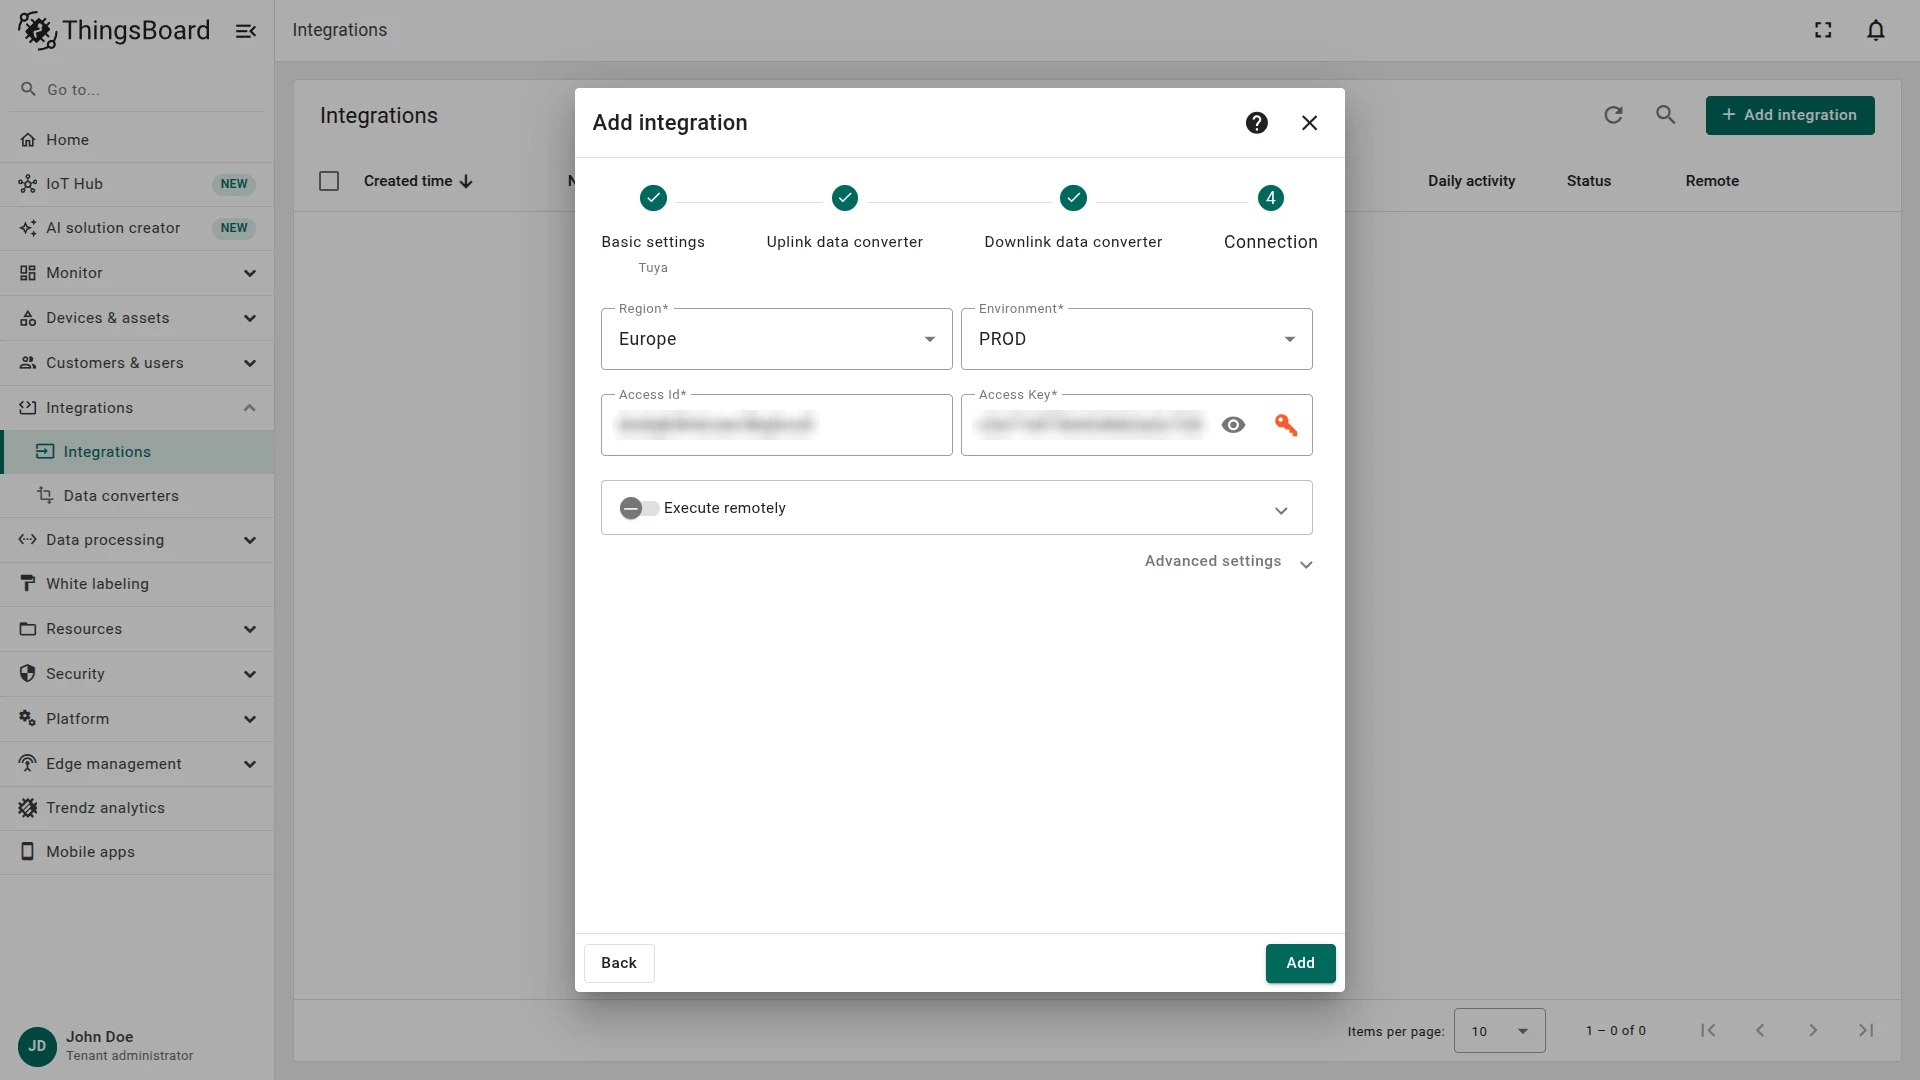
- Connection:
- Region — select the data center of your cloud project.
- Environment — select PROD for a real device or TEST for a test device.
- Access Id and Access Key — paste the Access ID/Client ID and Access Secret/Client Secret from the cloud project.
- See Connection Settings for details.
- Click Add.
Connection Settings
Section titled “Connection Settings”| Parameter | Description |
|---|---|
| Region | Data center of the cloud project: China (default), United States (Western America), Europe (Central Europe), or India. Selects the Message Service and OpenAPI endpoints, for example mqe.tuyaeu.com and openapi.tuyaeu.com for Europe. |
| Environment | PROD (default) or TEST. PROD reads the production topic <Access Id>/out/event; TEST reads <Access Id>/out/event-test. Must match the environment of the messaging rule. |
| Access Id | Access ID/Client ID of the cloud project. The integration subscribes as <Access Id>-sub. |
| Access Key | Access Secret/Client Secret of the cloud project. Signs OpenAPI requests and decrypts messages. Keep it secret. |
| Execute remotely | Runs the integration as a separate process outside the ThingsBoard cluster. ThingsBoard generates an Integration key and Integration secret for it. See Remote Integration. |
| Description | In Advanced settings. Free-text description. |
| Metadata | In Advanced settings. Key–value pairs added to the metadata of every message from this integration. |
If the connection fails, the integration retries about every two minutes and logs a CONNECT event with the error on its Events tab for each attempt.
Test Uplink
Section titled “Test Uplink”Trigger a status report, then confirm that ThingsBoard decoded it and created the device.
Send a Test Uplink
Section titled “Send a Test Uplink”Unplug the smart plug and plug it back in, or switch it in the Smart Life app. The device sends a statusReport to Tuya Cloud, which pushes it to the integration.
Verify the Result
Section titled “Verify the Result”- Integration events — go to Integrations ⇾ Integrations, open the integration, and click the Events tab. The uplink appears with status OK. Click
⋅⋅⋅in the Message column to see the metadata and the report. - Converter events — open
Tuya Uplink Converterin Integrations ⇾ Data converters and click the Events tab. In shows the report, Out shows the decoded result, and Metadata shows the Message Service envelope. - Device — go to Devices & assets ⇾ Devices. The integration has created a device named after the Tuya
devId. Open it and check the Latest telemetry tab, for examplecur_power,cur_voltage,cur_current, andswitch_1. The plug reports each data point in a separate message when it changes, so the keys can arrive at different times. After the plug reconnects, it reports its full state, including settings such aschild_lockandrelay_status. If the messaging rule includesonlineandoffline, the Attributes tab (Client attributes) showsonline.
Configure Downlink
Section titled “Configure Downlink”ThingsBoard sends a command to the device when the Rule Engine routes an RPC request to the integration — for example, when a dashboard switch is toggled. The integration calls the Tuya OpenAPI of the selected region:
- It takes the Tuya device ID from
deviceIdin the encoder’s outputmetadata, or fromdeviceNameifdeviceIdis not set. - It sends
datatoPOST /v1.0/iot-03/devices/{deviceId}/commandsas{ "commands": [...] }.
The encoder’s data must be one of:
data |
Sent to Tuya |
|---|---|
An object with code and value, for example {"code": "switch_1", "value": true} |
{"commands": [{"code": "switch_1", "value": true}]} |
| An array of such objects | {"commands": [...]} with every command |
An object with method set to a query name: getStatus, getFunctions, getSpecification, getLogs, getReportLogs, or getCategory |
A GET request to the matching OpenAPI endpoint. The response goes to the uplink converter as payload, with msgType = DownlinkResponse and deviceId in metadata. |
Any other data, including {"commands": [...]}, fails with “Downlink message format is not correct, downlink message should contain one of the following: code field, service RPC method, commands array!”.
The encoder in this guide sends commands only. To send a query, return data with method, for example {"method": "getStatus"}, from your own encoder, and handle the response in the uplink converter: the response has no devId (the device ID is in metadata.deviceId), so the decoder in this guide stops with an error.
The downlink converter turns a Rule Engine message into a Tuya command. For the full encoder reference, see Downlink data converter.
Create and Assign the Downlink Converter
Section titled “Create and Assign the Downlink Converter”The encoder below uses the RPC method as the Tuya command code and the RPC params as its value. ThingsBoard passes RPC params as JSON text, for example true from the Round switch as "true", so the encoder parses the text back into a boolean, number, string, or object. It sets deviceId to the device name, which is the Tuya devId. It stops with an error if the device name is missing, if the message is not an RPC request, or if the RPC has no method or params; see Troubleshooting.
- Open the integration in Integrations ⇾ Integrations and click Toggle edit mode (pencil icon).
- In the Downlink data converter field, click Create new. The Downlink converter type and Tuya integration type are preselected.
- Enter a name, for example
Tuya Downlink Converter. - Main encoding configuration — the editor opens with the default Tuya encoder, which is the encoder below. Keep it, or write your own. The editor opens in TBEL; use the TBEL / JS toggle to switch to JavaScript.
// Encode downlink data from incoming Rule Engine message// msg - JSON message payload downlink message json// msgType - type of message, for ex. 'ATTRIBUTES_UPDATED', 'POST_TELEMETRY_REQUEST', etc.// metadata - list of key-value pairs with additional data about the message// integrationMetadata - list of key-value pairs with additional data defined in Integration executing this converter/** Encoder **/// Send an RPC request to the Tuya device as a Device Control command:// the RPC method becomes the command code, the RPC params become its value.// For example, method "switch_1" with params true turns a smart plug on.// The device name is the Tuya device ID. Reject the message if it is missing or empty.var deviceId = metadata.deviceName != null ? metadata.deviceName.trim() : null;if (deviceId == null || deviceId.isEmpty()) {raiseError("Message metadata has no deviceName");}// Only RPC requests are sent as commands. Reject other messages, for example attribute updates.if (msgType != "RPC_CALL_FROM_SERVER_TO_DEVICE") {raiseError("Message is not an RPC request");}if (msg.method == null || msg.method.trim().isEmpty()) {raiseError("RPC request has no method");}// ThingsBoard passes RPC params as JSON text, for example true as "true", 500 as "500"// and "colour" as "\"colour\"". Parse JSON text into a boolean, number, string or object.// Keep other text, for example colour typed without quotes, as it is.var value = msg.params;if (value instanceof String) {var text = value.trim();if (text == "true" || text == "false" || text == "null"|| text.matches("-?(0|[1-9][0-9]*)(\\.[0-9]+)?([eE][+-]?[0-9]+)?")|| text.startsWith("\"") || text.startsWith("{") || text.startsWith("[")) {value = JSON.parse(text);}}if (value == null) {raiseError("RPC request has no params");}var command = {code: msg.method,value: value};var result = {// The Tuya Device Control API expects a JSON body.contentType: "JSON",// One command: { "code": ..., "value": ... }.data: JSON.stringify(command),// The integration sends the command to the Tuya device with this ID.metadata: {deviceId: deviceId}};return result;// Encode downlink data from incoming Rule Engine message// msg - JSON message payload downlink message json// msgType - type of message, for ex. 'ATTRIBUTES_UPDATED', 'POST_TELEMETRY_REQUEST', etc.// metadata - list of key-value pairs with additional data about the message// integrationMetadata - list of key-value pairs with additional data defined in Integration executing this converter/** Encoder **/// Send an RPC request to the Tuya device as a Device Control command:// the RPC method becomes the command code, the RPC params become its value.// For example, method "switch_1" with params true turns a smart plug on.// The device name is the Tuya device ID. Reject the message if it is missing or empty.var deviceId = typeof metadata.deviceName === "string" ? metadata.deviceName.trim() : "";if (!deviceId) {throw new Error("Message metadata has no deviceName");}// Only RPC requests are sent as commands. Reject other messages, for example attribute updates.if (msgType !== "RPC_CALL_FROM_SERVER_TO_DEVICE") {throw new Error("Message is not an RPC request");}if (typeof msg.method !== "string" || !msg.method.trim()) {throw new Error("RPC request has no method");}// ThingsBoard passes RPC params as JSON text, for example true as "true", 500 as "500"// and "colour" as "\"colour\"". Parse JSON text into a boolean, number, string or object.// Keep other text, for example colour typed without quotes, as it is.var value = msg.params;if (typeof value === "string") {var text = value.trim();if (text === "true" || text === "false" || text === "null"|| /^-?(0|[1-9][0-9]*)(\.[0-9]+)?([eE][+-]?[0-9]+)?$/.test(text)|| text.charAt(0) === "\"" || text.charAt(0) === "{" || text.charAt(0) === "[") {value = JSON.parse(text);}}if (value === undefined || value === null) {throw new Error("RPC request has no params");}var command = {code: msg.method,value: value};var result = {// The Tuya Device Control API expects a JSON body.contentType: "JSON",// One command: { "code": ..., "value": ... }.data: JSON.stringify(command),// The integration sends the command to the Tuya device with this ID.metadata: {deviceId: deviceId}};return result;
- Click Test encoder function. The defaults are the RPC message
{"method":"switch_1","params":"true"}with Message typeRPC_CALL_FROM_SERVER_TO_DEVICE, for the devicebfac3c40adca459c9chaarof typeTuya device. Click Test and check the output:datais{"code":"switch_1","value":true}andmetadata.deviceIdisbfac3c40adca459c9chaar. - To record downlink events, click the debug icon next to the name, select All messages, and click Apply.
- Click Add, then Apply changes.
Configure the Root Rule Chain
Section titled “Configure the Root Rule Chain”RPC messages already carry deviceName in their metadata, so a single integration downlink node is enough.
- Go to Data processing ⇾ Rule chains and open the Root Rule Chain.
- From the Action section, drag an integration downlink node onto the canvas.
- Enter a Name (for example,
Downlink to Tuya), select your Tuya integration, and click Add. - Connect the message type switch node to the integration downlink node with the RPC Request to Device relation.
- Click Apply changes.
Test Downlink
Section titled “Test Downlink”Import the Tuya Smart Plug dashboard. It shows the uplink data and sends commands to the plug:
- Simple neon gauge — voltage and power; Time series chart — voltage, power, and current.
- Led indicator — the on/off state from the
switch_1telemetry. - Round switch — sends an RPC with method
switch_1and paramstrueorfalse.
- Download tuya_smart_plug_dashboard.json.
- Go to Dashboards, click + Add dashboard ⇾ Import dashboard, upload the file, and click Import.
- Open the Tuya smart plug dashboard and enter edit mode.
- Click the Entity aliases icon, click the pencil icon next to the
smartPlugalias, select your device, and click Save. Then click Save in the lower-right corner. - Toggle the Round switch.
If a widget shows no data, edit it and change the data keys in Datasource to the codes your device reports.
Verify the Downlink
Section titled “Verify the Downlink”- Device — the plug switches, and the Led indicator follows after the next status report.
- Converter events — open the downlink converter’s Events tab. In shows the RPC message, Out shows the encoded command, and Metadata shows the message metadata.
- Integration events — the Downlink event has status SUCCESS. On FAILURE, the event shows “Please contact system administrator” instead of the error; see Troubleshooting to read it.
Troubleshooting
Section titled “Troubleshooting”| Symptom | Cause | Fix |
|---|---|---|
| CONNECT event with status FAILURE | Wrong Access Id, Access Key, or Region. | Copy the credentials from the project Overview page again. Select the Region that matches the project data center. |
| Integration connects, but no uplinks arrive | The messaging rule is off, or enabled in the other environment. | Enable the rule with statusReport in the environment that matches Environment. See Configure Messaging Rules. |
| Same, with the rule enabled | The device is not linked to the cloud project. | Link the app account. See Link Your Tuya App Account. |
| Subscription Status is not Good | The messaging rule was disabled or changed. | Enable the rule for the matching environment and check the subscription again. |
| Device not created | Allow create devices or assets is off, or the decoder skipped the message. | Turn the option on. Check Out in the converter events: [] means the message has no status and is not online or offline. |
Only switch_1 arrives |
The plug has no load. | Connect a load and wait for the next report. |
| Downlink event with status FAILURE and “Please contact system administrator” | The integration shows this text instead of the error. The causes are in the rows below. On a self-hosted installation, set HTTP_LOG_CONTROLLER_ERROR_STACK_TRACE=true and restart ThingsBoard: the event then shows the full error. A remote integration (Execute remotely) or a separate integration executor always shows the full error. |
Check the causes below. To see the error returned by Tuya Cloud, send the same command in the Tuya IoT Platform: Cloud ⇾ API Explorer, IoT Core, Device Control(Standard Instruction Set) ⇾ Send commands, with the device ID and the encoder’s data in commands. The response shows the Tuya code and message. |
Same, the full error has Tuya code 28841002, “IoT Core service subscription has expired.” |
The IoT Core subscription has expired. Status reports keep arriving, because the Message Service does not depend on it. | Renew IoT Core in Cloud ⇾ Cloud Services. |
| Same, the full error is “Downlink message format is not correct…” | data has neither code, a query method, nor an array of commands. |
Check Out in the downlink converter events. Make sure the RPC method reaches msg.method. |
| Same, the full error is “Device identifier not found in metadata” | The encoder’s output metadata has neither deviceId nor deviceName. |
Set deviceId in the encoder’s metadata. |
Same, the full error has Illegal character in path |
The device name is not the raw Tuya devId. |
Rename the device to its devId. Use Label for a readable name. |
| Same, the full error is “Tuya integration response error code…” | Tuya Cloud rejected the command, for example the code is not writable. |
Check the writable codes in Device Debugging in the Tuya IoT Platform. |
Uplink fails with Tuya message has no devId |
The message has no devId, for example a query response. |
Check In in the uplink converter events. Handle this message type in your own decoder. |
Downlink converter event with the error Message metadata has no deviceName |
The RPC message has no deviceName in its metadata. |
Send the RPC to the device, so the message carries the device name. |
Downlink converter event with the error Message is not an RPC request |
A message that is not an RPC request, for example an attribute update, reached the integration downlink node. | Connect the node with the RPC Request to Device relation only. |
Downlink converter event with the error RPC request has no method or RPC request has no params |
The RPC has an empty method, or no value. | Set the RPC method (the Tuya command code, for example switch_1) and the value in the widget or the RPC request. |
| No downlink event | The rule chain does not reach the integration downlink node. | Connect the node with the RPC Request to Device relation. |
To read debug events, open the integration or converter, click Events, and select an event: In is the received data, Out is the converter result, and Error holds the error text.
See Also
Section titled “See Also”- Integrations overview — how integrations, converters, uplinks, and downlinks fit together.
- Uplink data converter — decoder inputs, output format, and scripting patterns.
- Downlink data converter — encoder reference.
- Remote Integration — run the integration outside the ThingsBoard cluster.
- TBEL — built-in functions and syntax for converter scripts.
- Rule Engine — how messages are processed after decoding.
Was this helpful?