
Manage IoT solutions with ThingsBoard CLI
You can manage IoT solutions with ThingsBoard CLI two ways: manually, by running the CLI commands directly, or by letting an AI coding agent drive them for you. This page is about the AI-agent way.
Once your project is set up, you build and manage IoT solutions by describing what you want to your AI coding agent — Claude Code or Antigravity — which drives ThingsBoard CLI for you. Haven’t set up the CLI yet? Start with Getting started with ThingsBoard CLI.
tb init sets up the bundled skills and agents in your project — for entity generation, dashboards, alarms, calculated fields, and telemetry emulators — and they update with the CLI. Launch your agent from inside the project directory so the bundled skills load automatically. From there you describe the goal, and the agent designs the entities, validates them against your instance, and shows you the result before anything deploys.
What you can do
Section titled “What you can do”Describe what you want in plain English, and your agent designs, builds, and maintains it for you — no hand-written JSON:
-
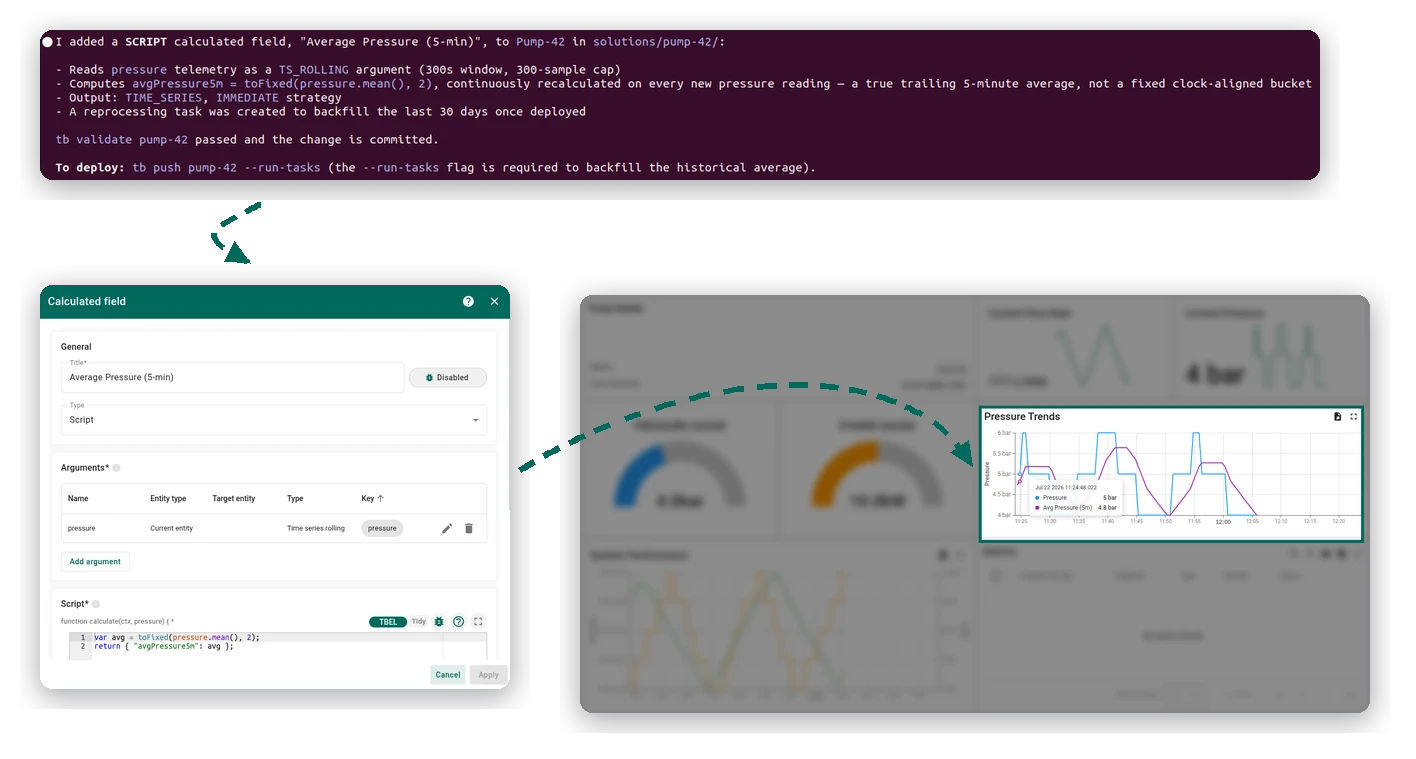
Create a single entity — one targeted artifact, like a calculated field on a specific device or a couple of devices for a profile.
Starting point: a
Pump-42device is already on your tenant, reportingflowRate,powerConsumption,pressure,rpm,temperature, andvibration.For Pump-42, I want to know the average pressure over the last 5 minutes.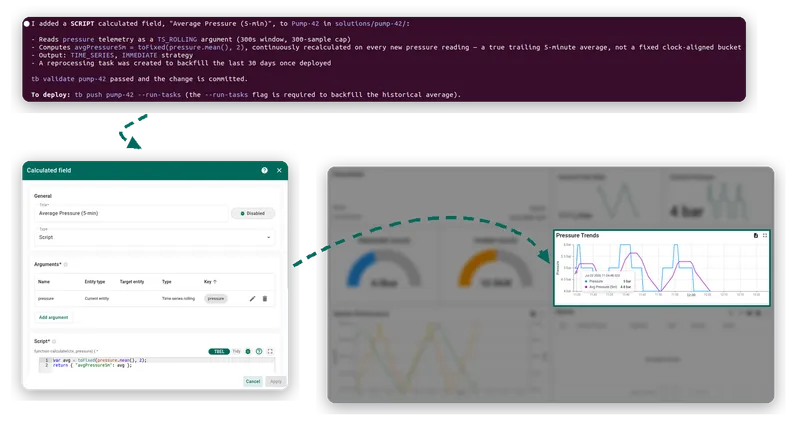
-
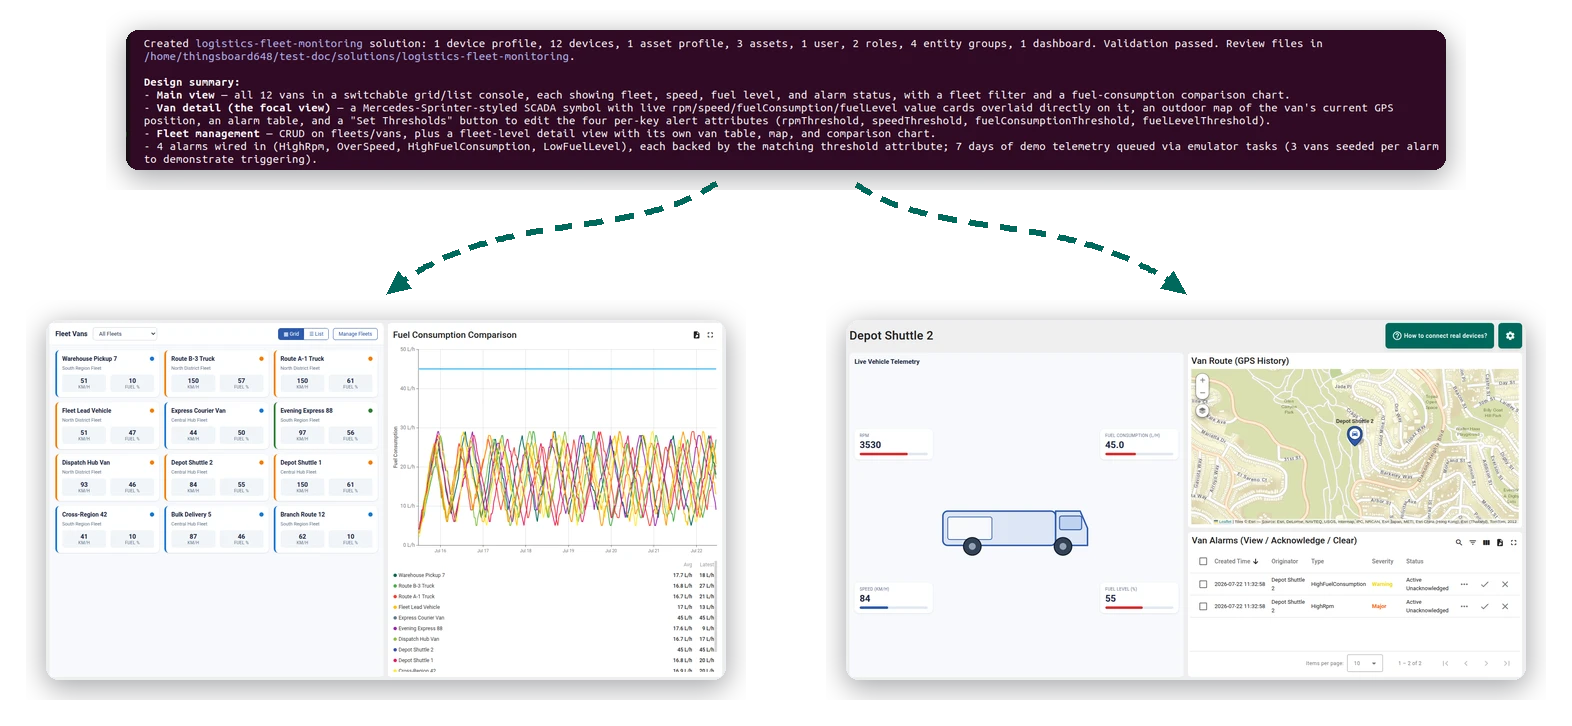
Build something new — a full solution from scratch: devices and their hierarchy, dashboards, alarm rules, calculated fields, customers and users, plus demo telemetry so the dashboards have data from day one.
Starting point: an empty tenant — no entities yet.
I want a dashboard to monitor telemetry for my logistics company. I have several fleets; each fleet contains vans, and every van reports rpm, speed, fuelConsumption, and fuelLevel.I'd like an alternative design. On the main page, show my vans in two switchable views: grid and list. When I drill down into a van, give me a button to set a threshold for each telemetry key. The full focus should be the van view: a route map, a SCADA symbol of the van, and value cards right on the widget.Aim for a very smart design.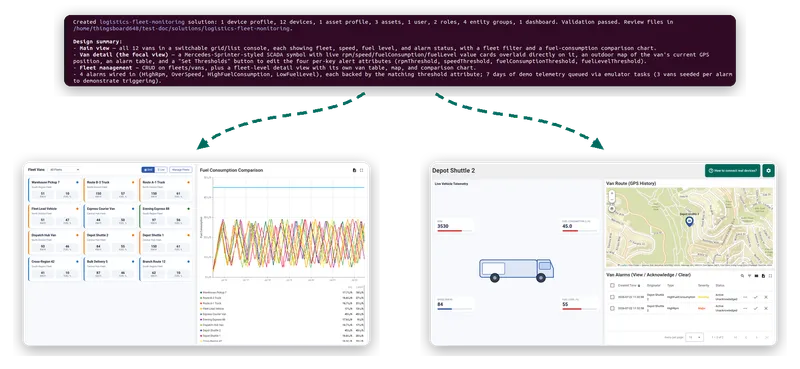
-
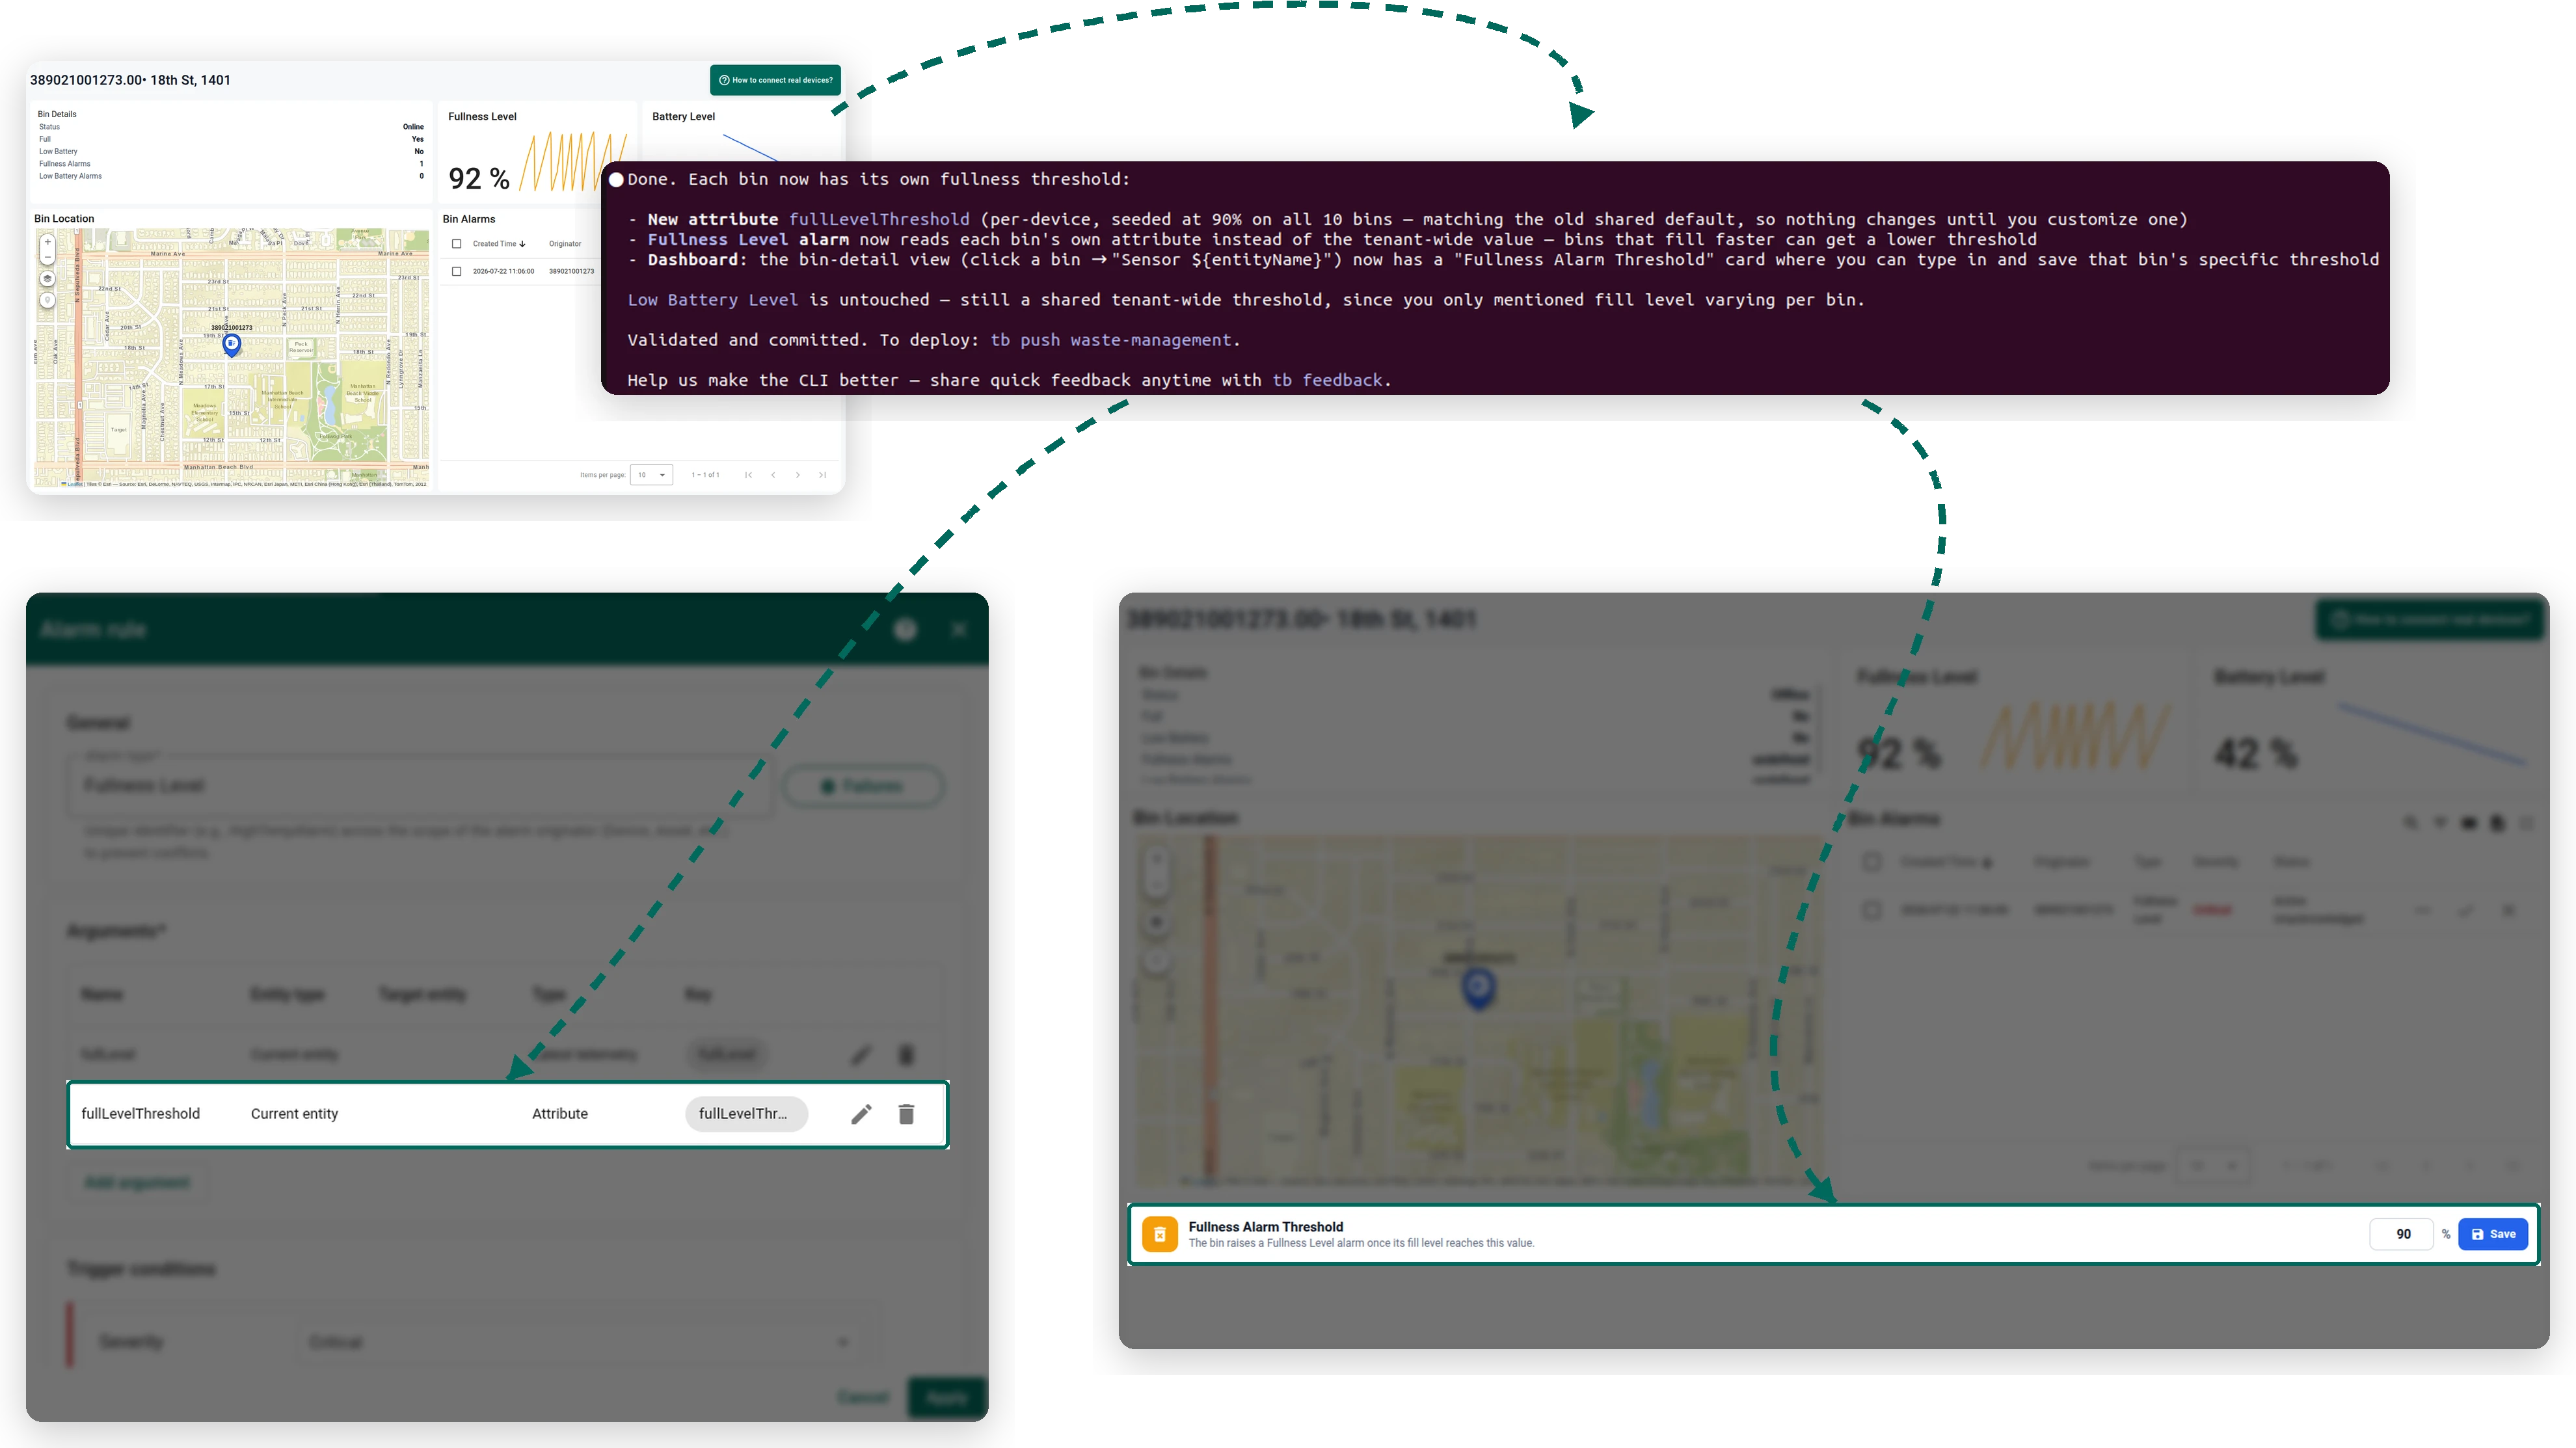
Evolve an existing solution — add devices, change a threshold, add a dashboard widget, or introduce a new sensor type. The agent edits only what changed and leaves the rest untouched.
Starting point: a waste management solution you set up earlier by hand, already running on your tenant.
In my waste management solution I want to be able to set the alarm level for each bin separately, right from the dashboard. Right now every bin alarms at the same fill level, but some bins fill up faster than others, so I need to set a different threshold for each one. Let me click on a bin and type in its own threshold, and the alarm should use that number for that specific bin.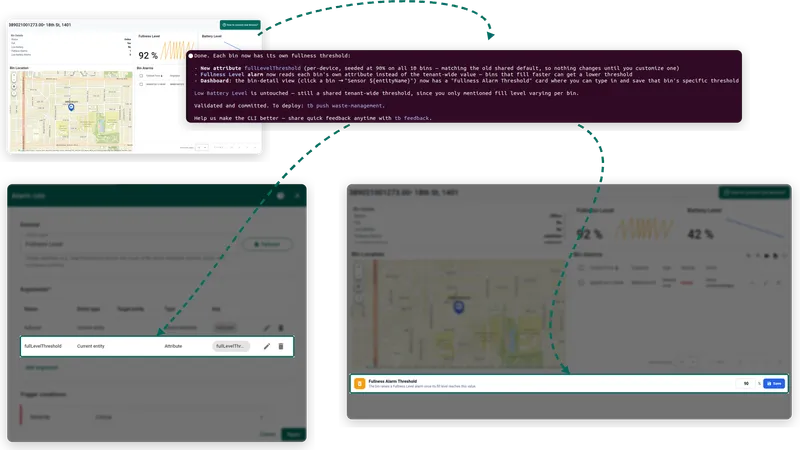
-
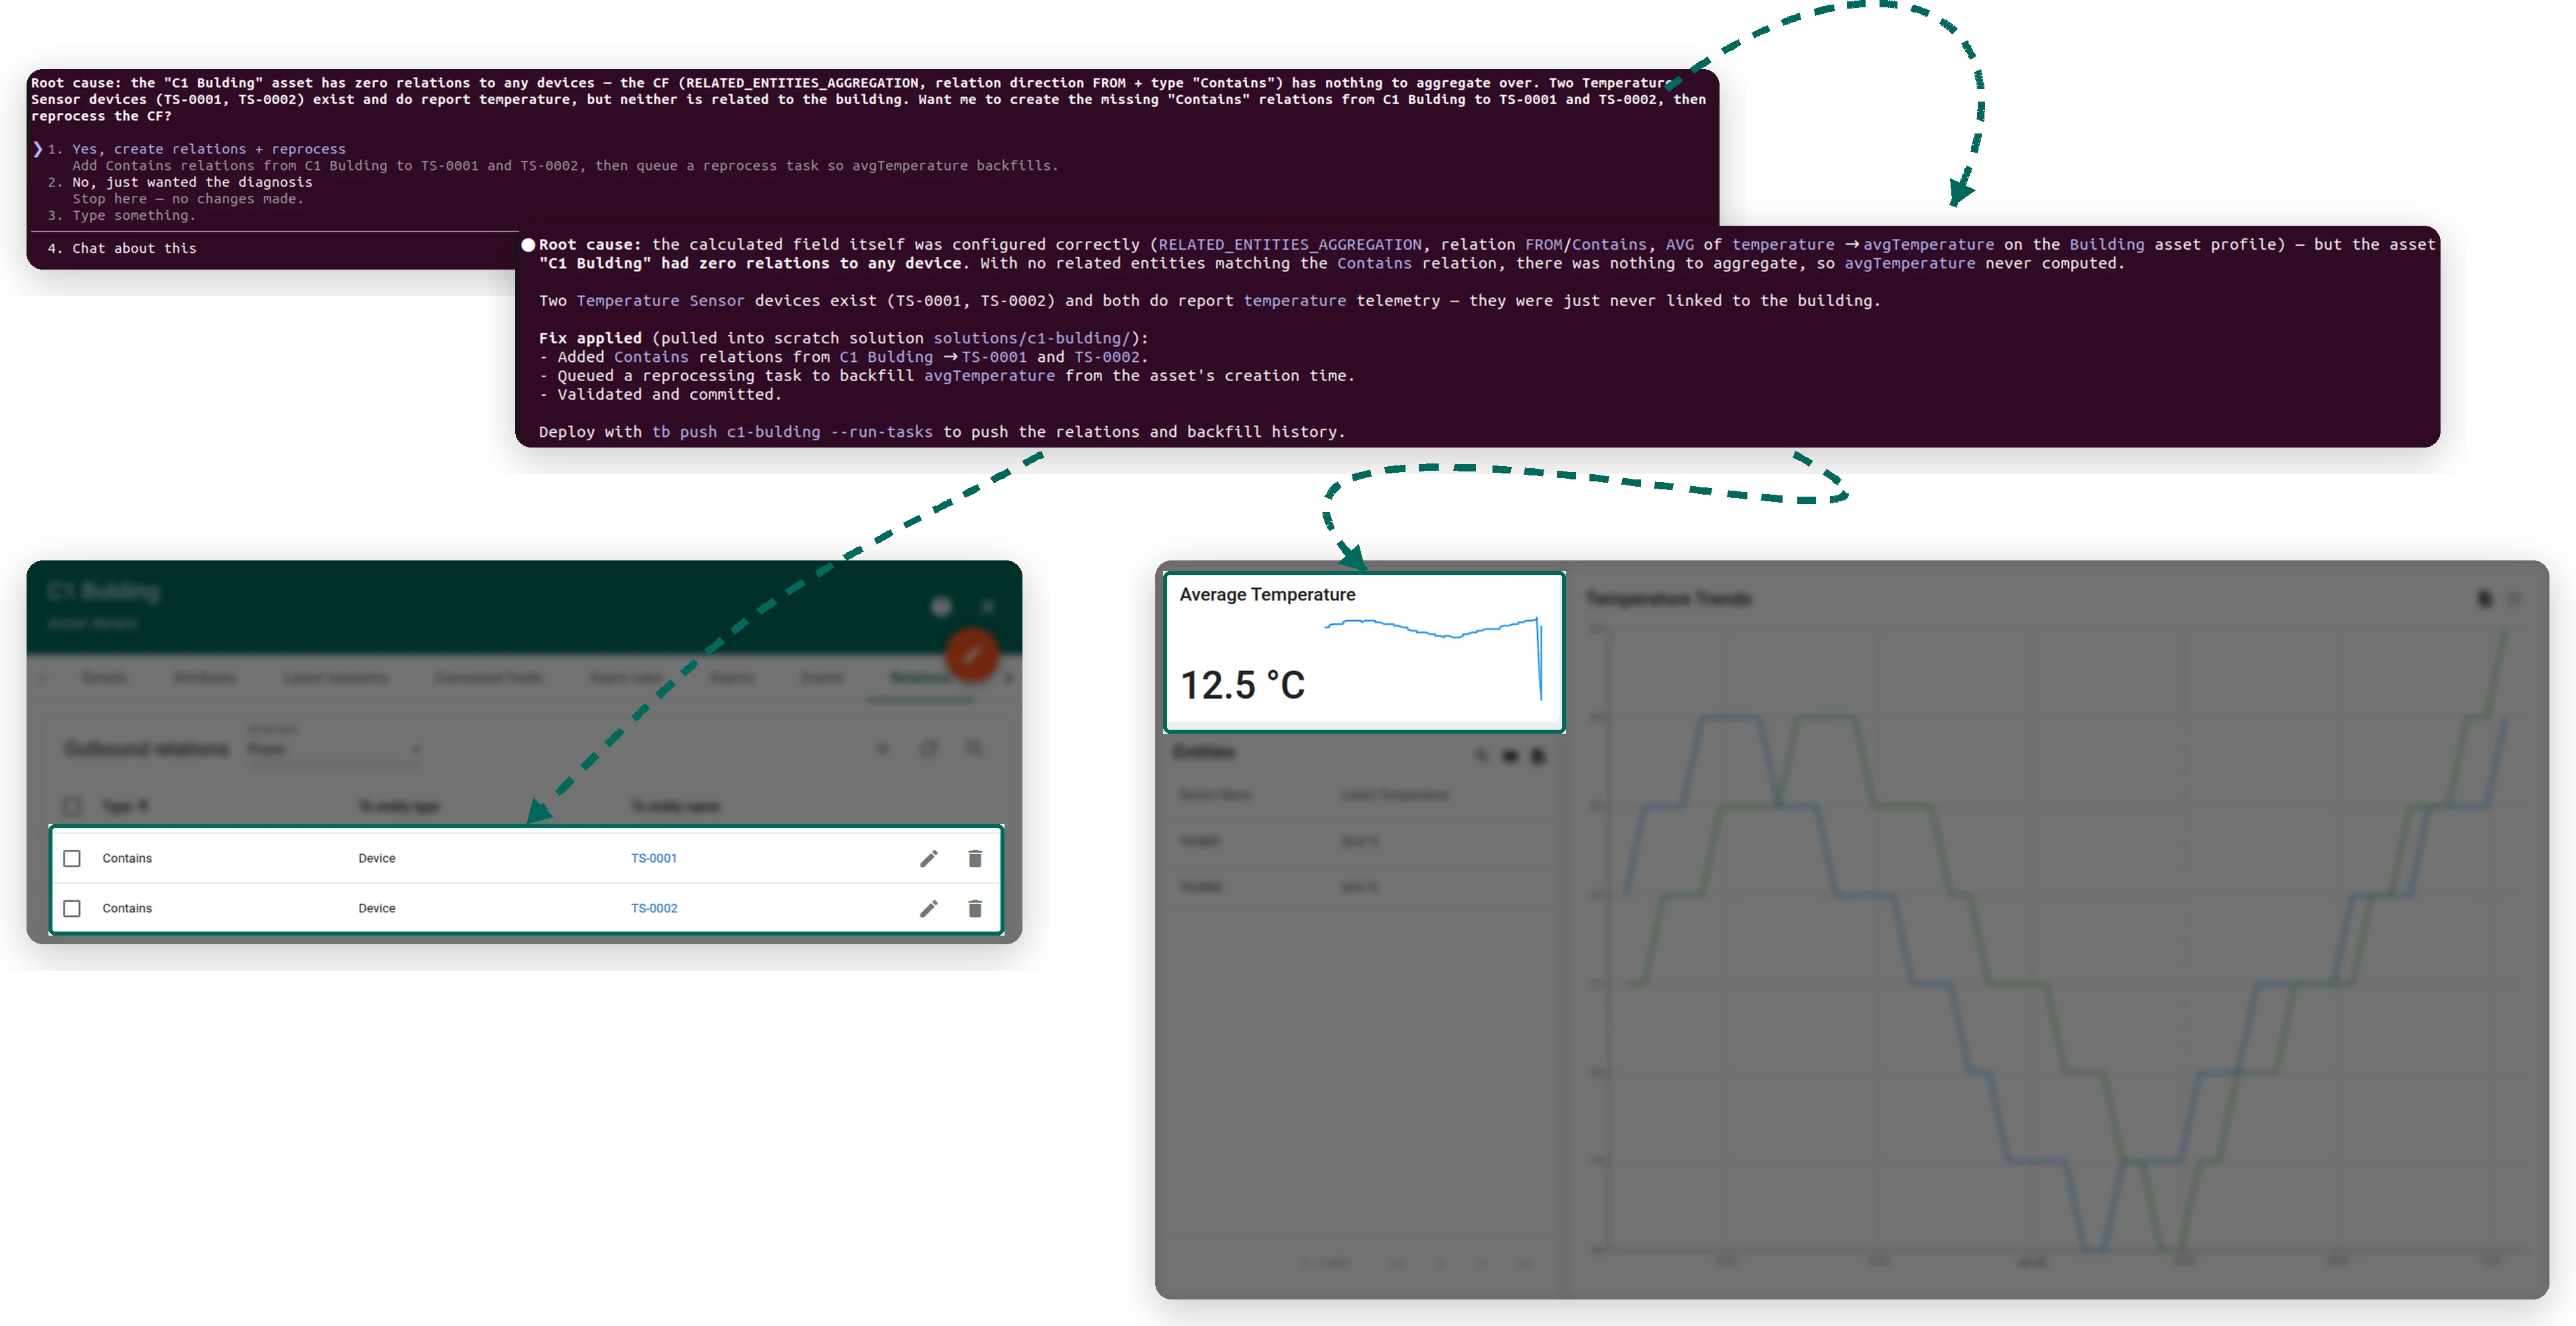
Fix something that’s broken — point the agent at a misbehaving entity, like a calculated field that produces no values or an alarm that never fires. It diagnoses the cause, proposes a fix, and applies it only after you approve.
Starting point: a building asset and its temperature sensor devices are already on your tenant, and a calculated field you added by hand isn’t producing any values — and you can’t tell why.
My calculated field "Building Average Temperature" isn't producing any values. The building should show the average temperature across all its temperature sensors, but avgTemperature is just empty — nothing ever shows up. Can you look into why and tell me what's going on?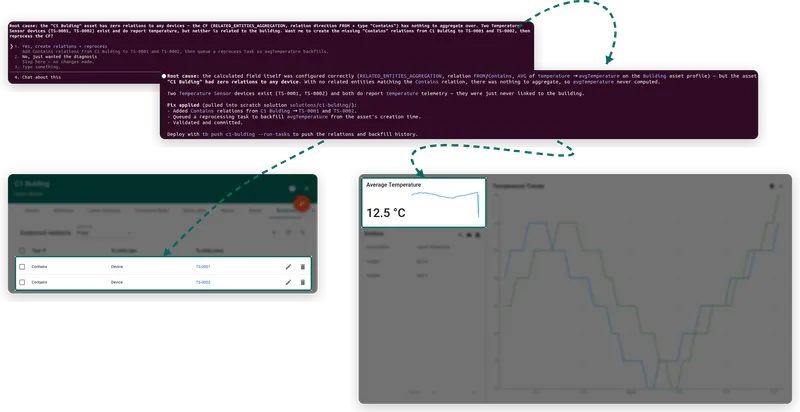
These are the actions people reach for most — but they’re not the limit. You can ask for any custom result you want, and the more detail you give (the entities, their hierarchy, who sees what, and the thresholds that matter), the closer the agent’s result matches what you had in mind.
The agent builds and validates everything locally — you deploy it yourself with tb push. Push to a dev instance first, check that everything’s correct, then deploy to prod:
tb push <solution> --profile dev --run-tasks # deploy to your dev instance, with demo datatb push <solution> --profile prod # deploy to production--run-tasks runs the telemetry emulators and backfills the calculated fields the agent set up, so a fresh instance has data the moment the solution goes live. For all push options and profiles, see Getting started with ThingsBoard CLI.
Why it’s powerful
Section titled “Why it’s powerful”Working through the CLI gives you more than a faster way to click:
- Fully custom, not template-bound. The agent’s real strength is flexibility. Beyond the system widgets, it can craft a fully custom visualization or control for you inside an HTML container widget — written to your exact description. That means almost any dashboard layout or interaction you can picture is within reach, so you’re free to describe the result you actually want rather than the closest ready-made option.
- Versioned by default. The agent commits every change it makes, so your whole IoT setup lives in git. Switch to any earlier version of your project whenever you need to, and restore any previous state — no rebuilds.
- One source, every environment. The same project files deploy to dev, staging, and production under different profiles. Promote with a single
tb push, and pushes are idempotent — re-push as often as you like and nothing duplicates, so environments never drift.
Hands-on guide: build and update a solution
Section titled “Hands-on guide: build and update a solution”This walkthrough builds a solution from a single prompt, then updates it — the everyday loop of working with the agent. We’ll build a smart retail solution: a chain of supermarket stores with refrigeration, ambient, and people-counter sensors, and a dashboard to monitor them.
-
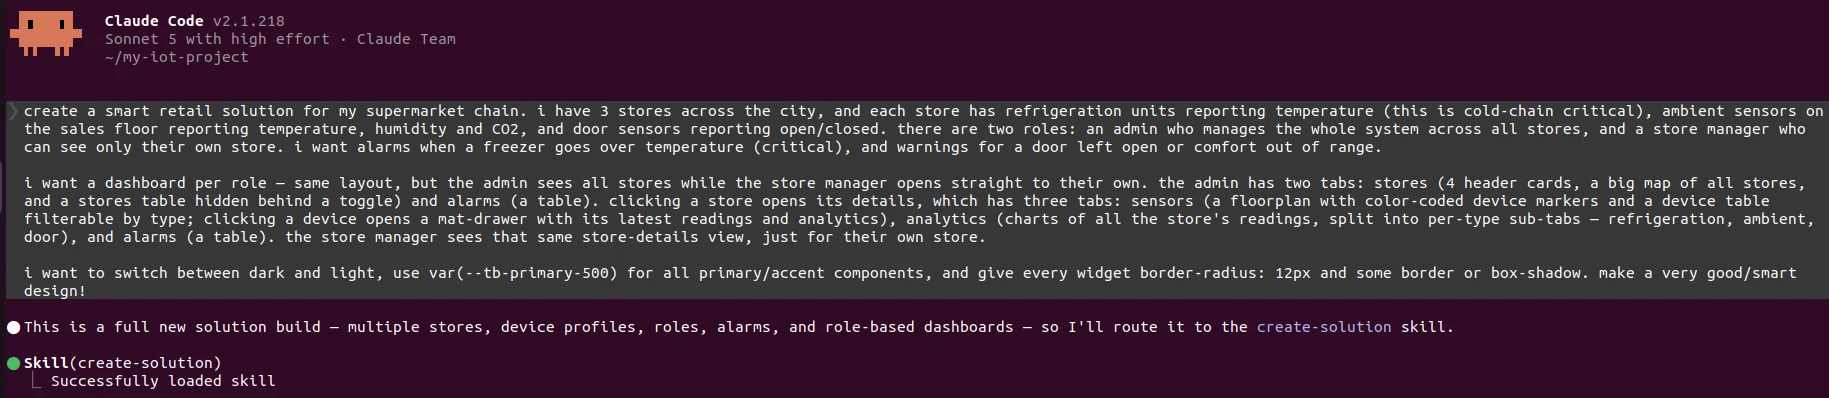
Describe what you want. Front-load the whole picture in your first prompt — the domain, the entity hierarchy, who sees what, the alarms that matter, and how the dashboard should behave. The more detail you give, the closer the first design lands:
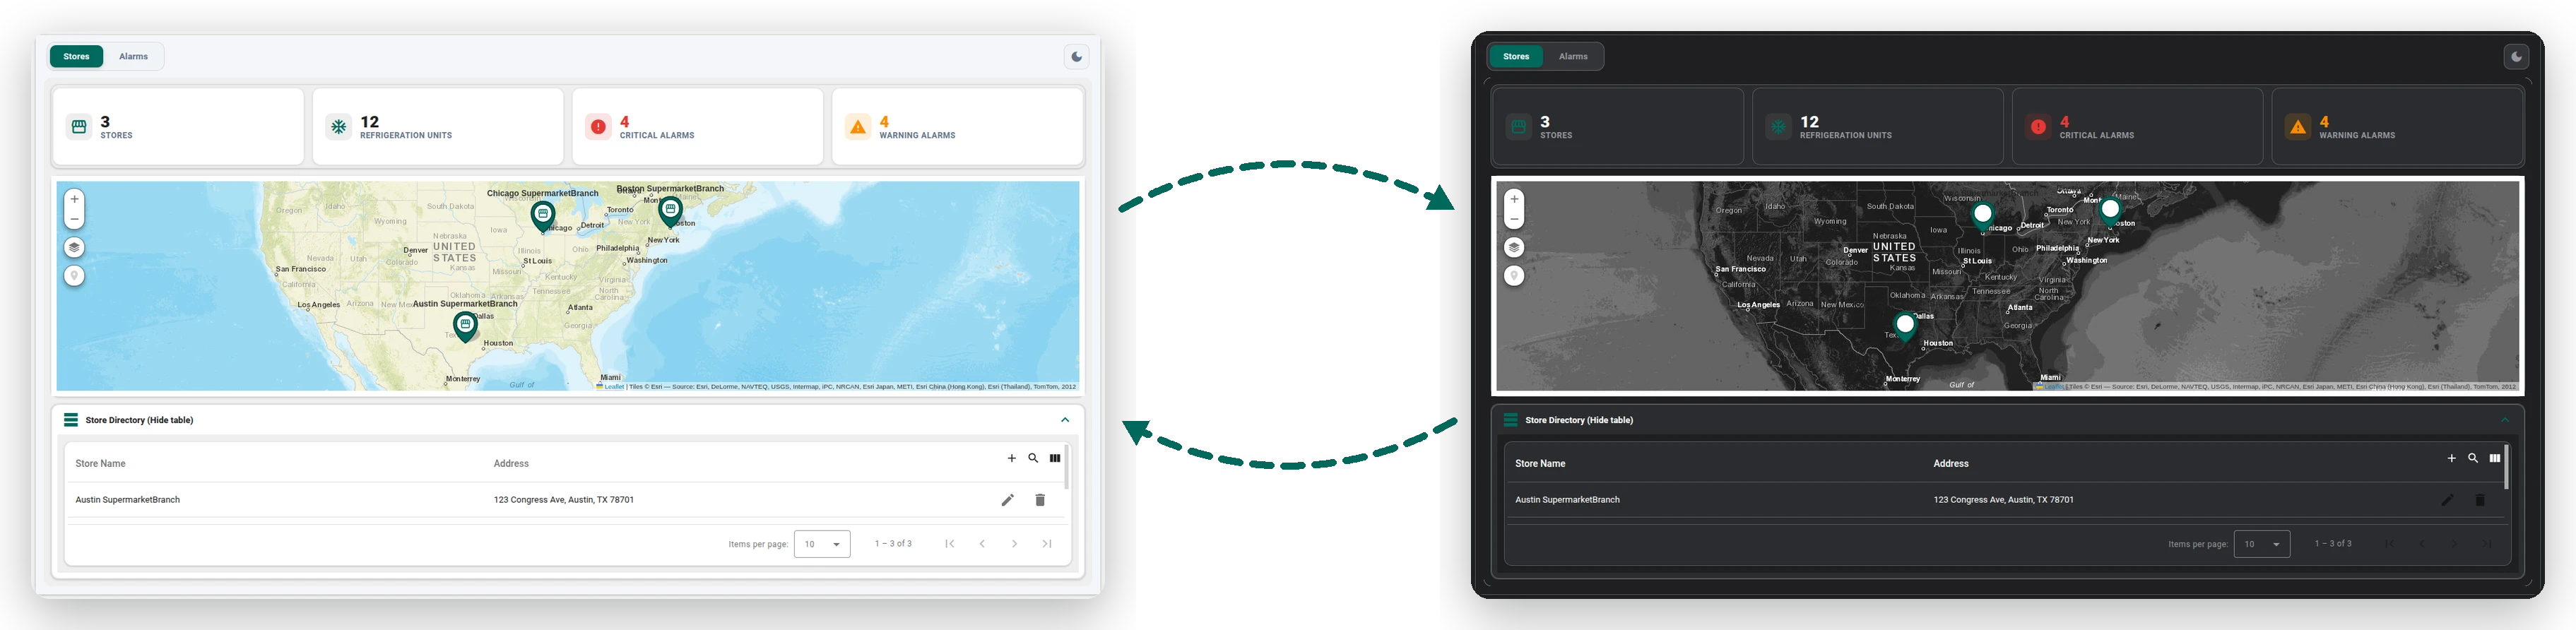
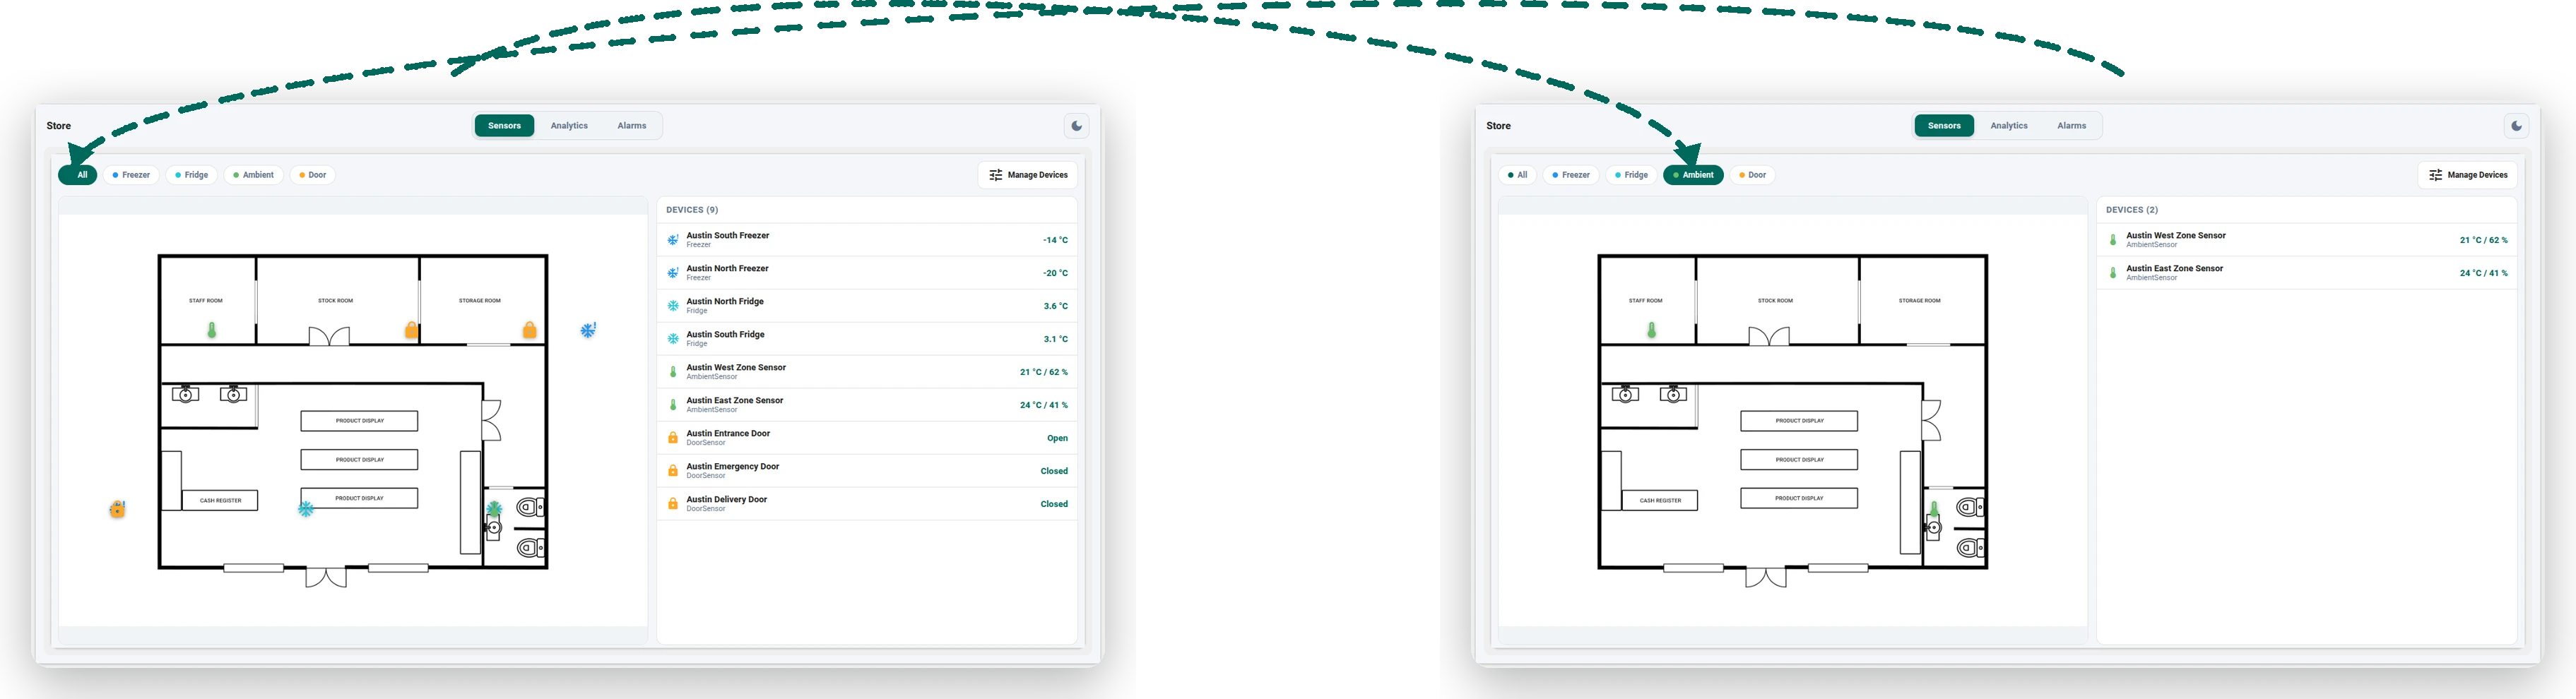
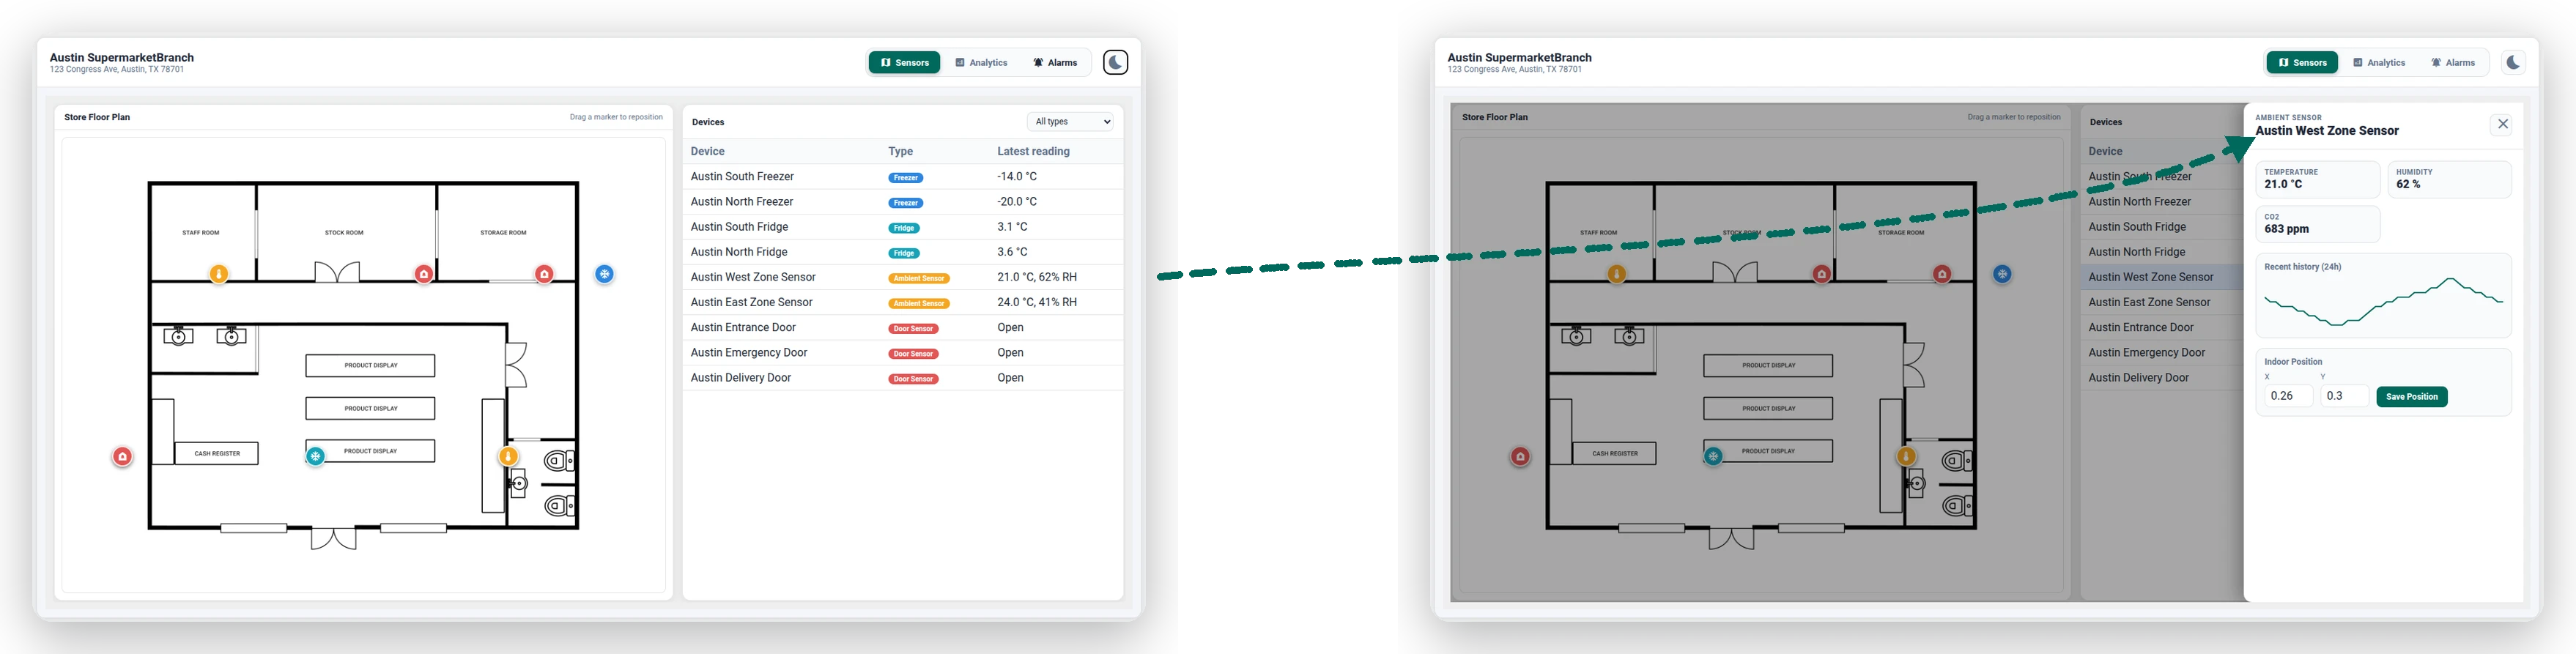
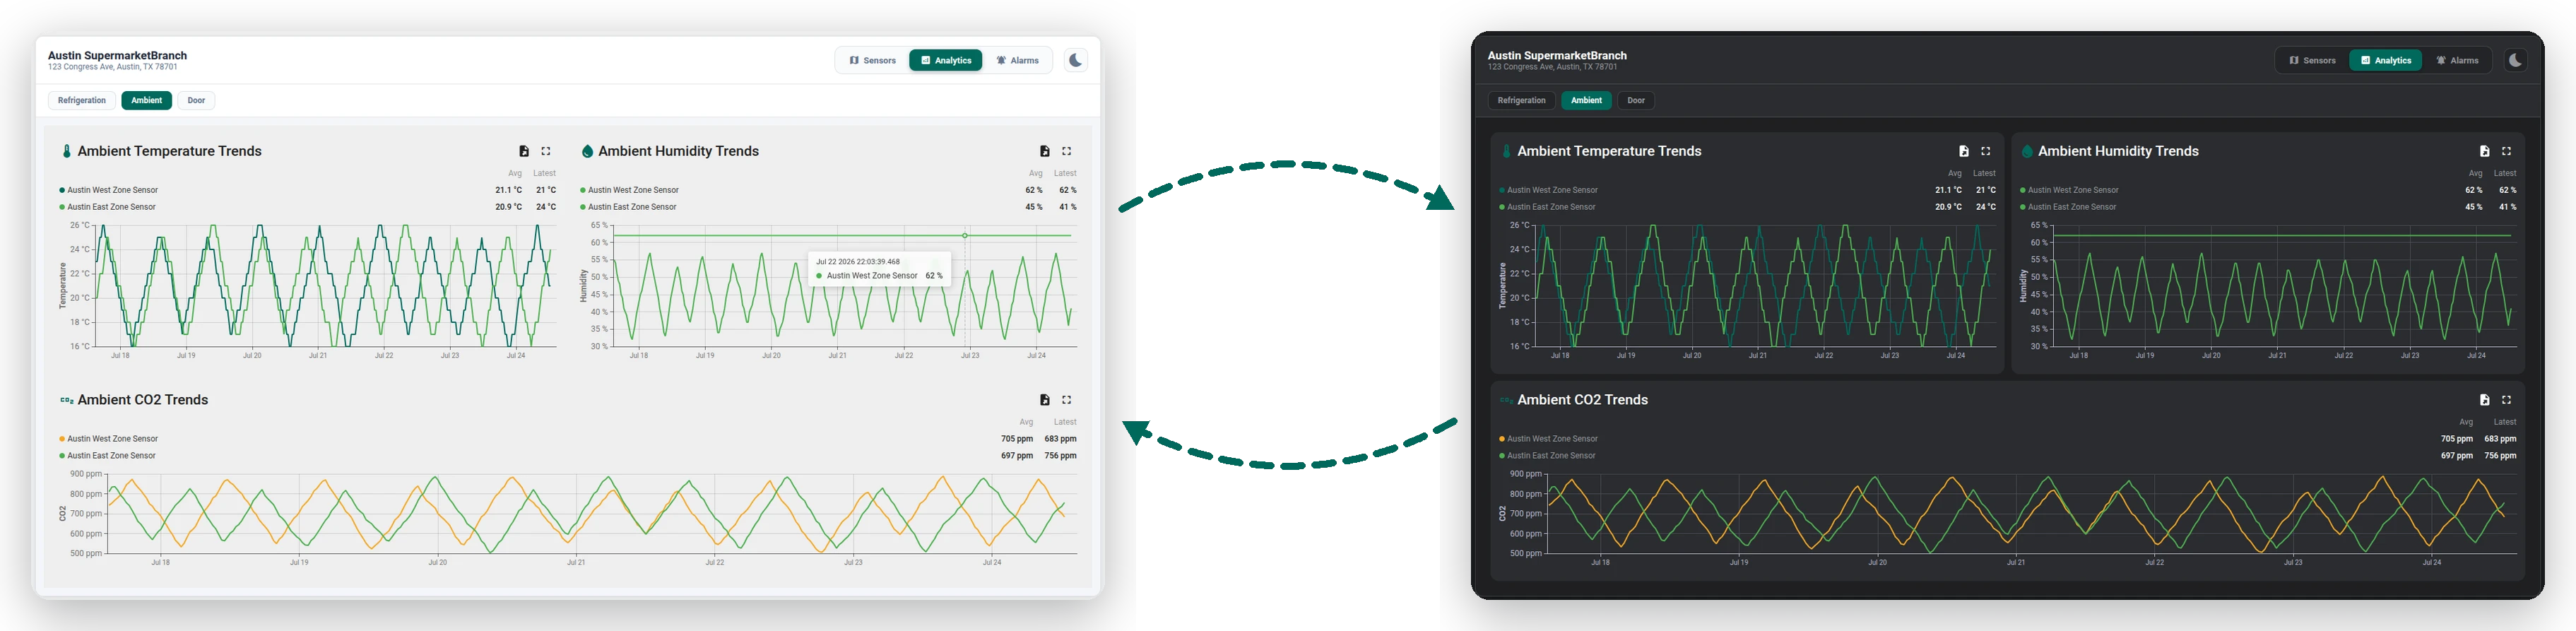
create a smart retail solution for my supermarket chain. i have 3 stores across the city, and each store has refrigeration units reporting temperature (this is cold-chain critical), ambient sensors on the sales floor reporting temperature, humidity and CO2, and door sensors reporting open/closed. there are two roles: an admin who manages the whole system across all stores, and a store manager who can see only their own store. i want alarms when a freezer goes over temperature (critical), and warnings for a door left open or comfort out of range.i want a dashboard per role — same layout, but the admin sees all stores while the store manager opens straight to their own. the admin has two tabs: stores (4 header cards, a big map of all stores, and a stores table hidden behind a toggle) and alarms (a table). clicking a store opens its details, which has three tabs: sensors (a floorplan with color-coded device markers and a device table filterable by type; clicking a device opens a mat-drawer with its latest readings and analytics), analytics (charts of all the store's readings, split into per-type sub-tabs — refrigeration, ambient, door), and alarms (a table). the store manager sees that same store-details view, just for their own store.i want to switch between dark and light, use var(--tb-primary-500) for all primary/accent components, and give every widget border-radius: 12px and some border or box-shadow. make a very good/smart design!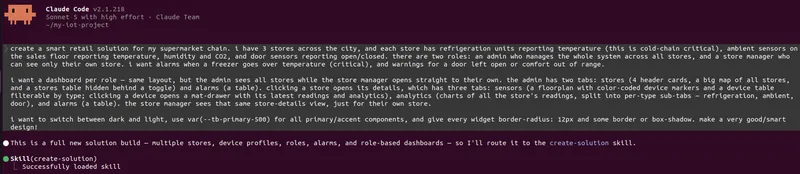
-
Choose how to review it. Before building anything, the agent asks how you want to approve the design: pause after the entity model and again after the dashboards so you can review each in turn, or build everything in one pass and see the results as it goes. You can switch modes anytime by telling it to just continue or to stop asking.

-
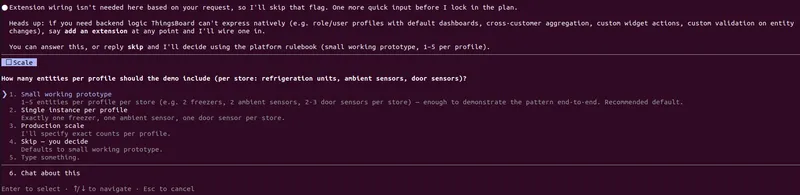
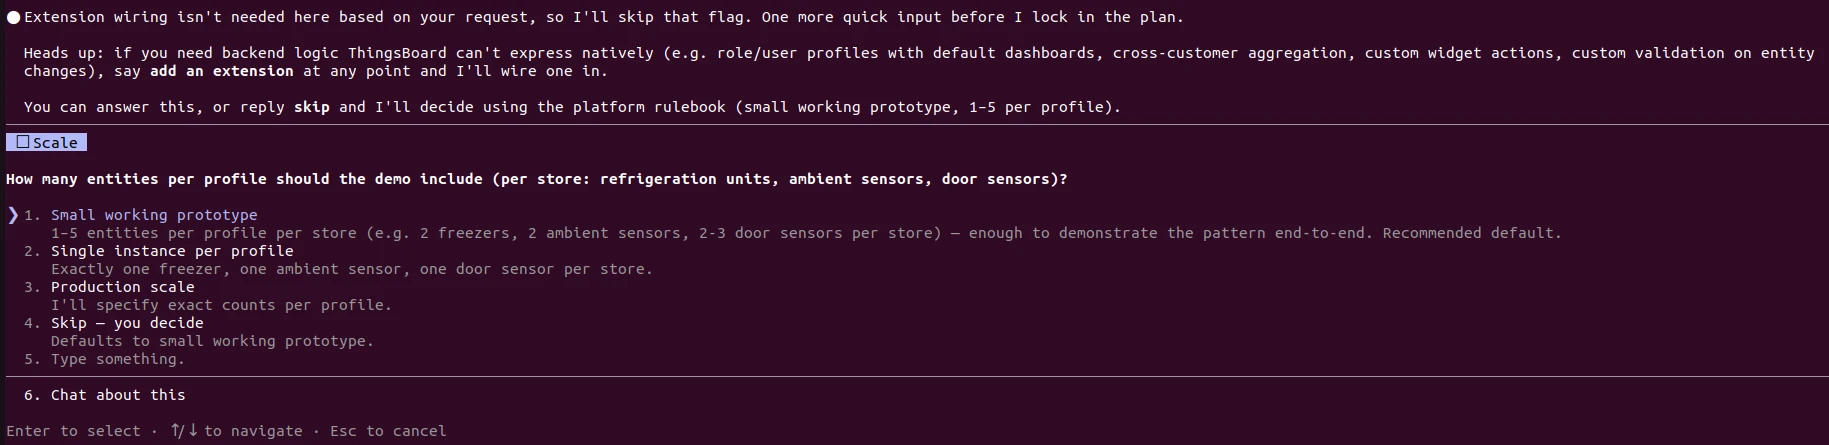
Answer the agent’s questions. Before it proposes anything, the agent asks clarifying questions to fill the gaps in your request — here, how many devices of each type to generate for the demo. Answer them, or let it decide with sensible defaults.
-
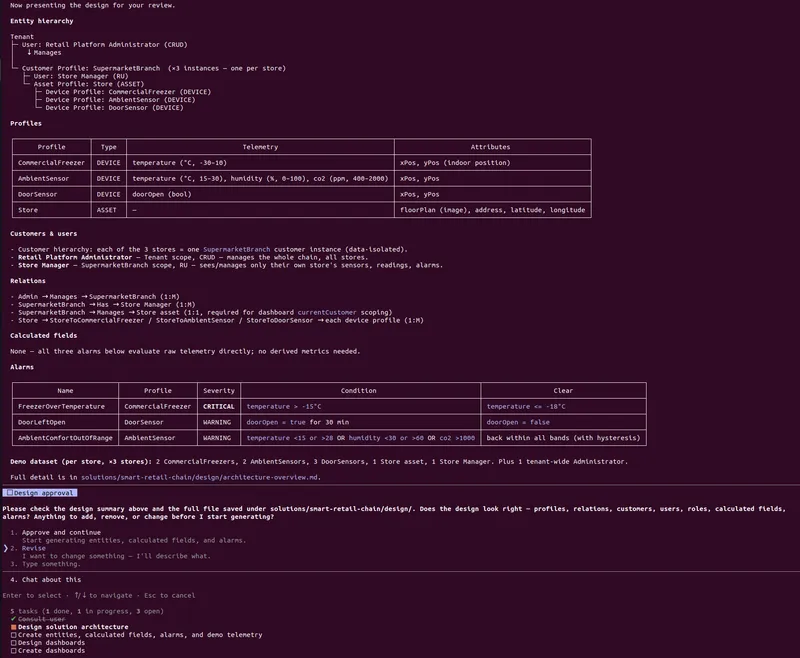
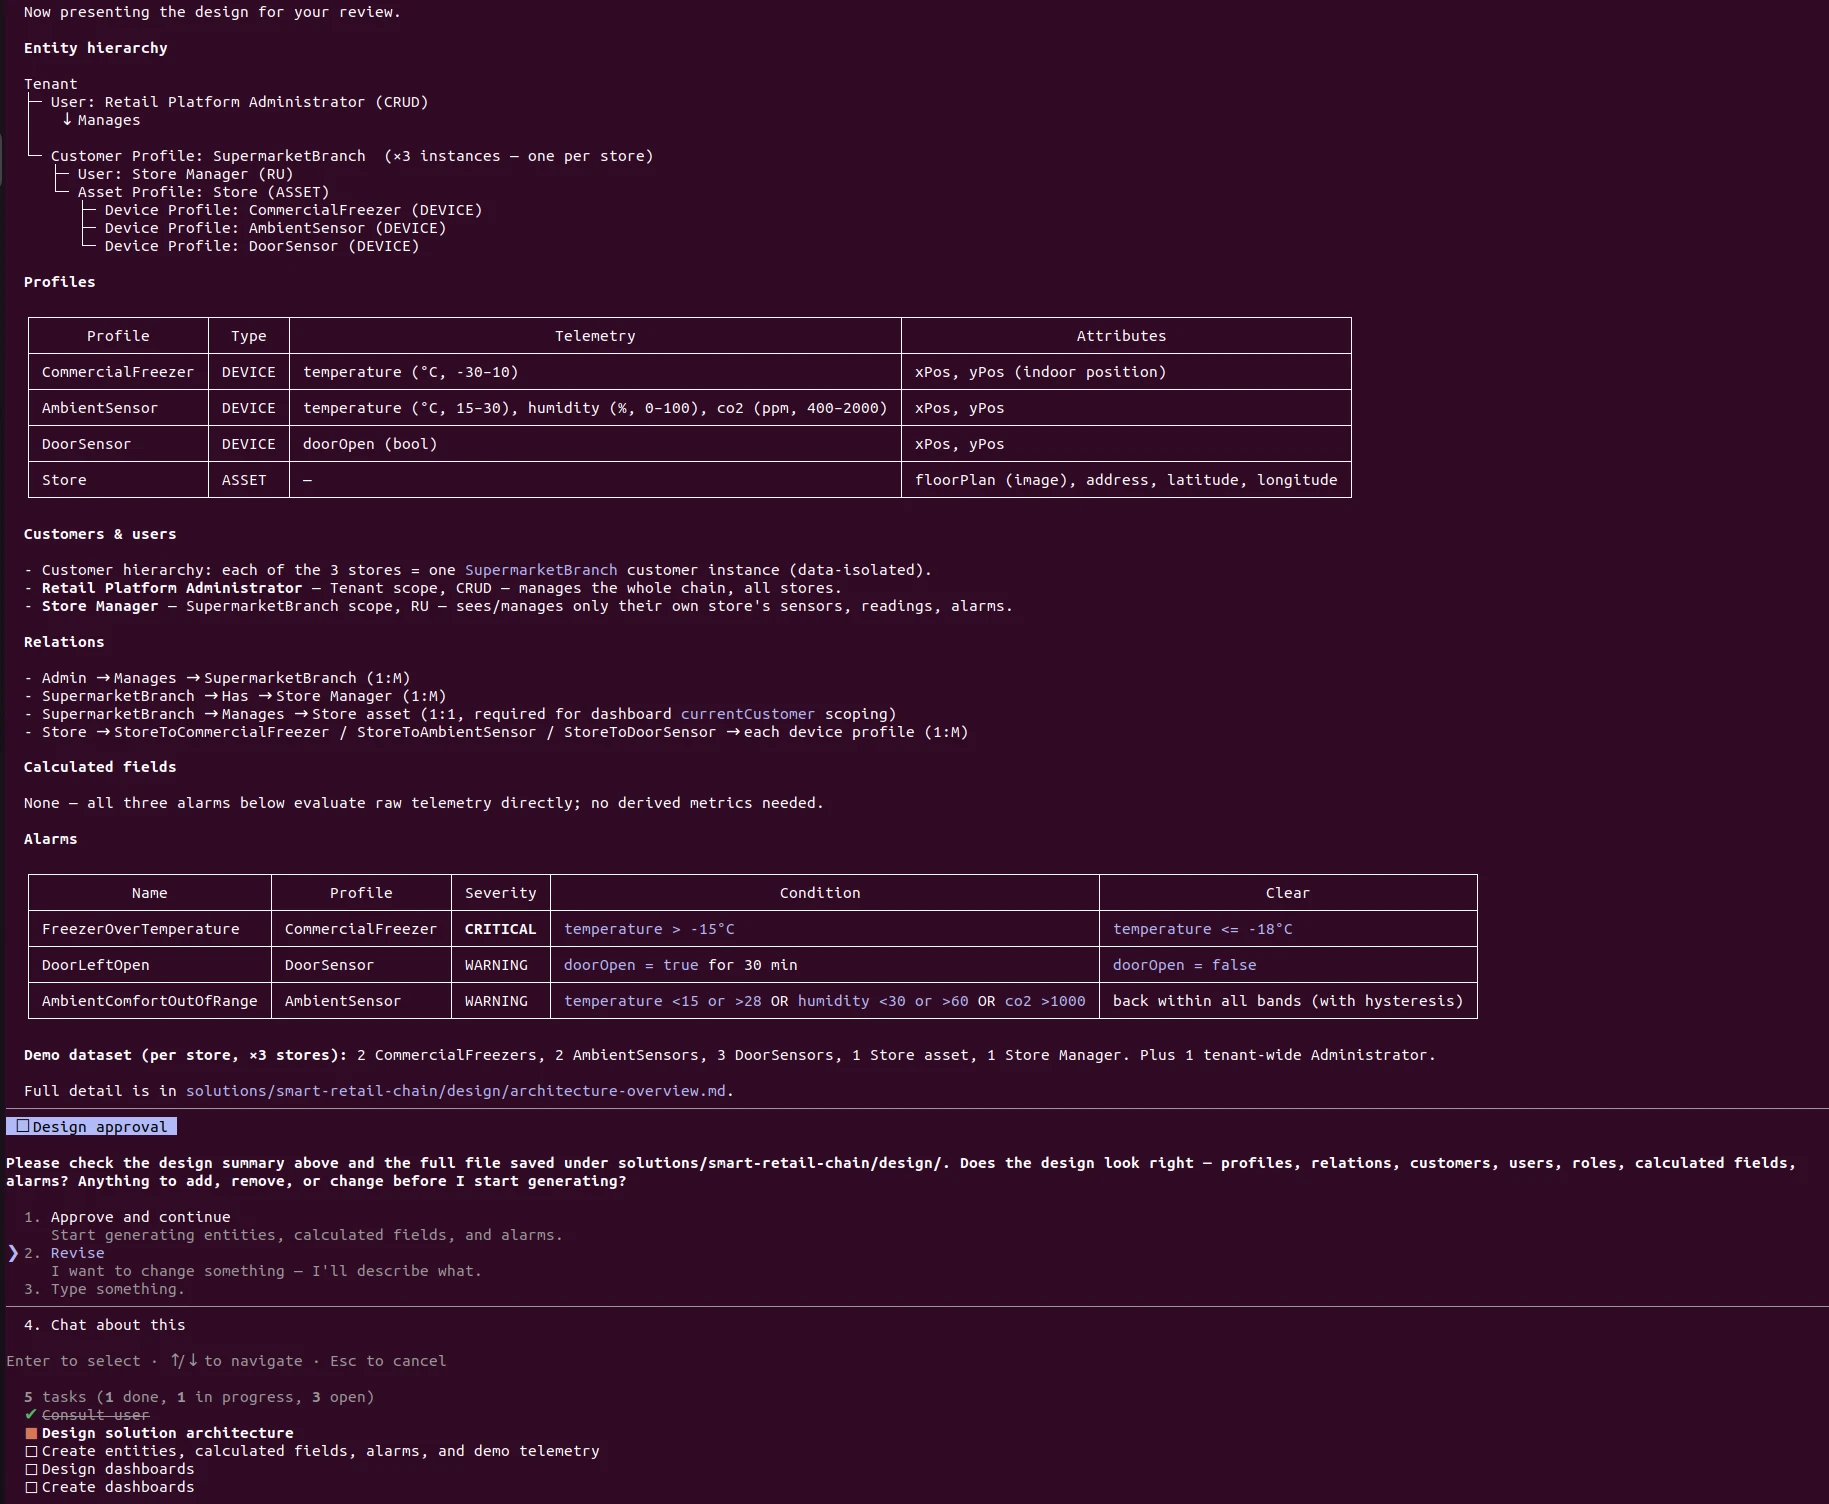
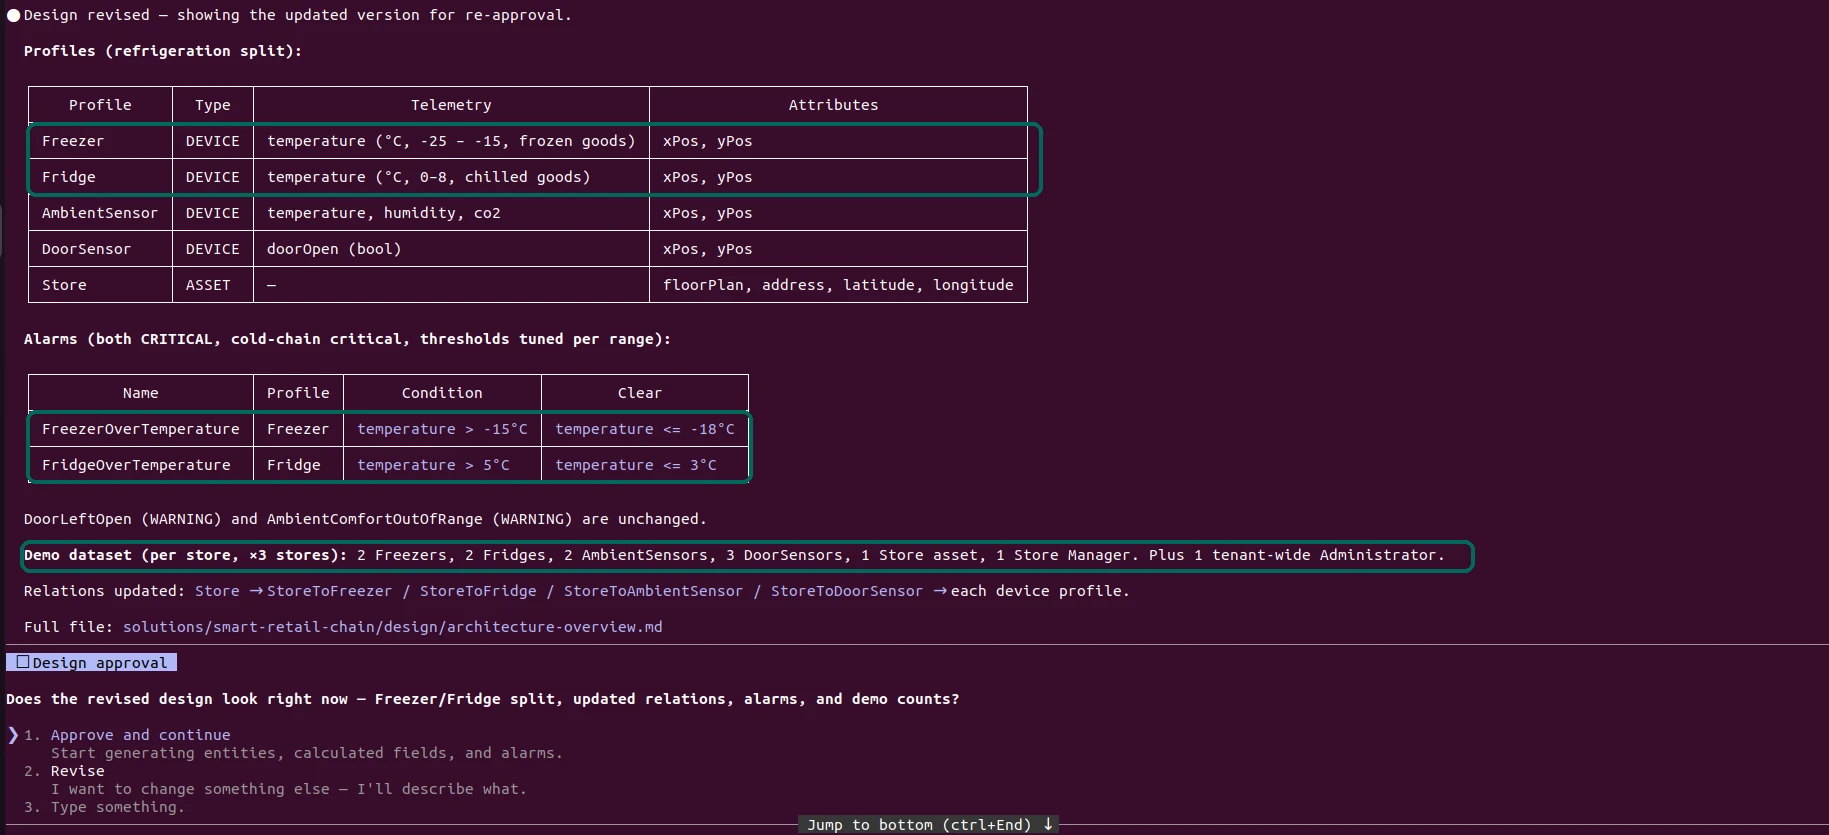
Review the proposed design. The agent lays out the full design before creating anything: the entity hierarchy, each device profile with its telemetry keys and attributes, the relations, the alarm rules, and the demo data it will generate. Approve to continue, or revise if something’s off.
-
Revise anything that’s off. If the design isn’t quite right, choose Revise and describe the change — the agent reworks the design and brings it back for approval, with no entities created yet. Say you want to separate frozen storage from chilled:
split CommercialFreezer into two profiles — Freezer and Fridge — since a freezer for frozen goods needs a much lower range than a fridge for chilled goods.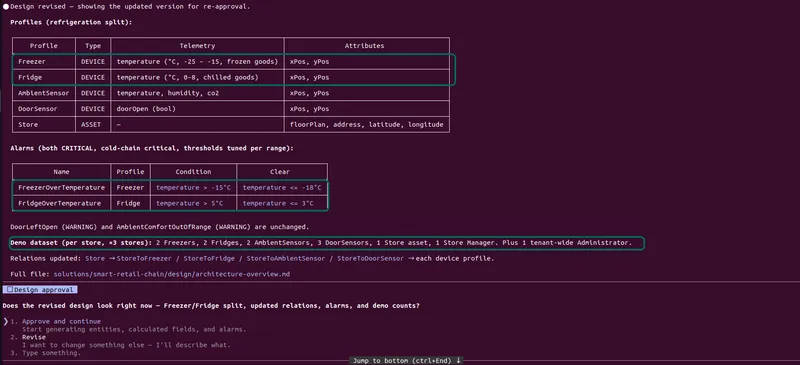
-
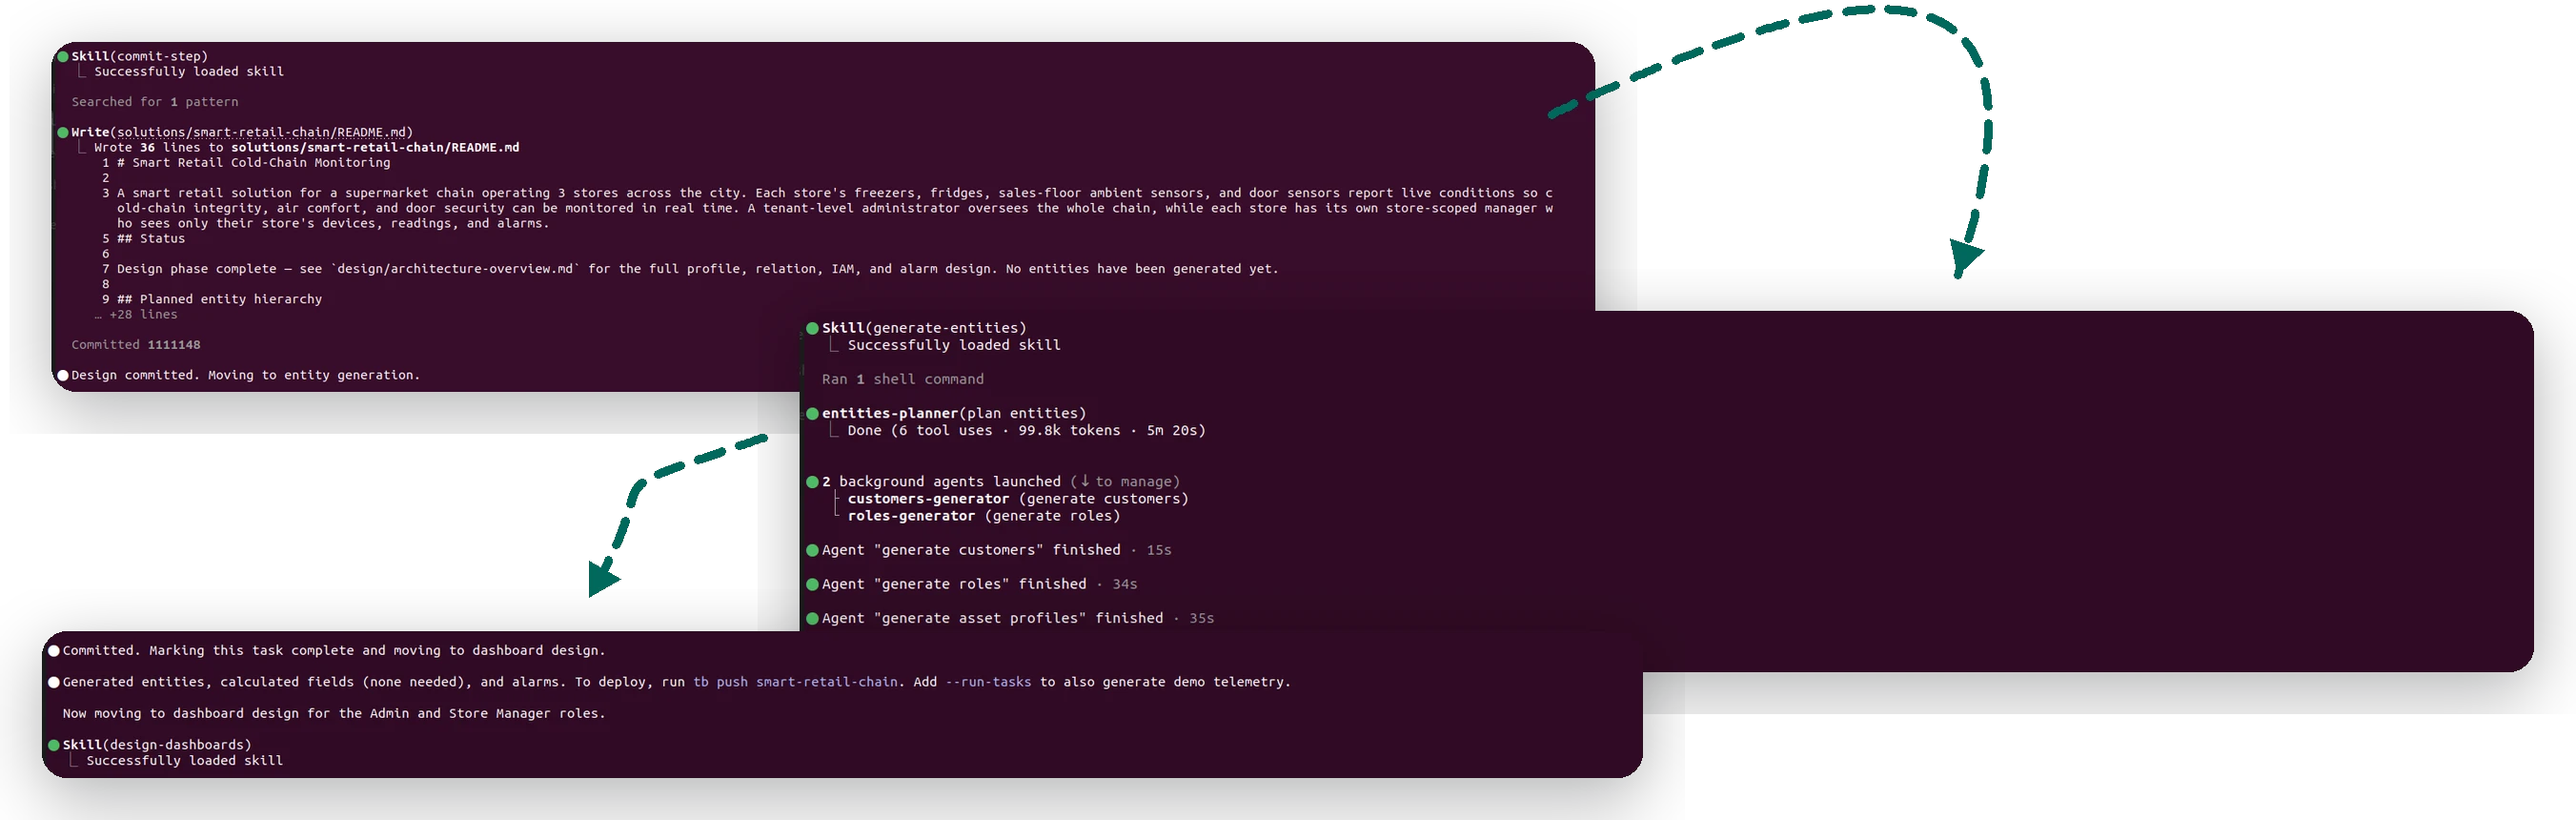
Let it build the entities — each milestone is committed. Once you approve, the agent writes a
README.mdfor thesmart-retail-chainsolution and commits the solution directory to your project’s git history, then generates everything from the design — profiles, devices, assets, customers, users, roles, and the alarm rules — with several workers running in parallel. It commits the directory again as the files land, so each milestone — the design first, then the generated entities — is its own restorable checkpoint in git.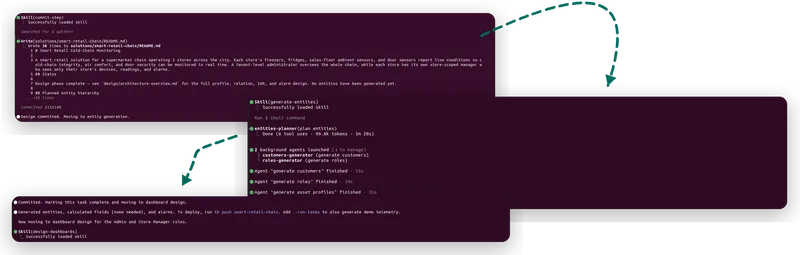
-
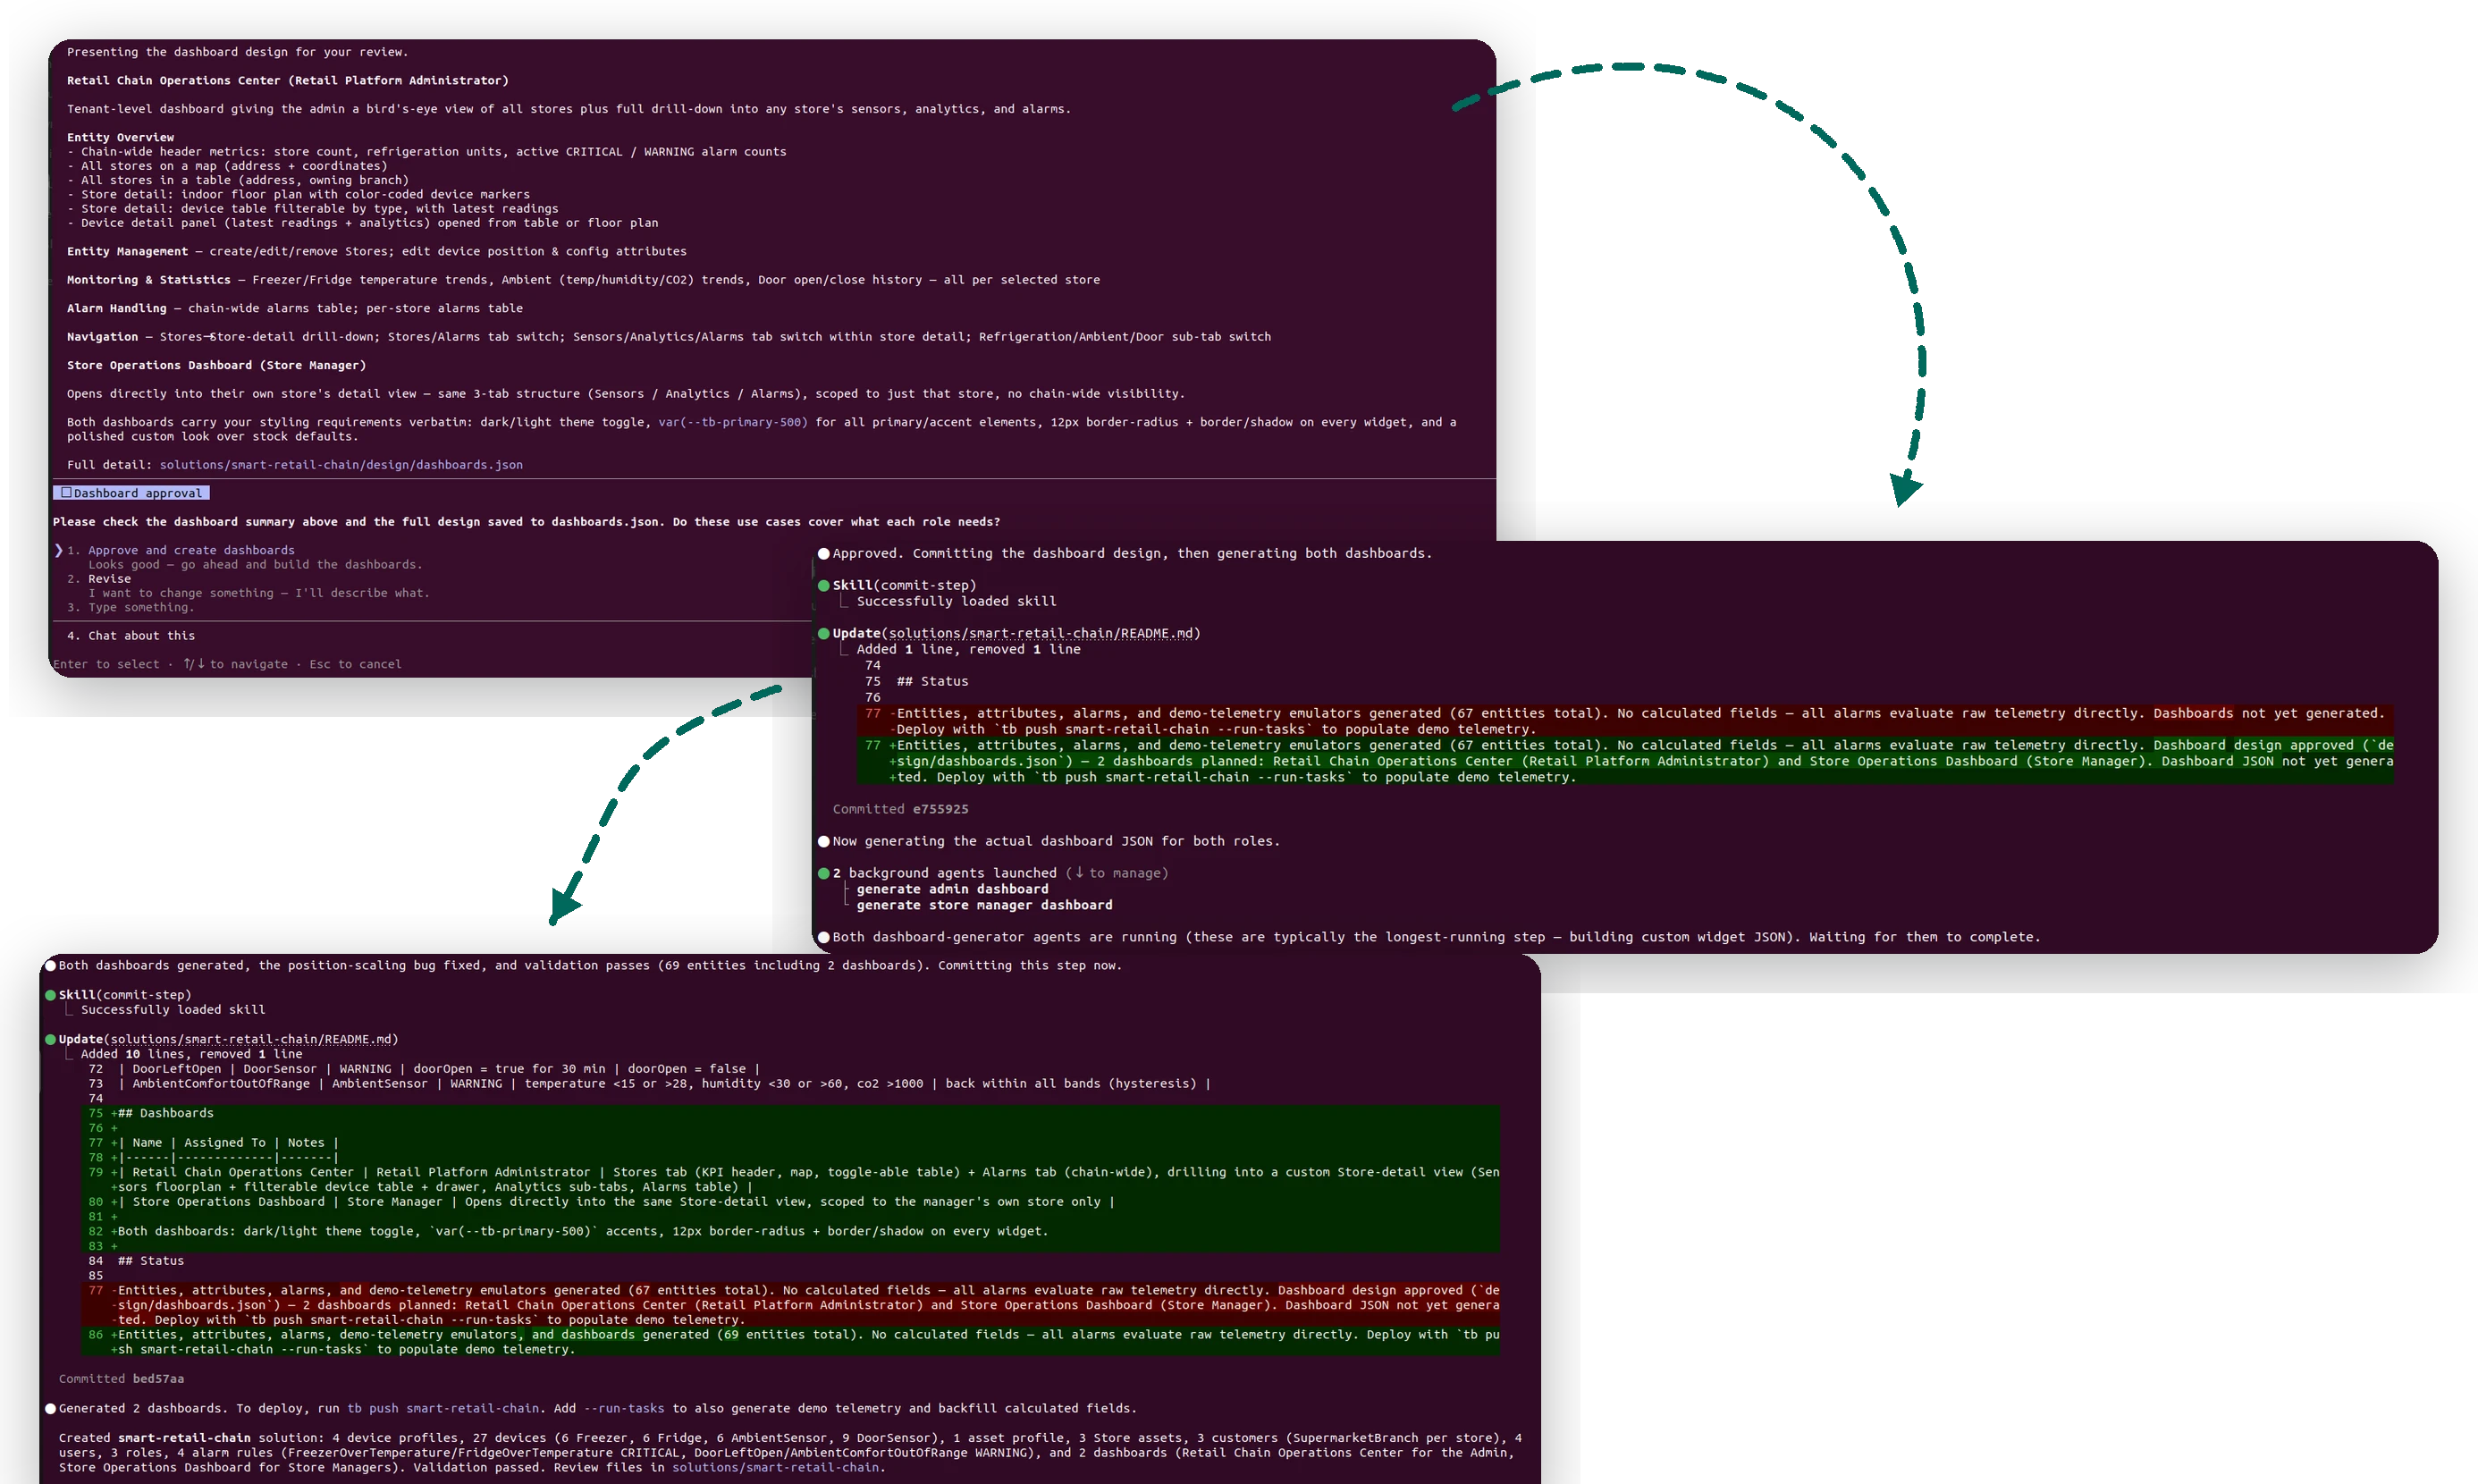
Review and build the dashboards. With the entities in place, the agent designs the dashboards and pauses at a dashboard-approval gate. Here it proposes two — a chain-wide Retail Chain Operations Center for the admin (Stores and Alarms tabs, drilling into any store’s Sensors / Analytics / Alarms) and a Store Operations Dashboard for the store manager (opening straight to its own store) — both carrying your UI spec (sidebar, header cards, map, toggle table, floorplan with markers, mat-drawer, per-type analytics sub-tabs, dark/light,
var(--tb-primary-500), 12px radius). Approve, and it commits the design, generates both dashboards in parallel, and reports the finished solution — validated and ready to deploy.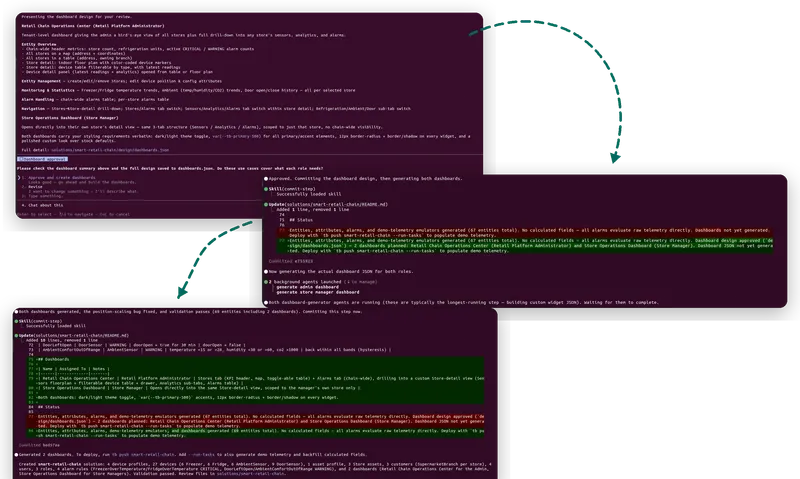
-
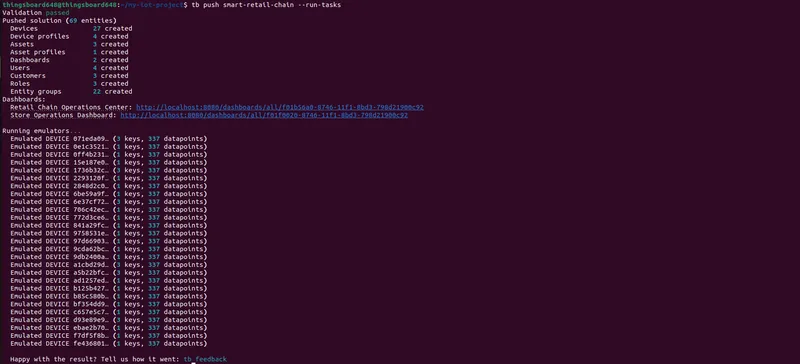
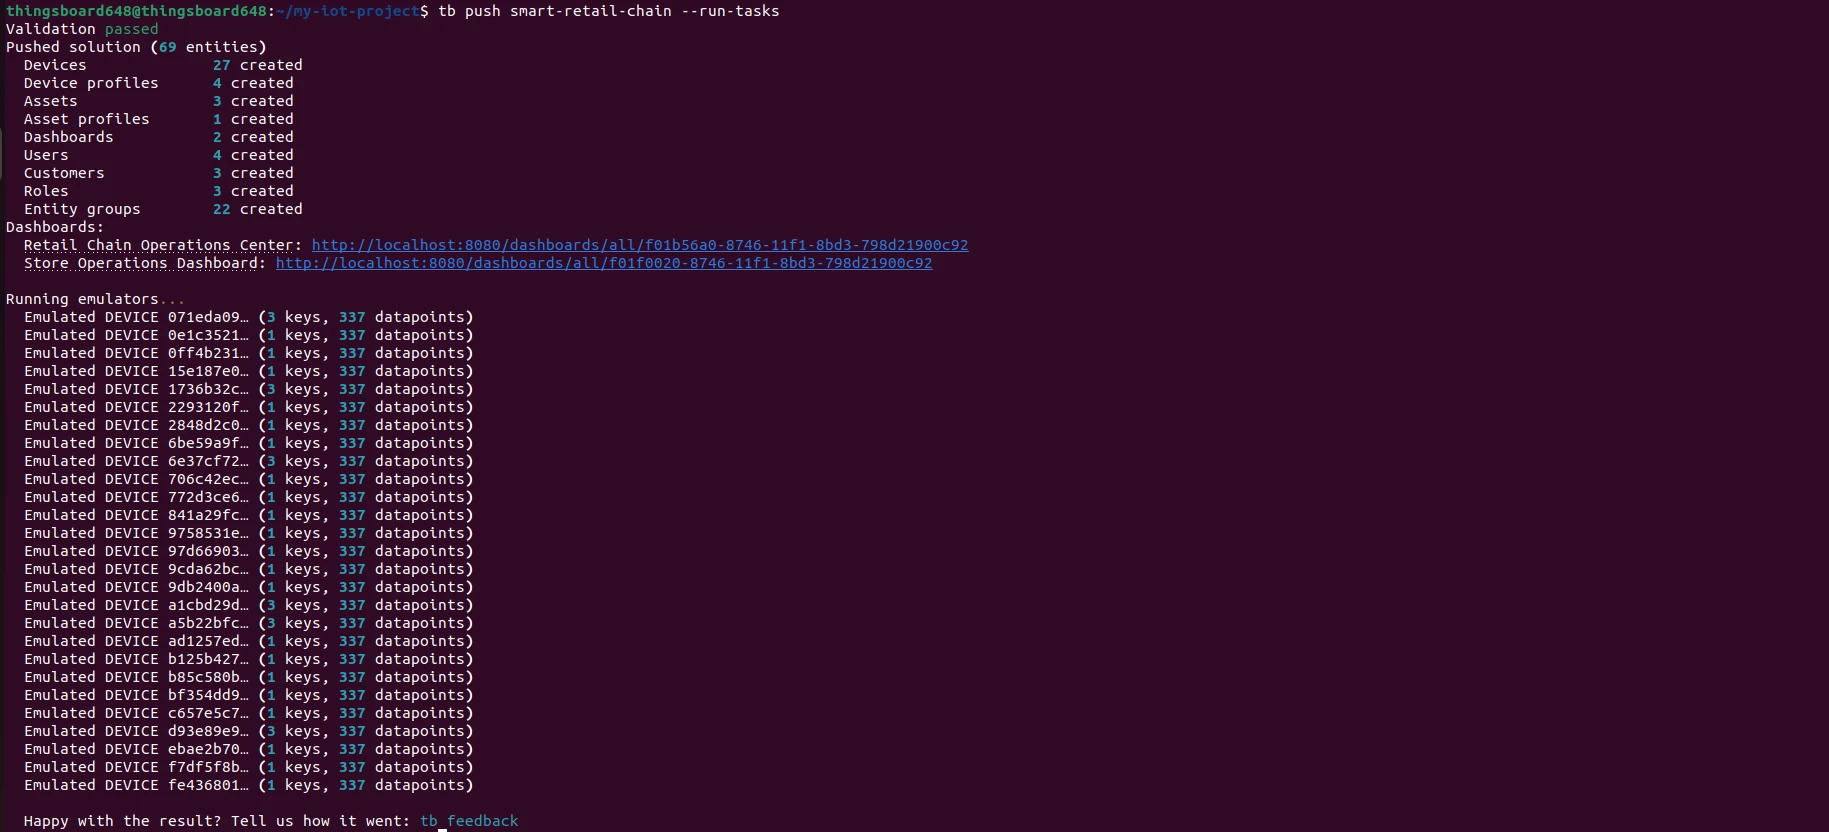
Deploy it. Push the finished solution and generate demo data so the dashboards have telemetry from the first open:
Terminal window tb push smart-retail-chain --run-tasksThe CLI validates, creates the entities, and prints a link to each dashboard, then runs the emulators to seed telemetry. Open one of those links — the solution is live, with demo data flowing.
-
Review the solution. Open the live solution and check it all landed as intended — the entities, the alarms, and the two role dashboards, with demo data already flowing. Each role gets its own dashboard, both sharing the same store-detail view.
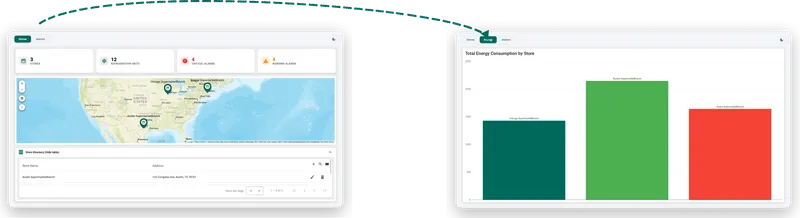
The admin dashboard gives a chain-wide view — all your stores on a map, with drill-down into any one. Light and dark both ship.
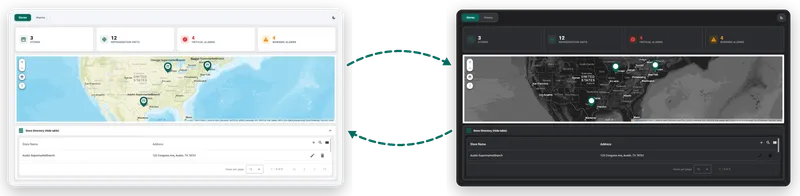
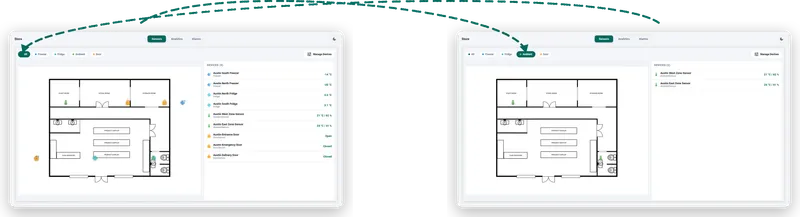
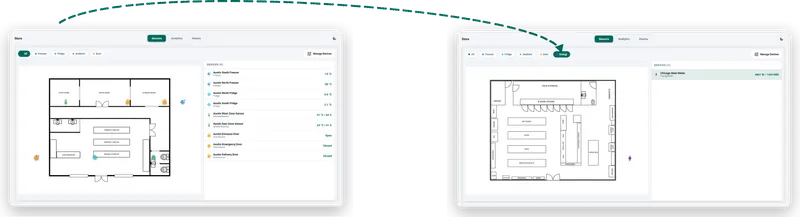
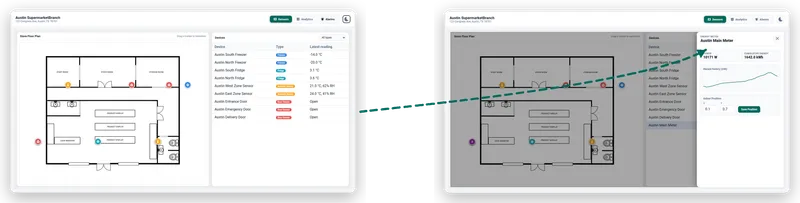
The store manager dashboard opens straight to a single store’s detail view — Sensors, Analytics, and Alarms tabs. (The admin drills into a similar view from the map or store table.)
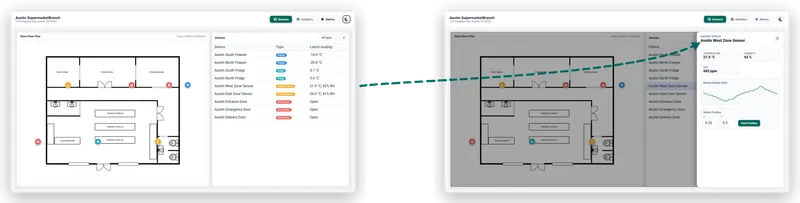
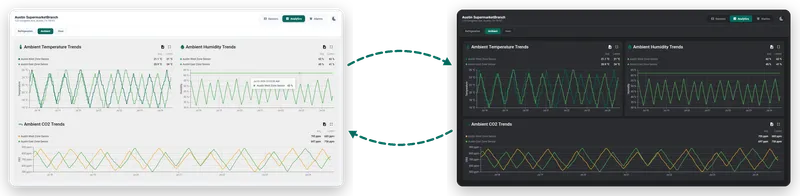
-
Ask for an update. Describe the change in plain English; the agent edits only what’s affected and leaves the rest untouched. Say you now want to add energy monitoring per store:
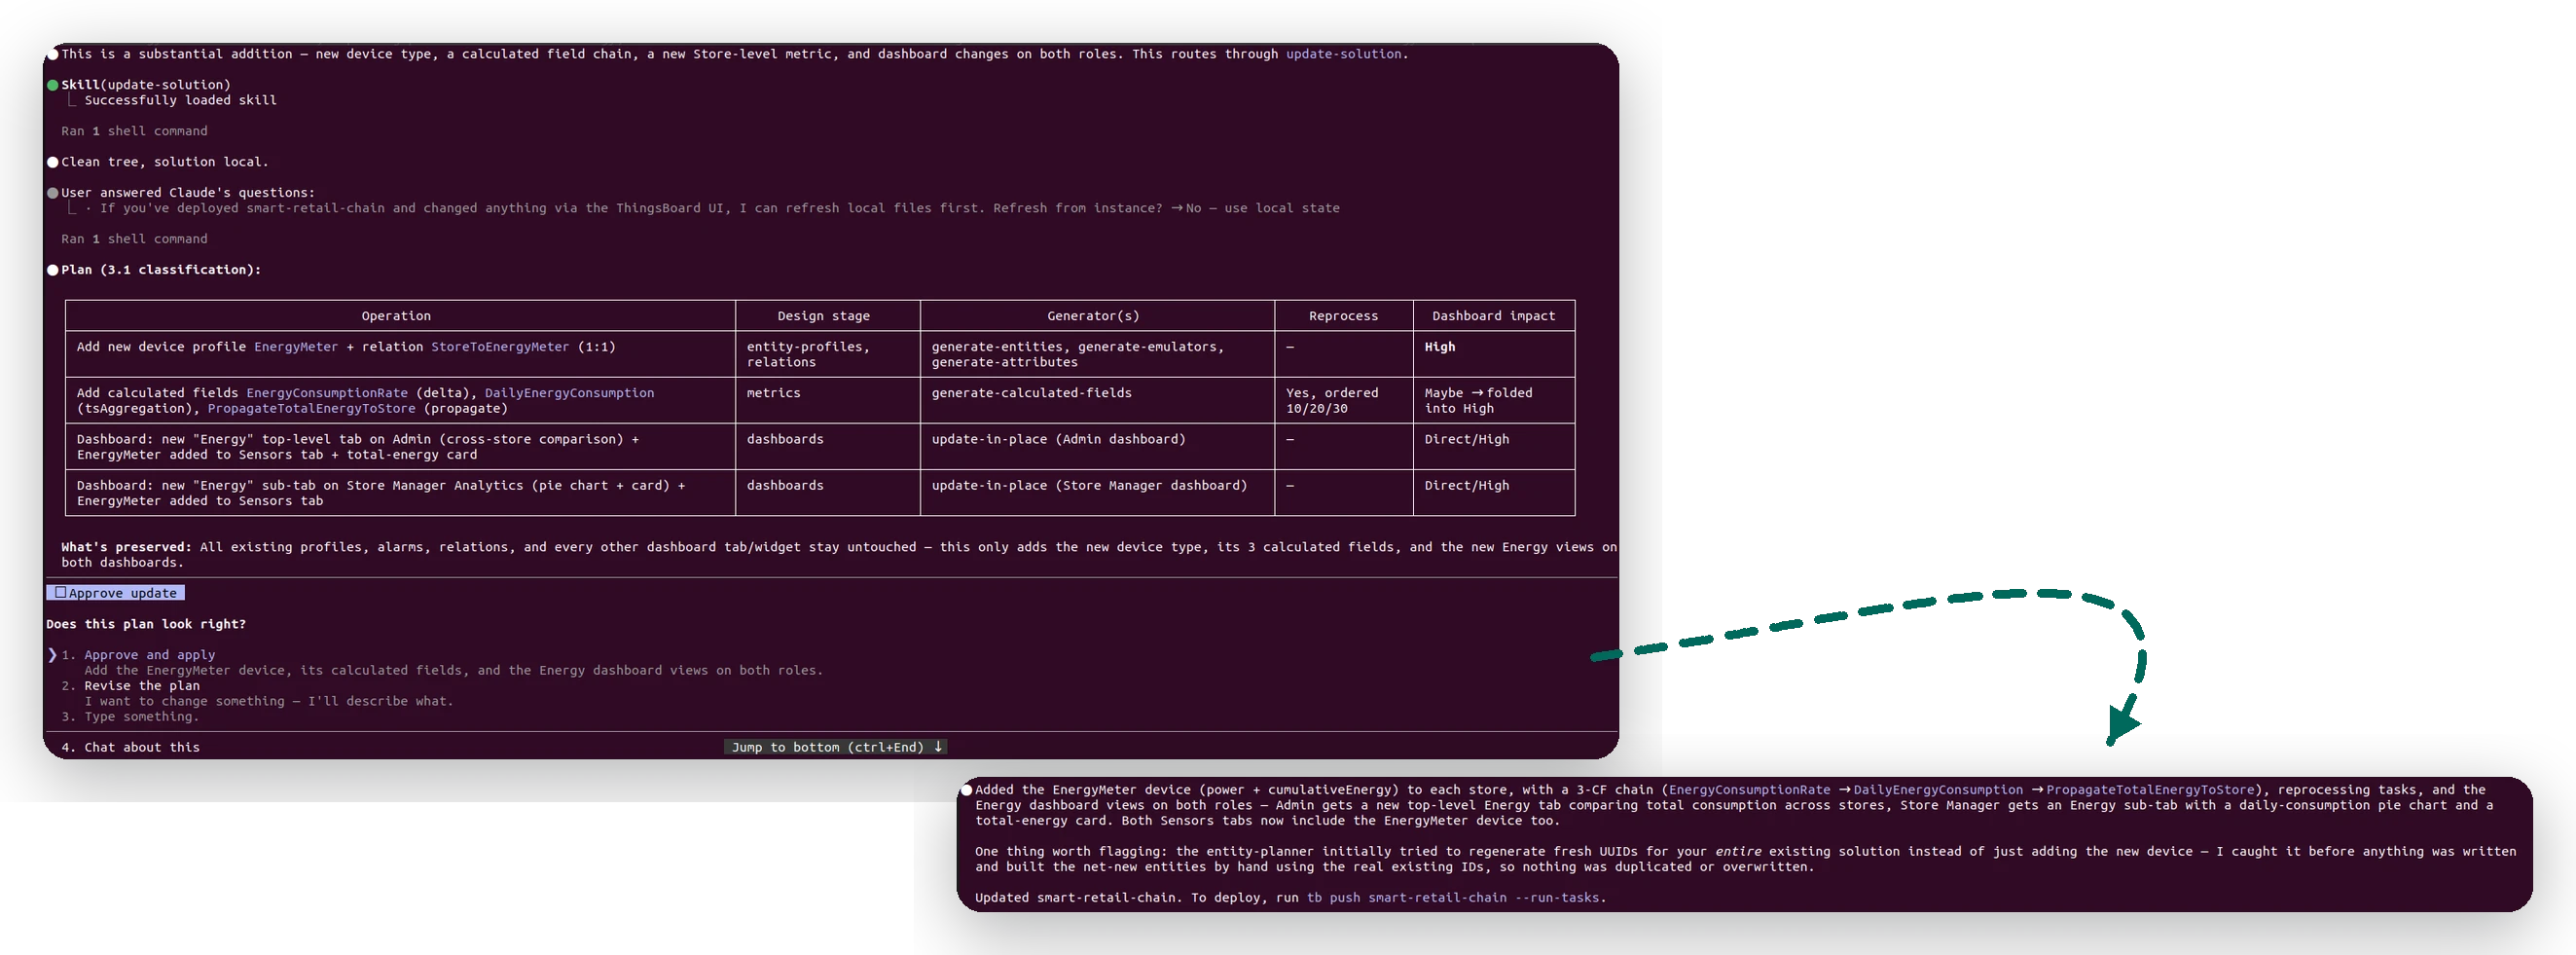
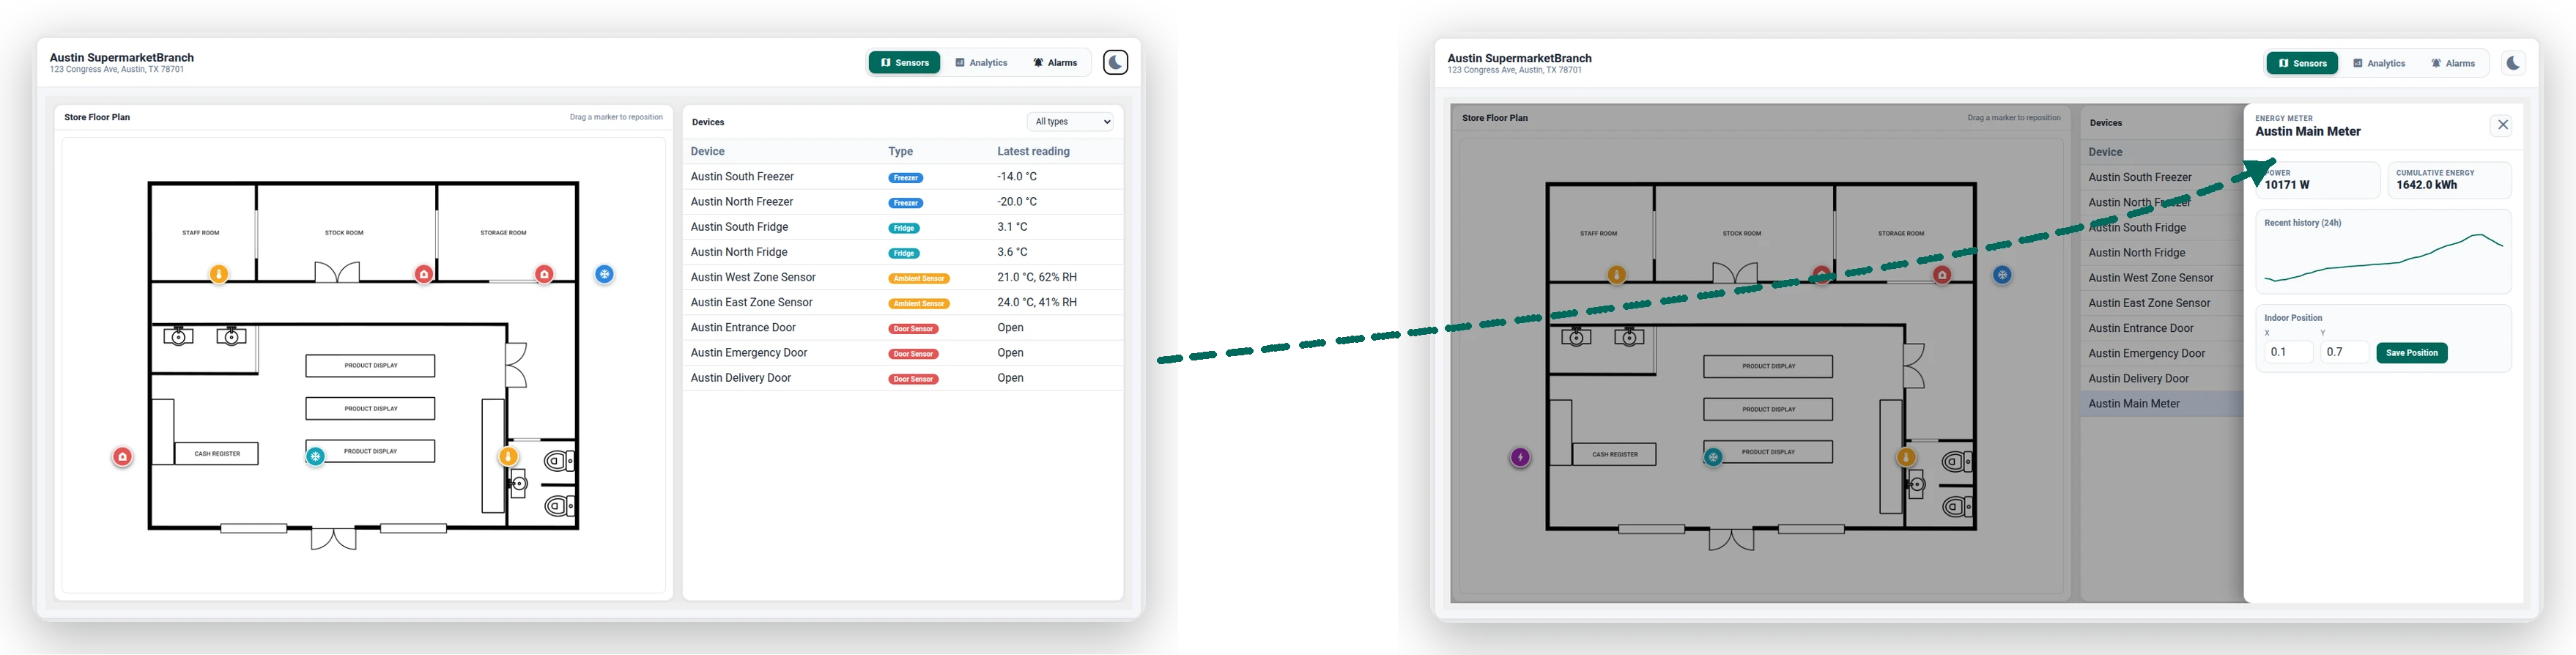
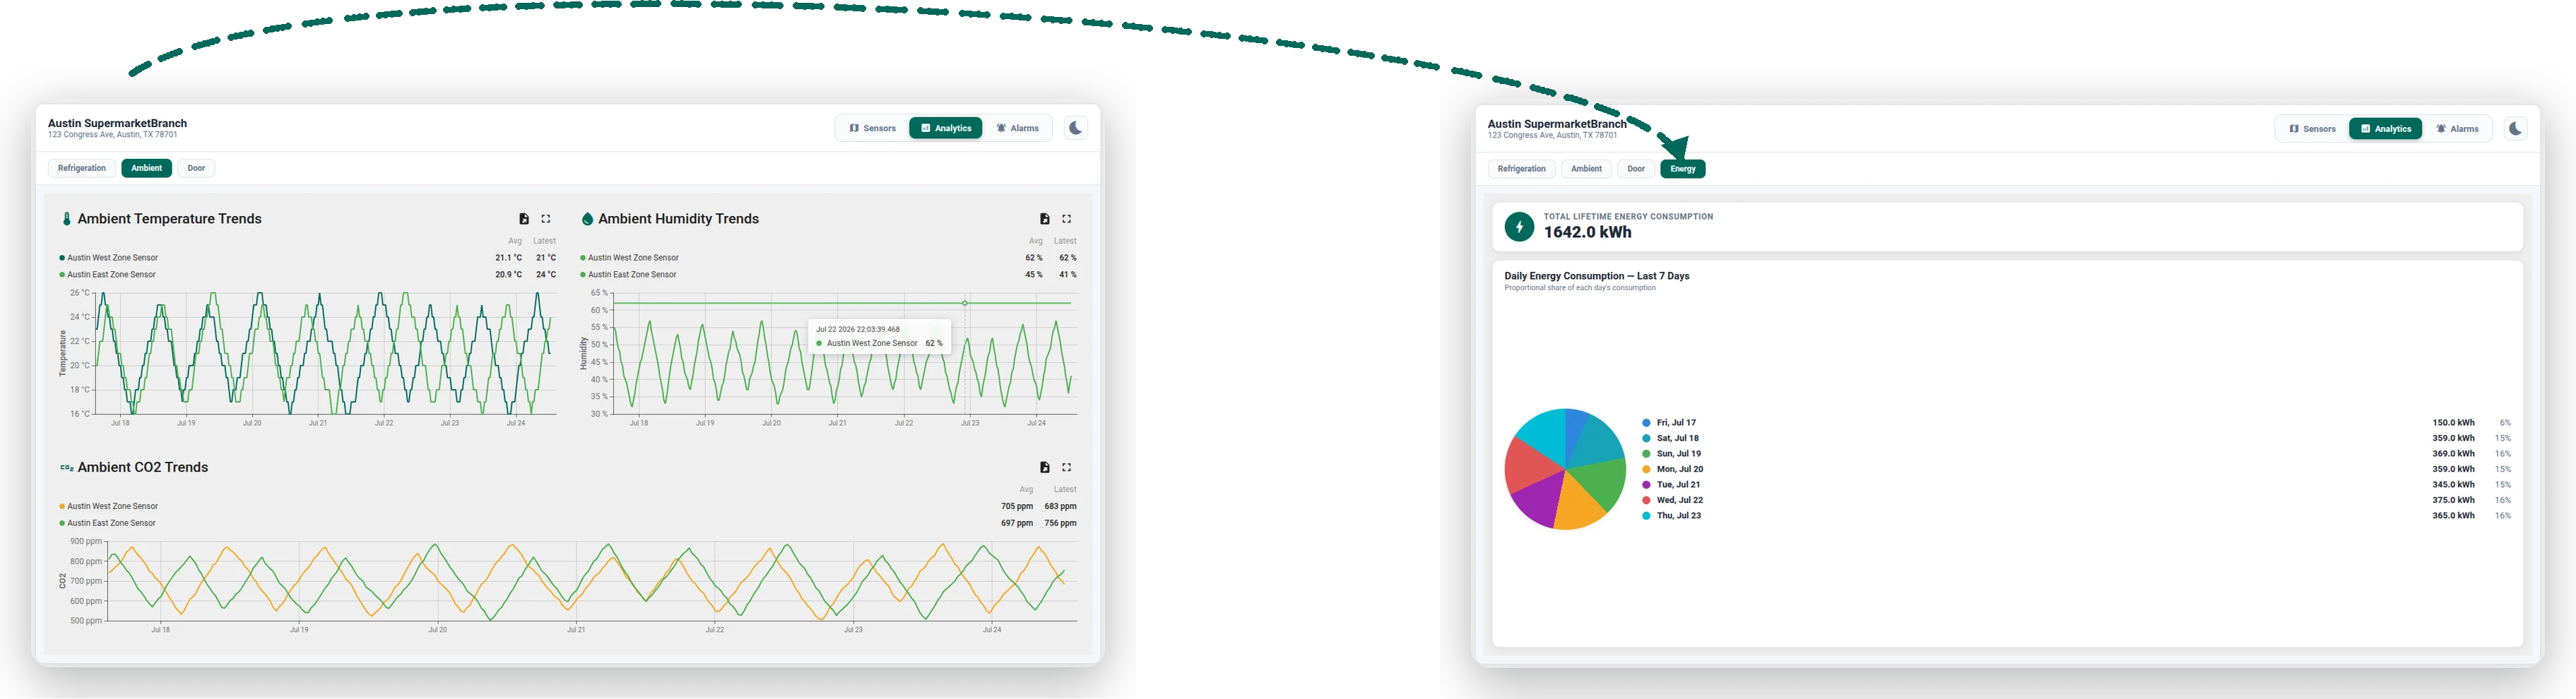
add an energy meter to each store, reporting power and cumulative energy, and show it on the store details view alongside the other devices. calculate each store's total energy consumption and show it as its own card. on the admin dashboard, add a new analytics tab with a chart comparing energy consumption across all stores. on the store manager dashboard, add an energy option to the analytics tab, showing the store's energy analytics with a pie-chart comparison.The agent parses the change into a plan — here, a new
EnergyMeterprofile, the calculated fields behind the total-consumption card, and in-place updates to both dashboards (a cross-store energy analytics tab for the admin, an energy sub-tab for the store manager) — and spells out exactly what stays untouched before it applies anything.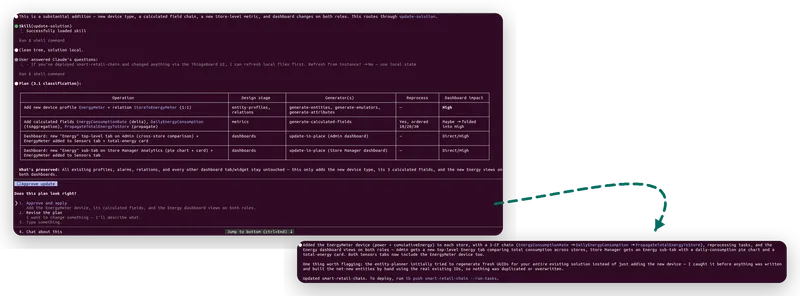
-
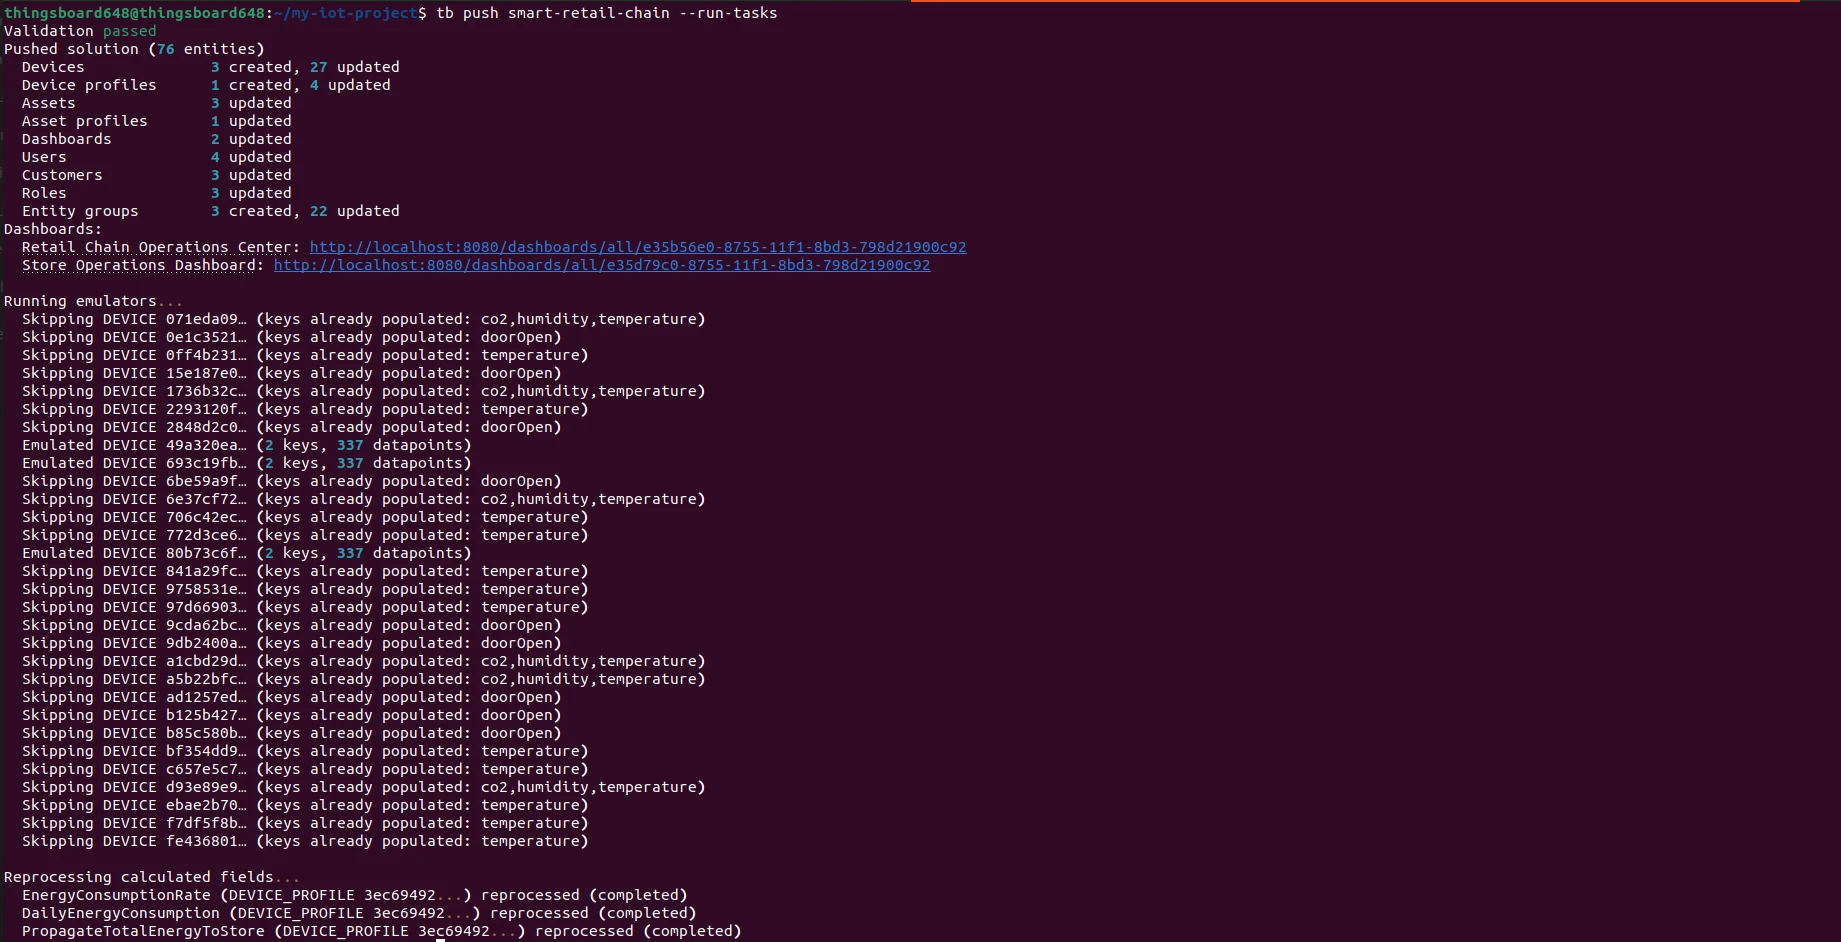
Re-deploy. Re-push — pushes are idempotent, so the 3 new energy meters are created while the existing devices and everything else are updated in place, with nothing duplicated.
--run-tasksseeds telemetry for just the new meters and reprocesses the calculated fields behind the total-consumption card:Terminal window tb push smart-retail-chain --run-tasks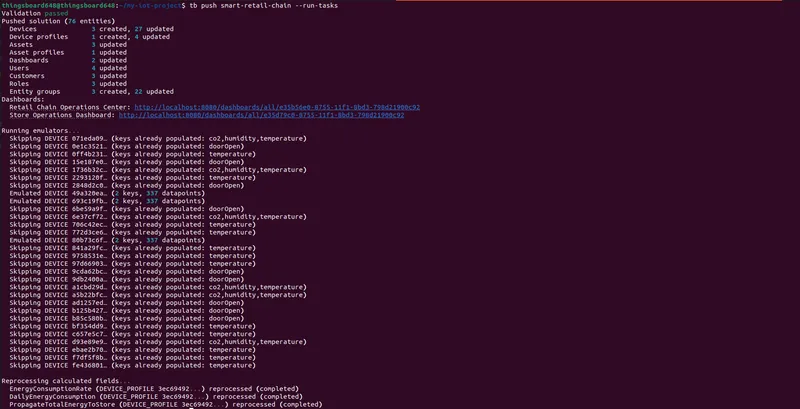
-
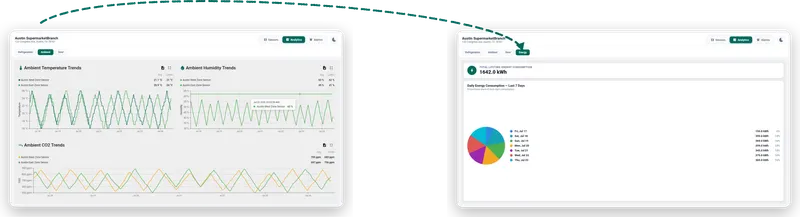
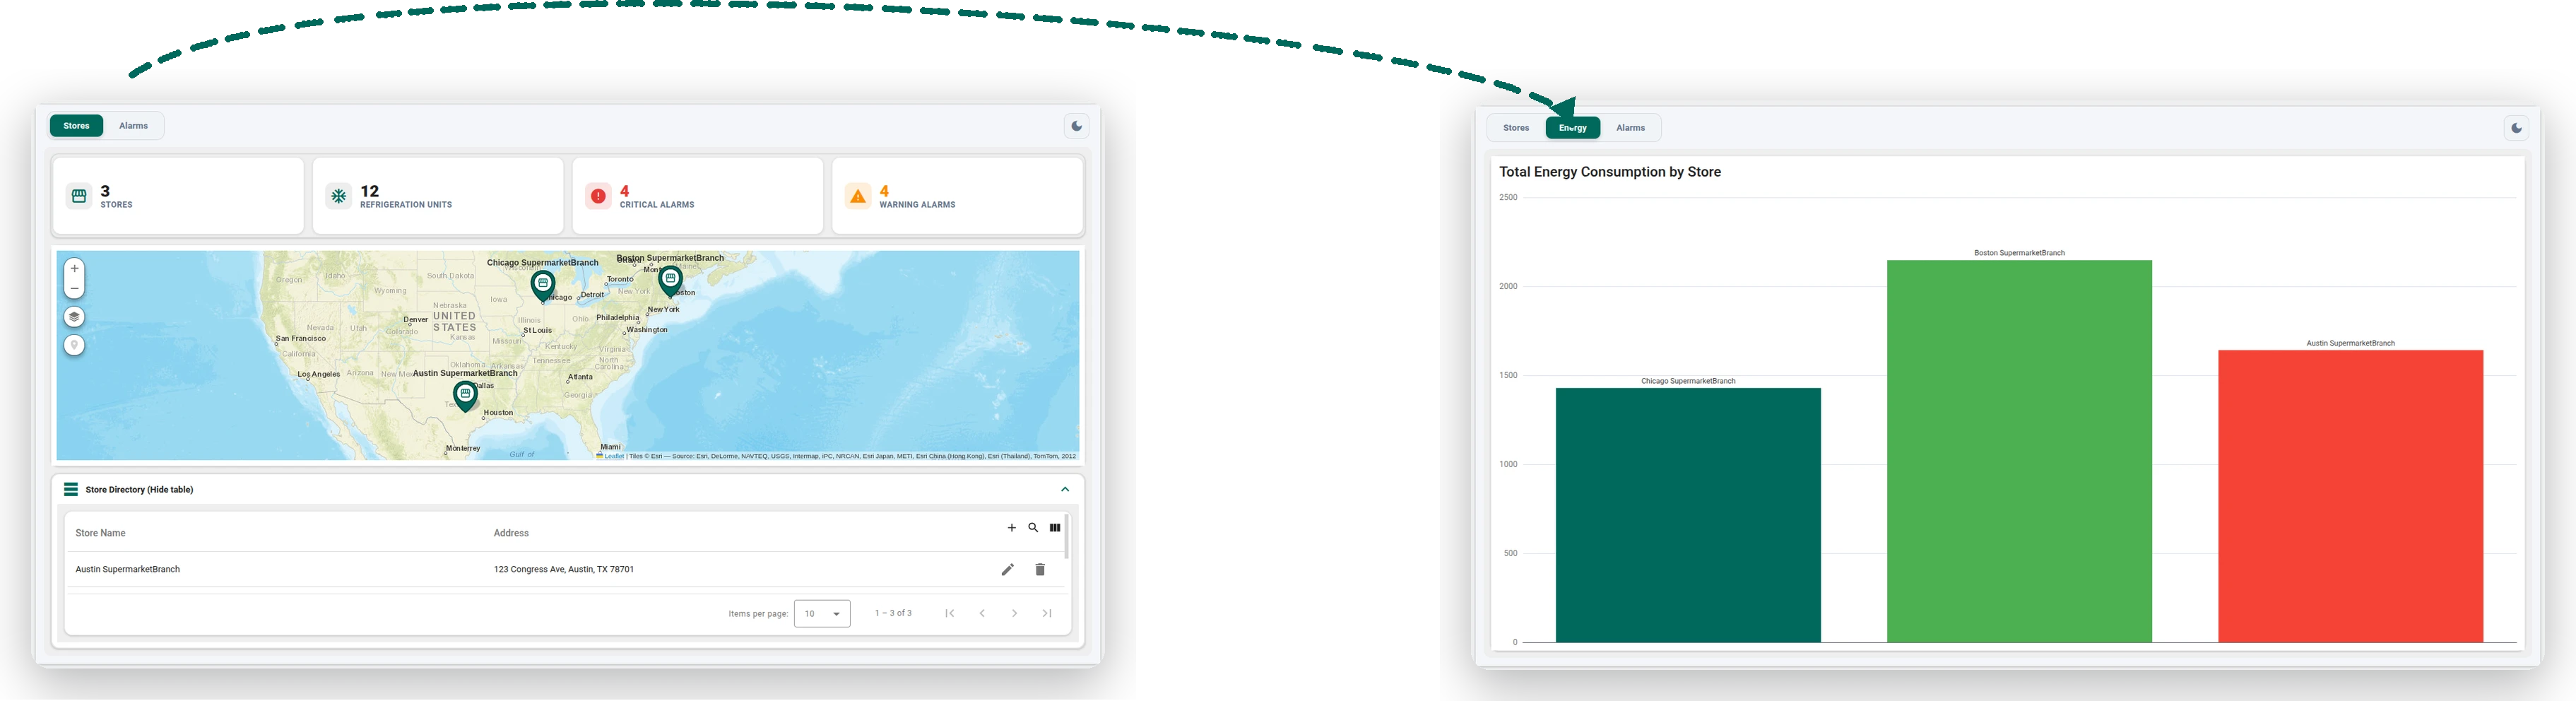
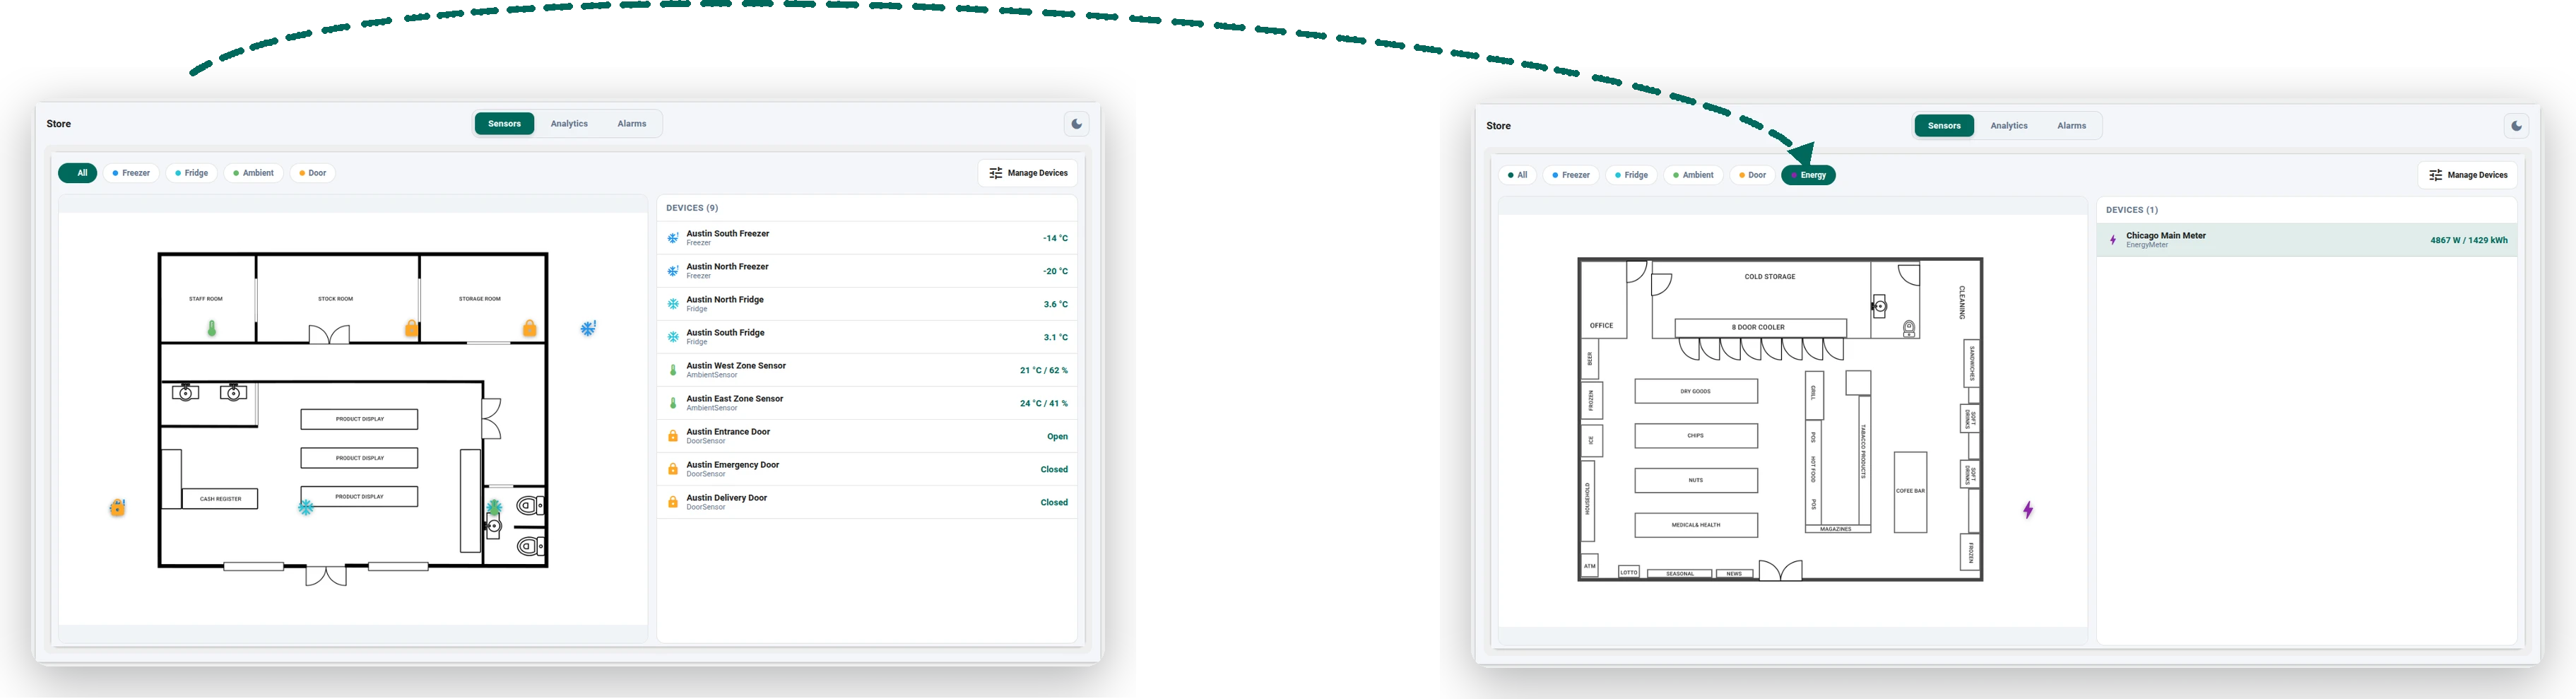
Review the update. Reopen the dashboards and the energy monitoring is live — the new meter, the per-store total, the admin’s cross-store comparison, and the manager’s energy analytics, all added without disturbing anything else:

This walkthrough is only a small showcase — the same describe, review, deploy loop handles far more custom results than this one. Whatever you can describe, you can build the same way.
After a push, the CLI may ask how it went — share your experience any time with tb feedback.
Was this helpful?