
Save Calculations to ThingsBoard
When a calculated field is enabled, Trendz automatically writes its results to ThingsBoard as telemetry under the key _ECD_{KEY}. This makes calculated metrics available anywhere ThingsBoard supports telemetry — dashboards, alarm rules, rule chains, predictions, and further calculations.
Disabling a calculation field stops new writes but never deletes existing telemetry already stored in ThingsBoard.
Trendz calculated field │ │ writes telemetry (_ECD_yourKey) ▼ ThingsBoard entity │ ┌───────┴────────────────────────────────┐ │ │ ▼ ▼Alarm Rules Dashboards / Rule Engine /(threshold alerts) Predictions / Anomaly modelsTwo jobs control when data is written:
| Job | When it runs | Purpose |
|---|---|---|
| Reprocess | Once, on demand | Backfill historical data for the selected time range |
| Refresh | Scheduled (recurring) | Keep telemetry up to date at a defined frequency |
Saving a calculation field
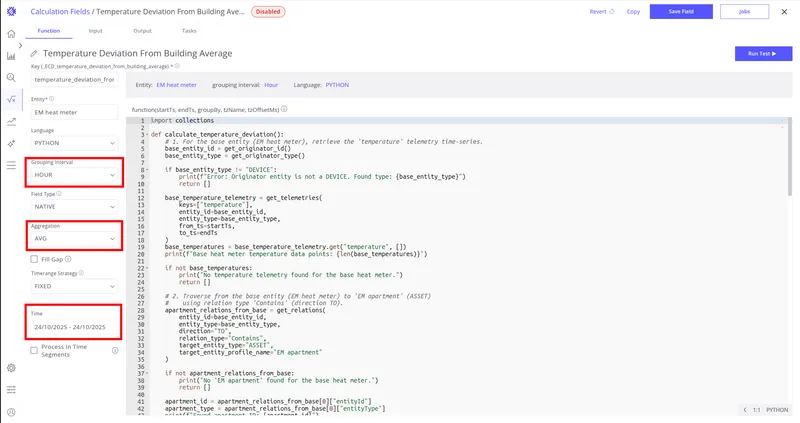
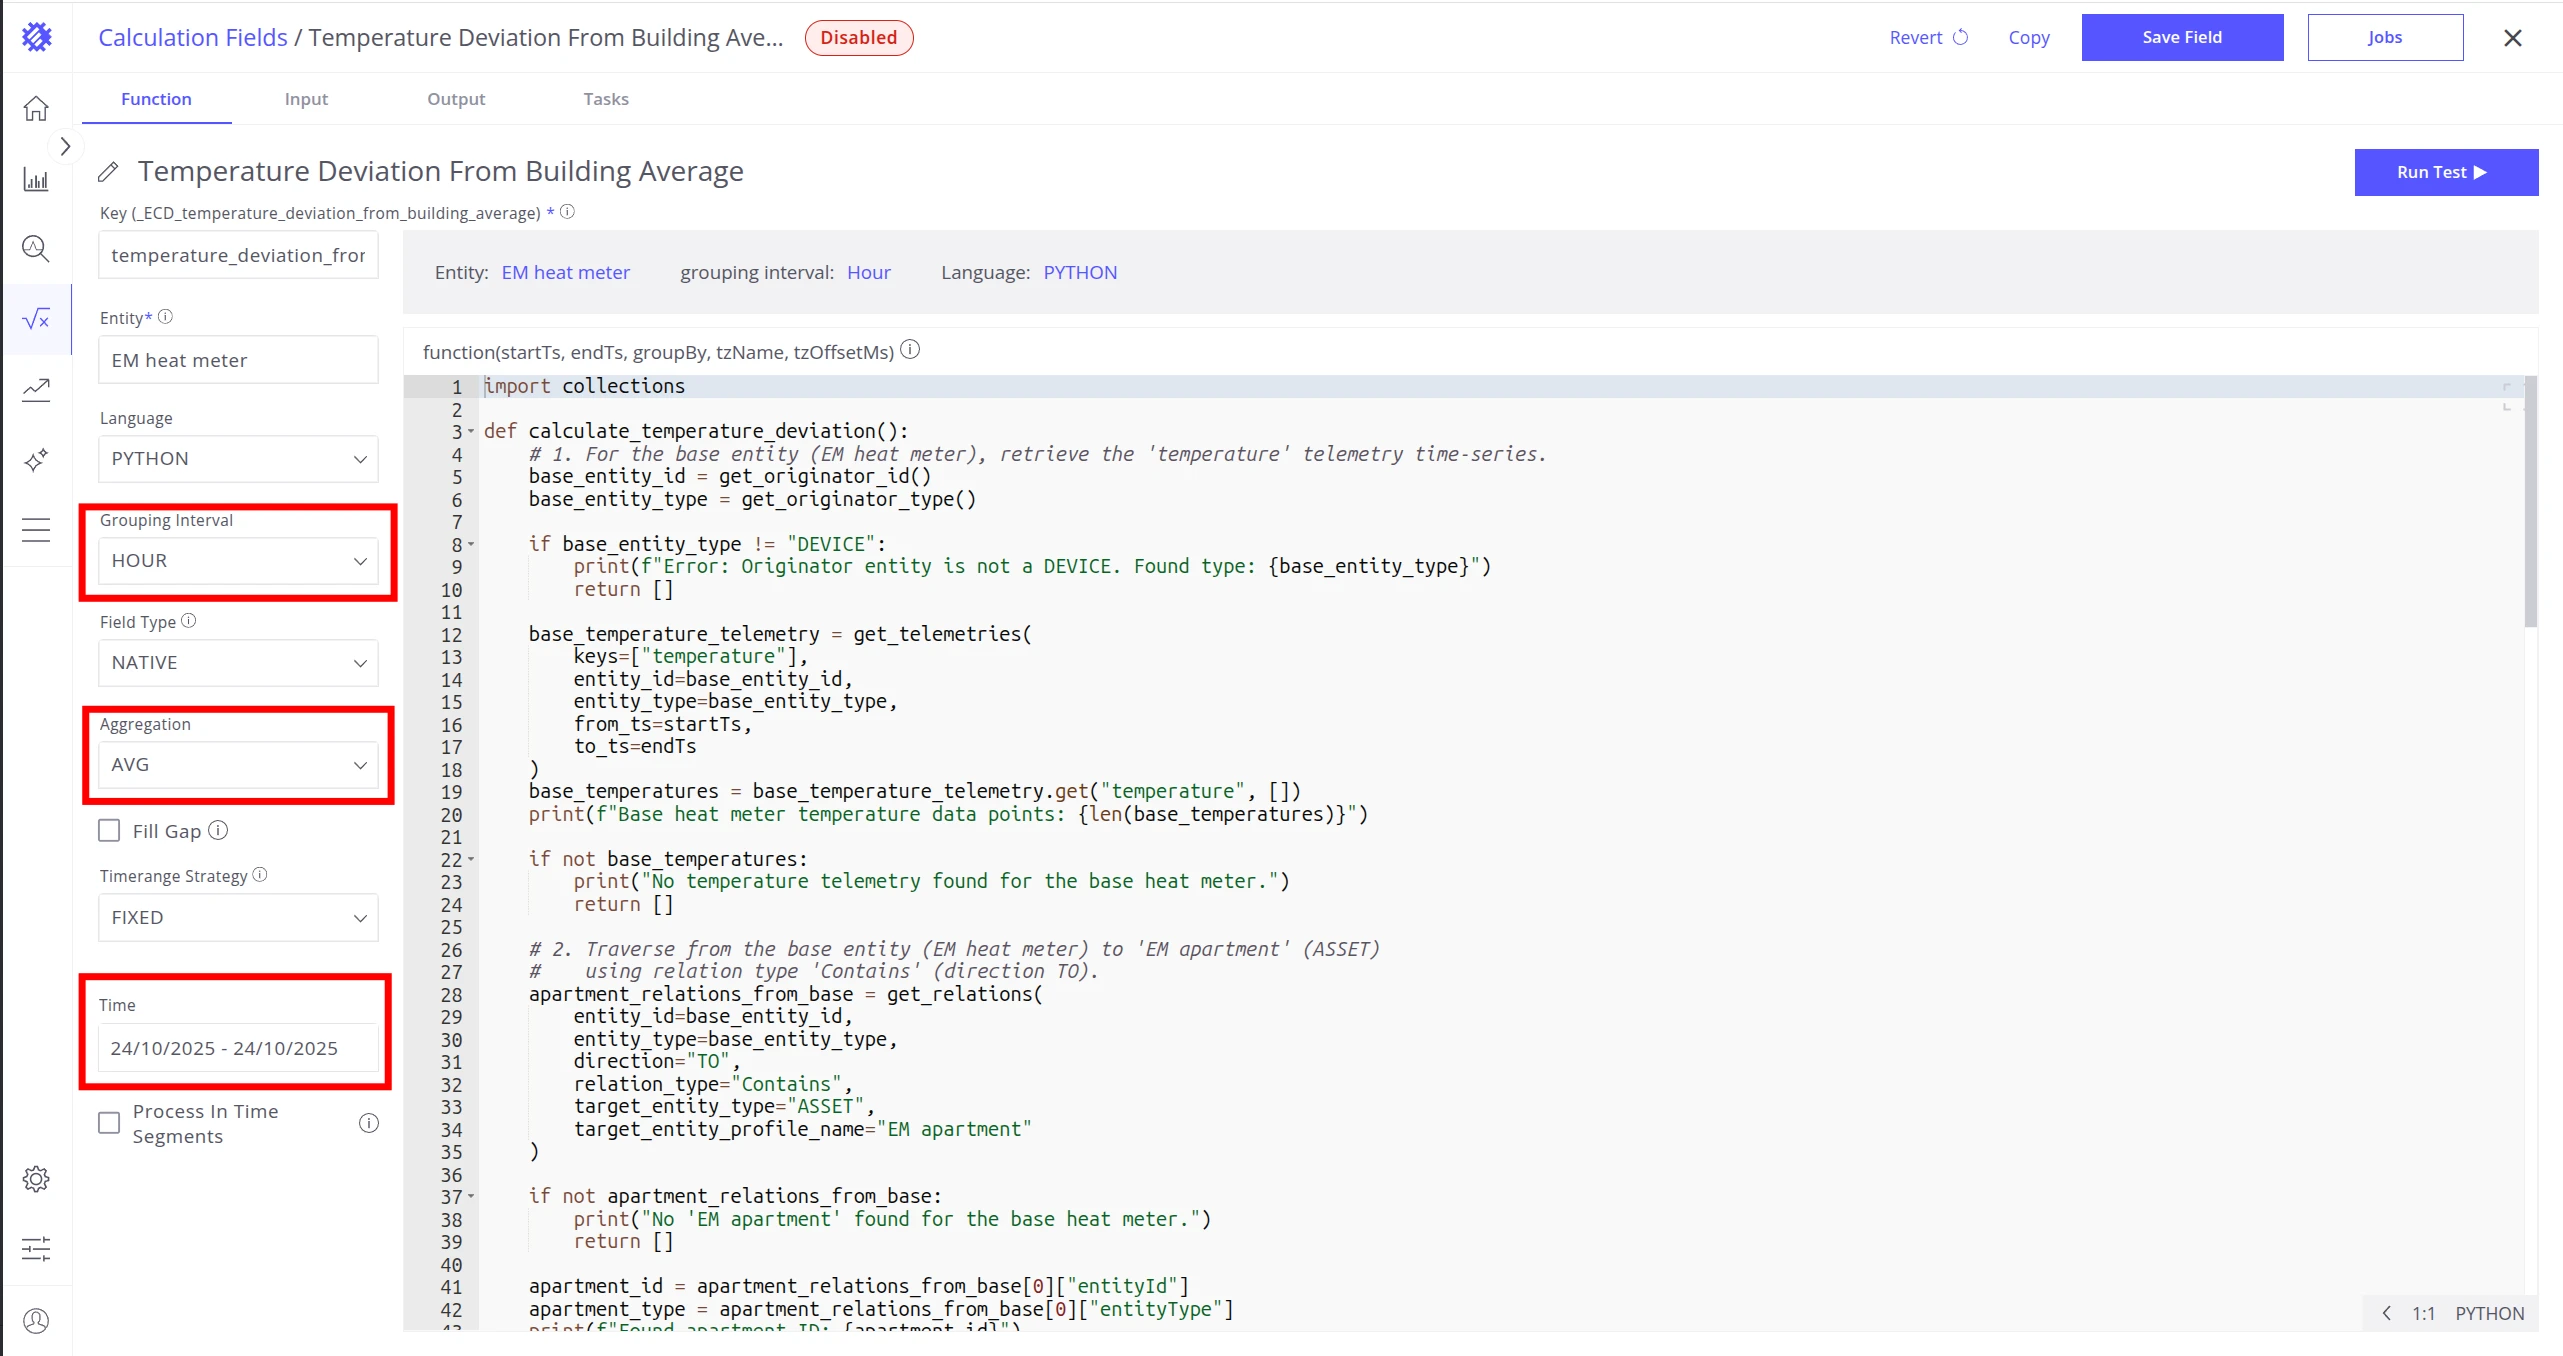
Section titled “Saving a calculation field”Before enabling a calculation, verify the key parameters that determine how data will appear in ThingsBoard:
| Parameter | Description |
|---|---|
| Grouping Interval | Time bucket size — e.g. HOUR stores one point per hour in ThingsBoard. |
| Aggregation | How values within a bucket are combined — e.g. SUM totals all readings in the hour. |
| Time | Time range used by the refresh job. Choose a range that covers what each refresh cycle needs to process. |
Recommended time settings by job frequency:
| Frequency | Recommended time range |
|---|---|
| Minute / Hour | Today |
| Day | Last 7 days |
| Week | Last 14 days |
| Month | Last 3 months |
-
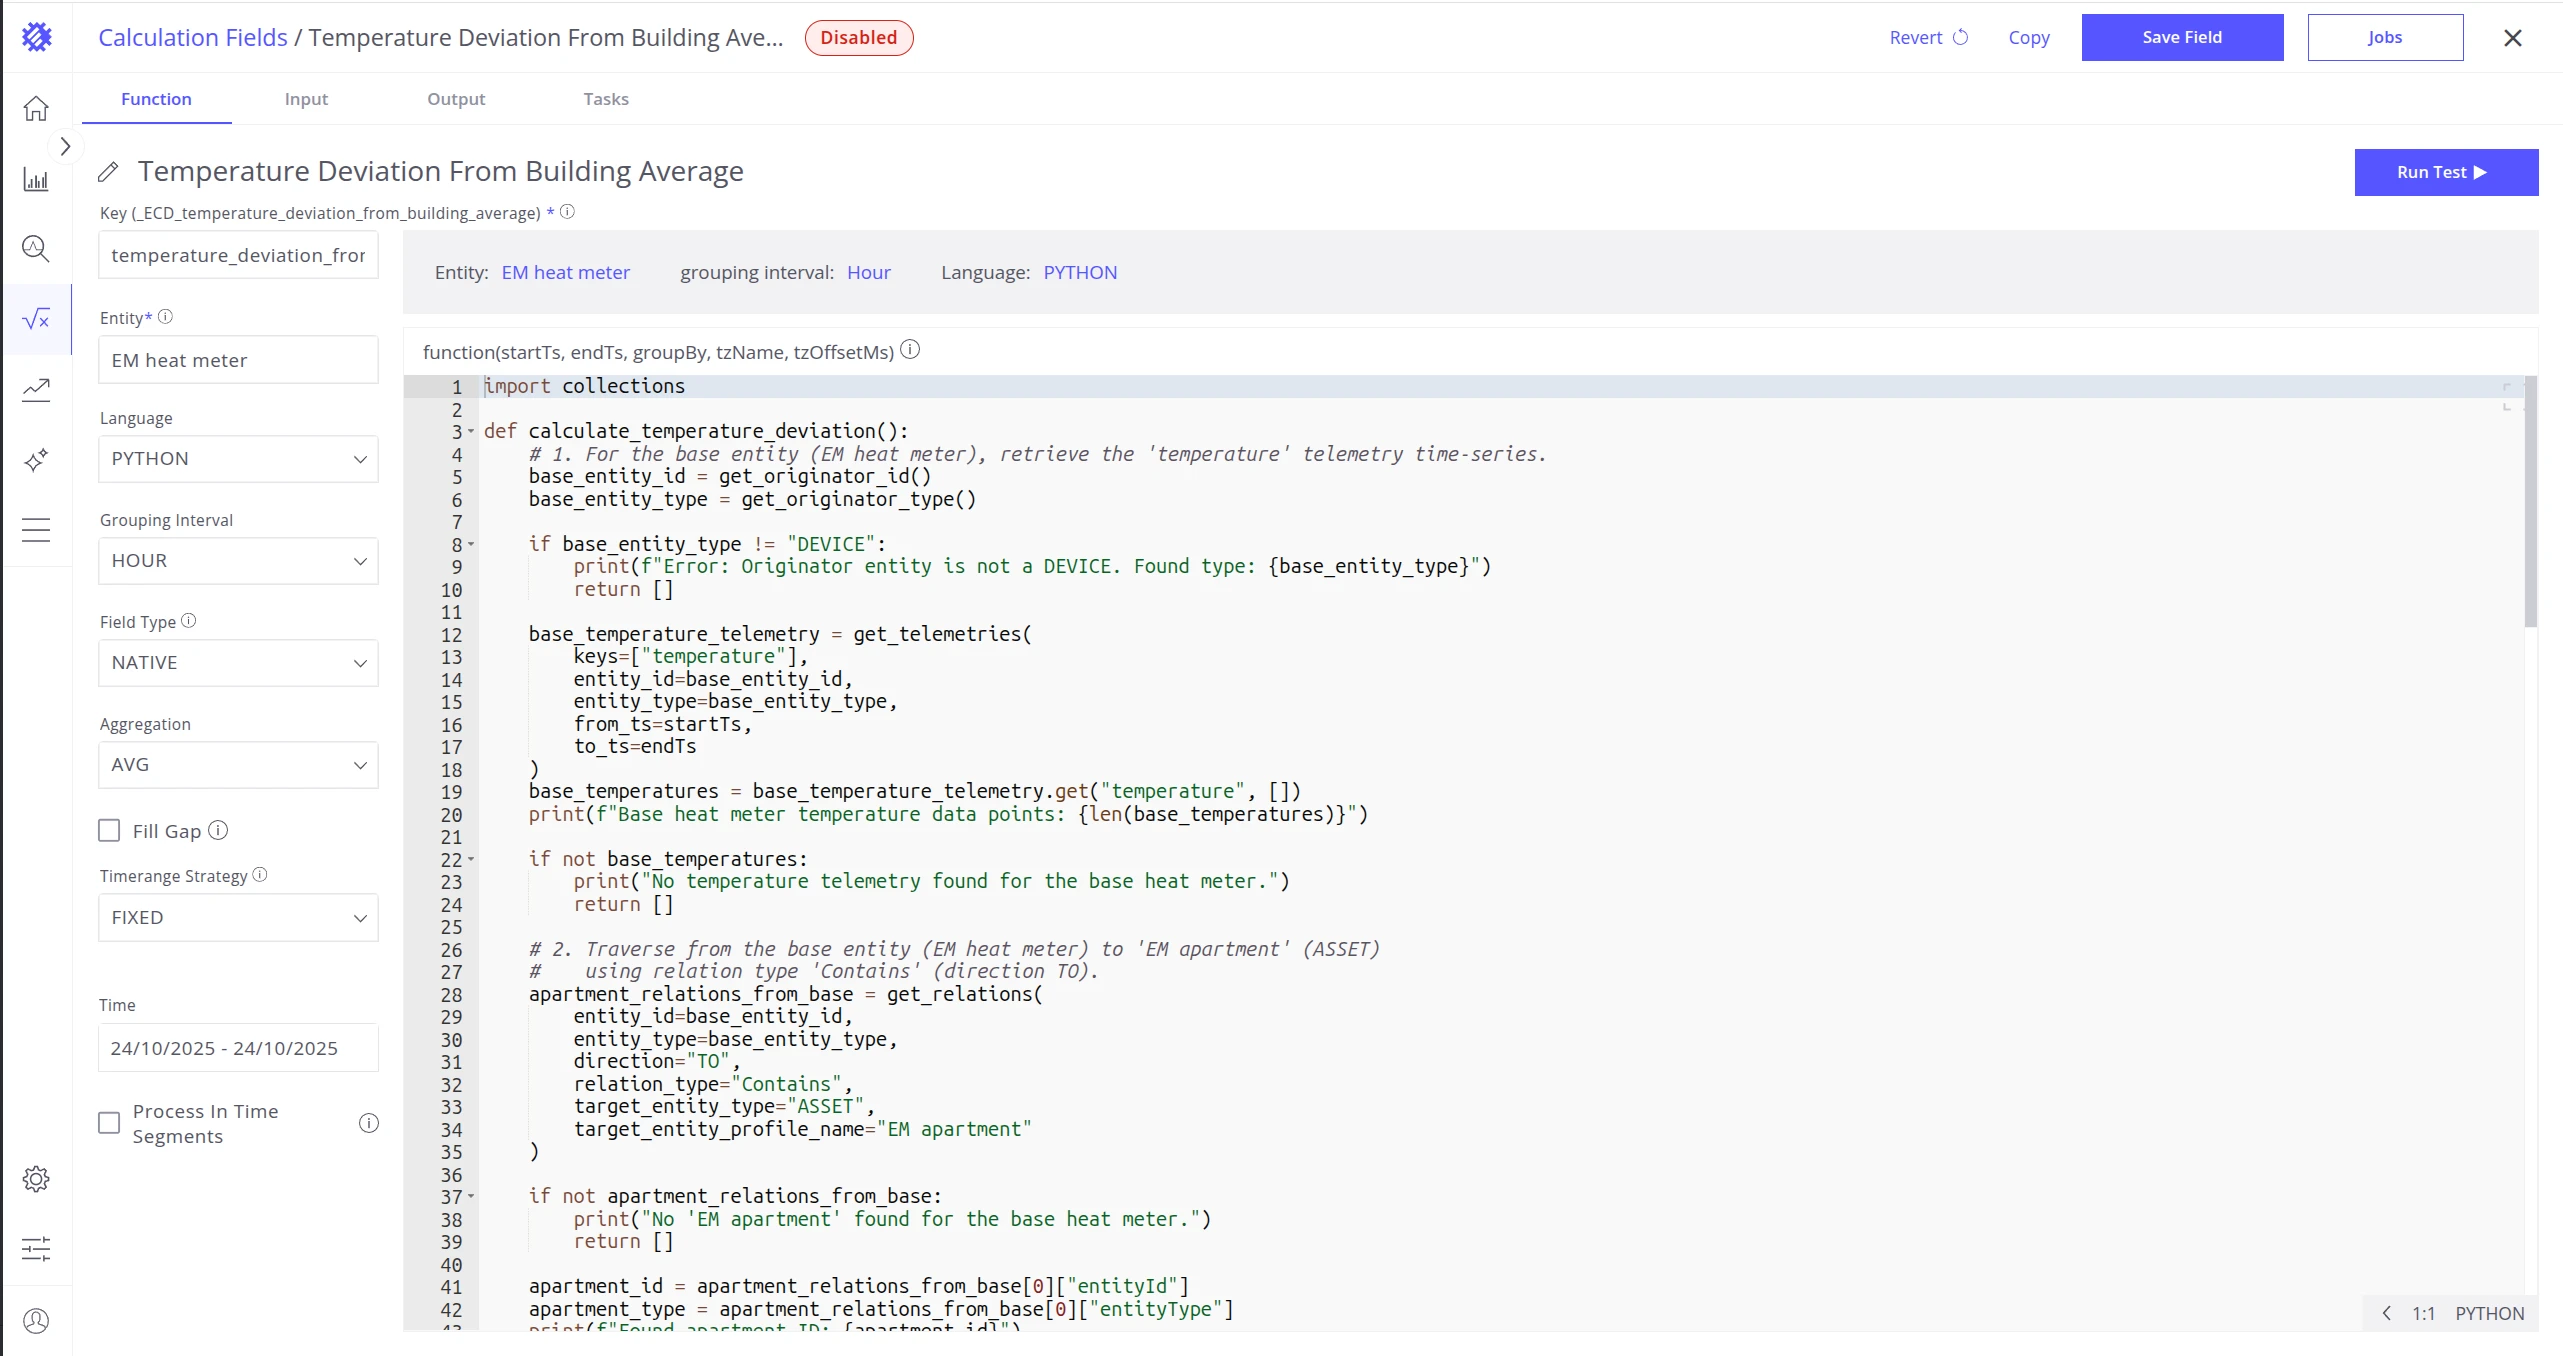
Open the calculation field and verify Grouping Interval, Aggregation, and Time.
-
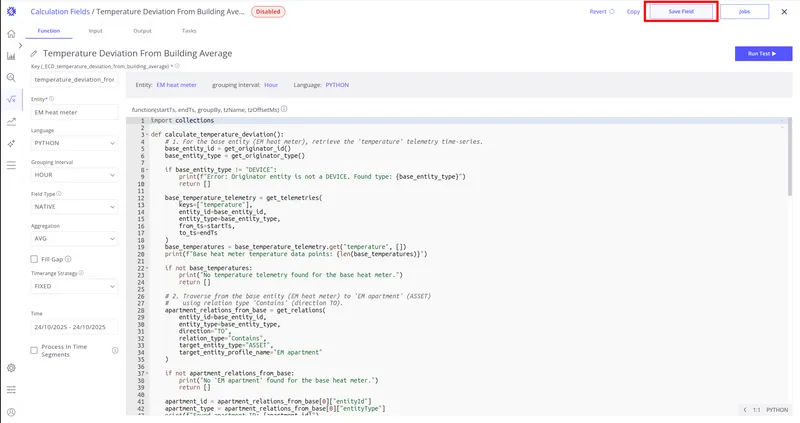
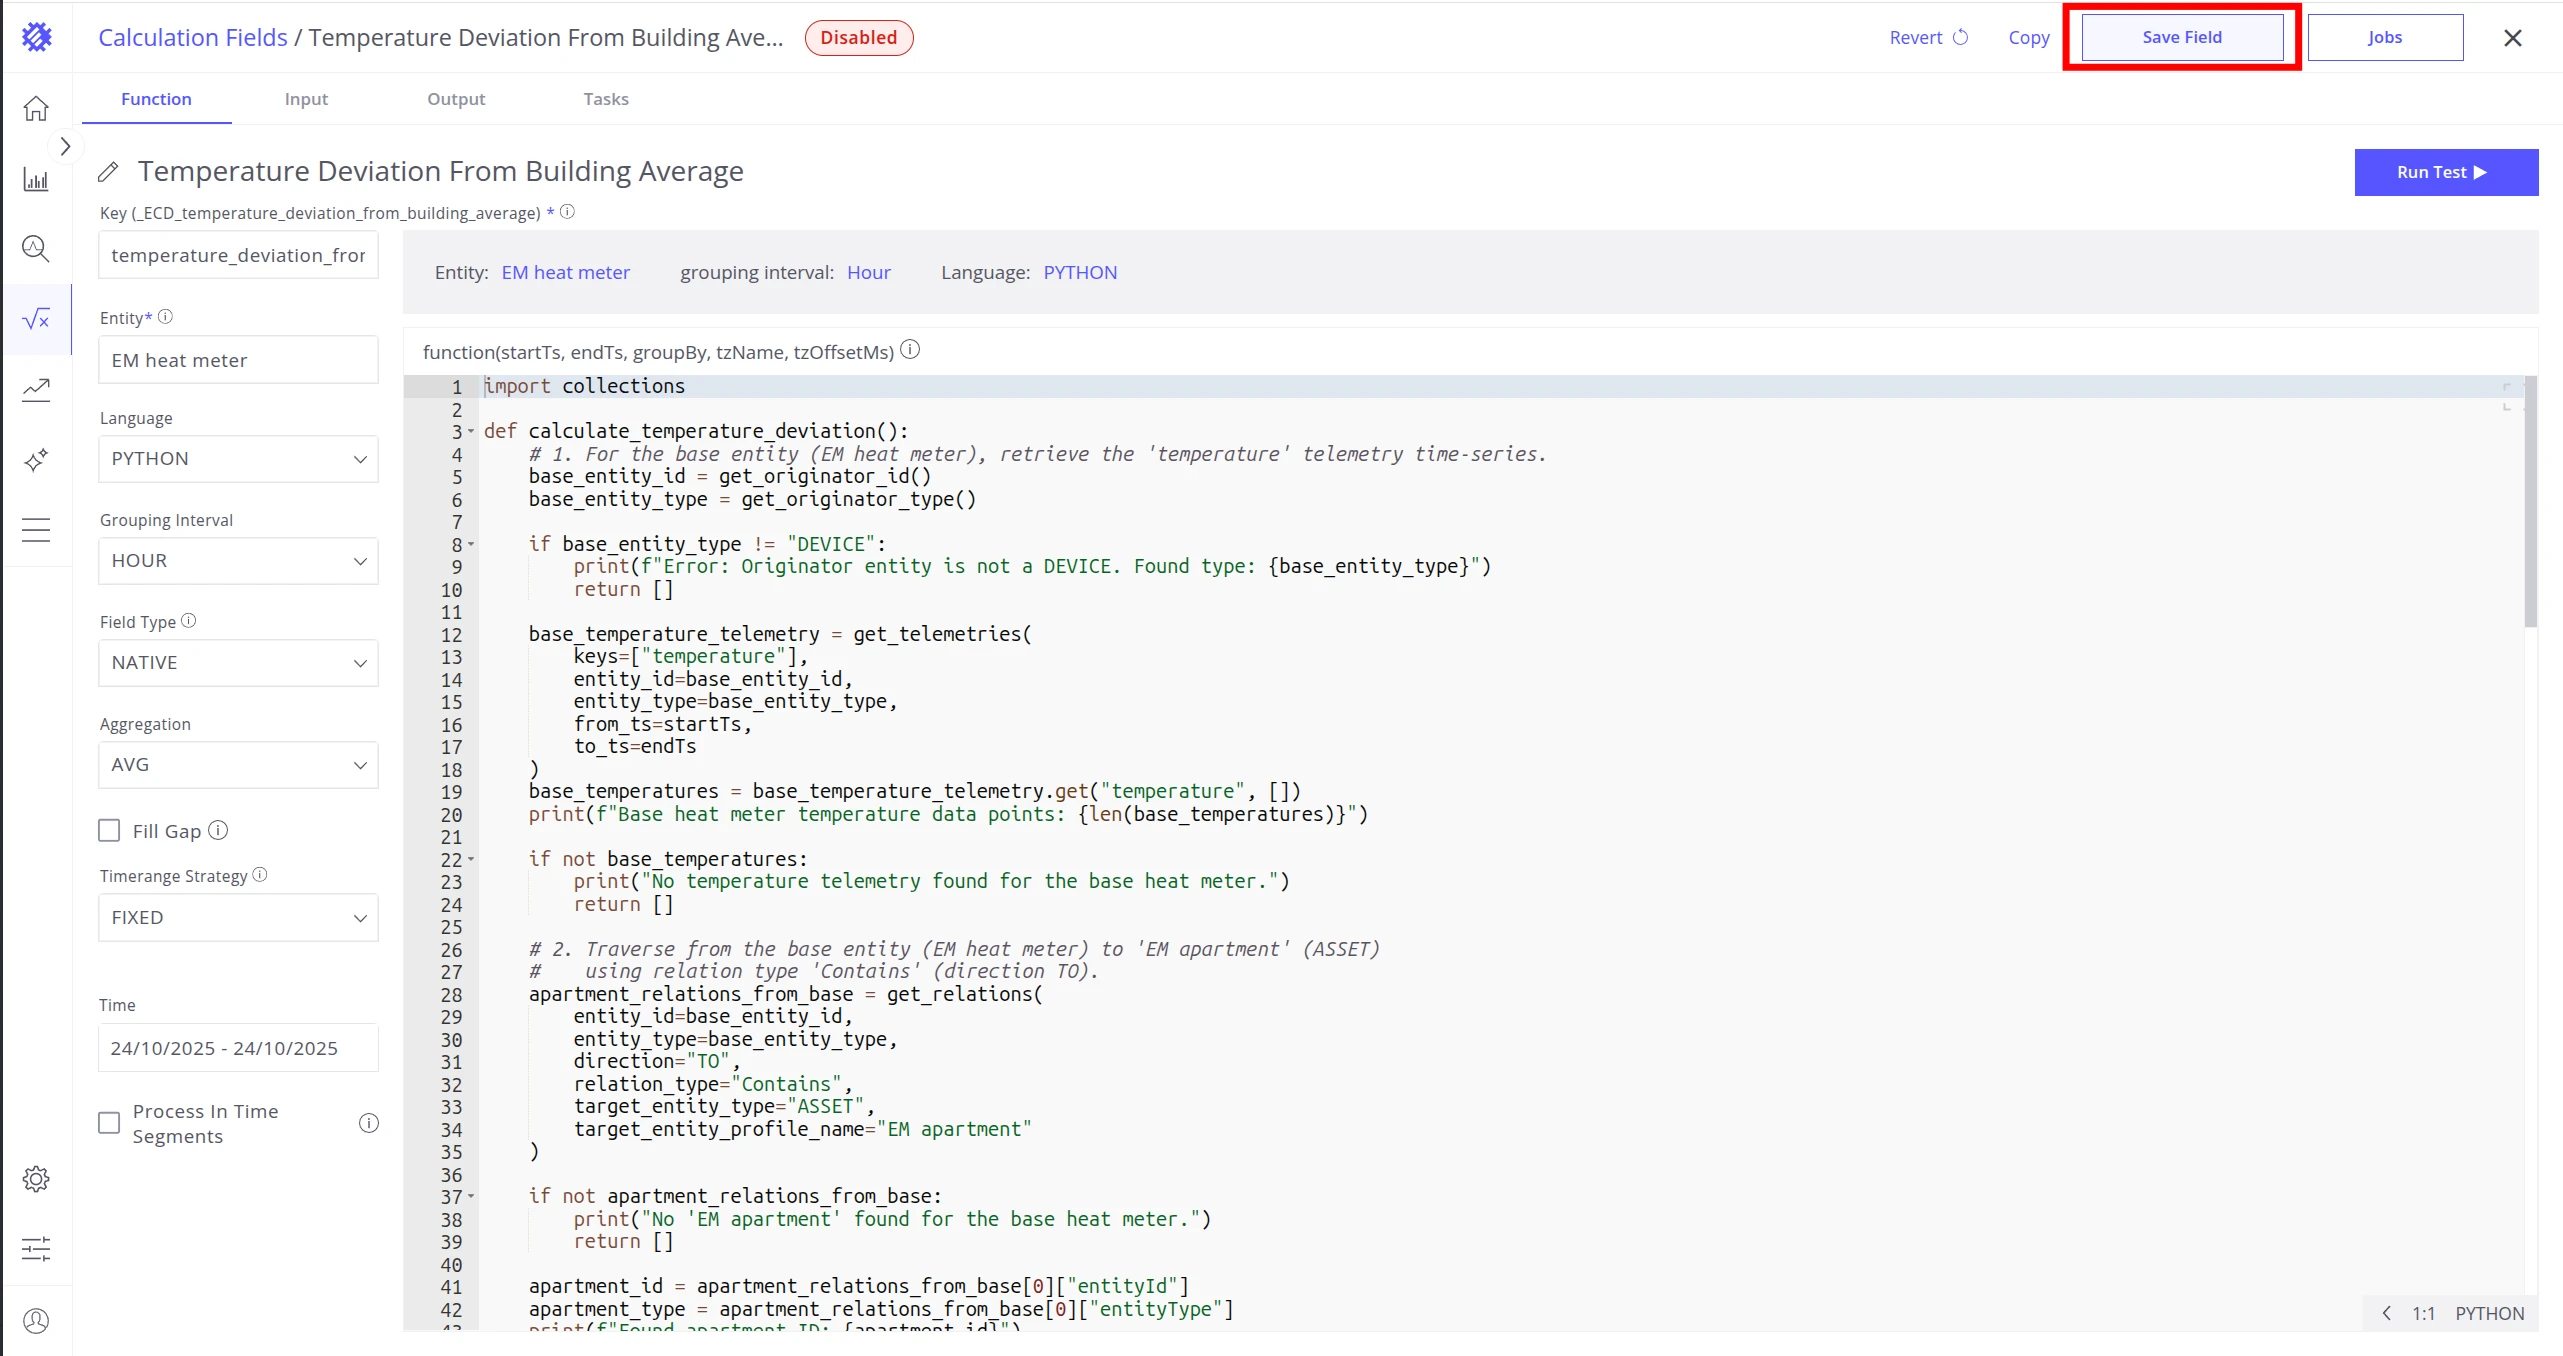
Click Save Field to apply changes.
-
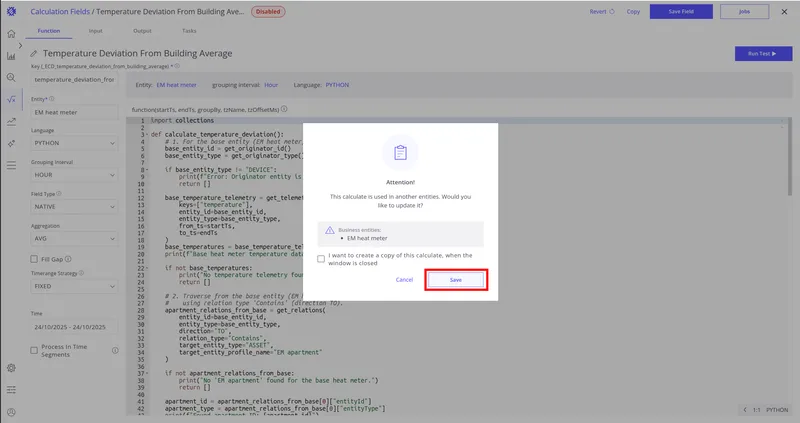
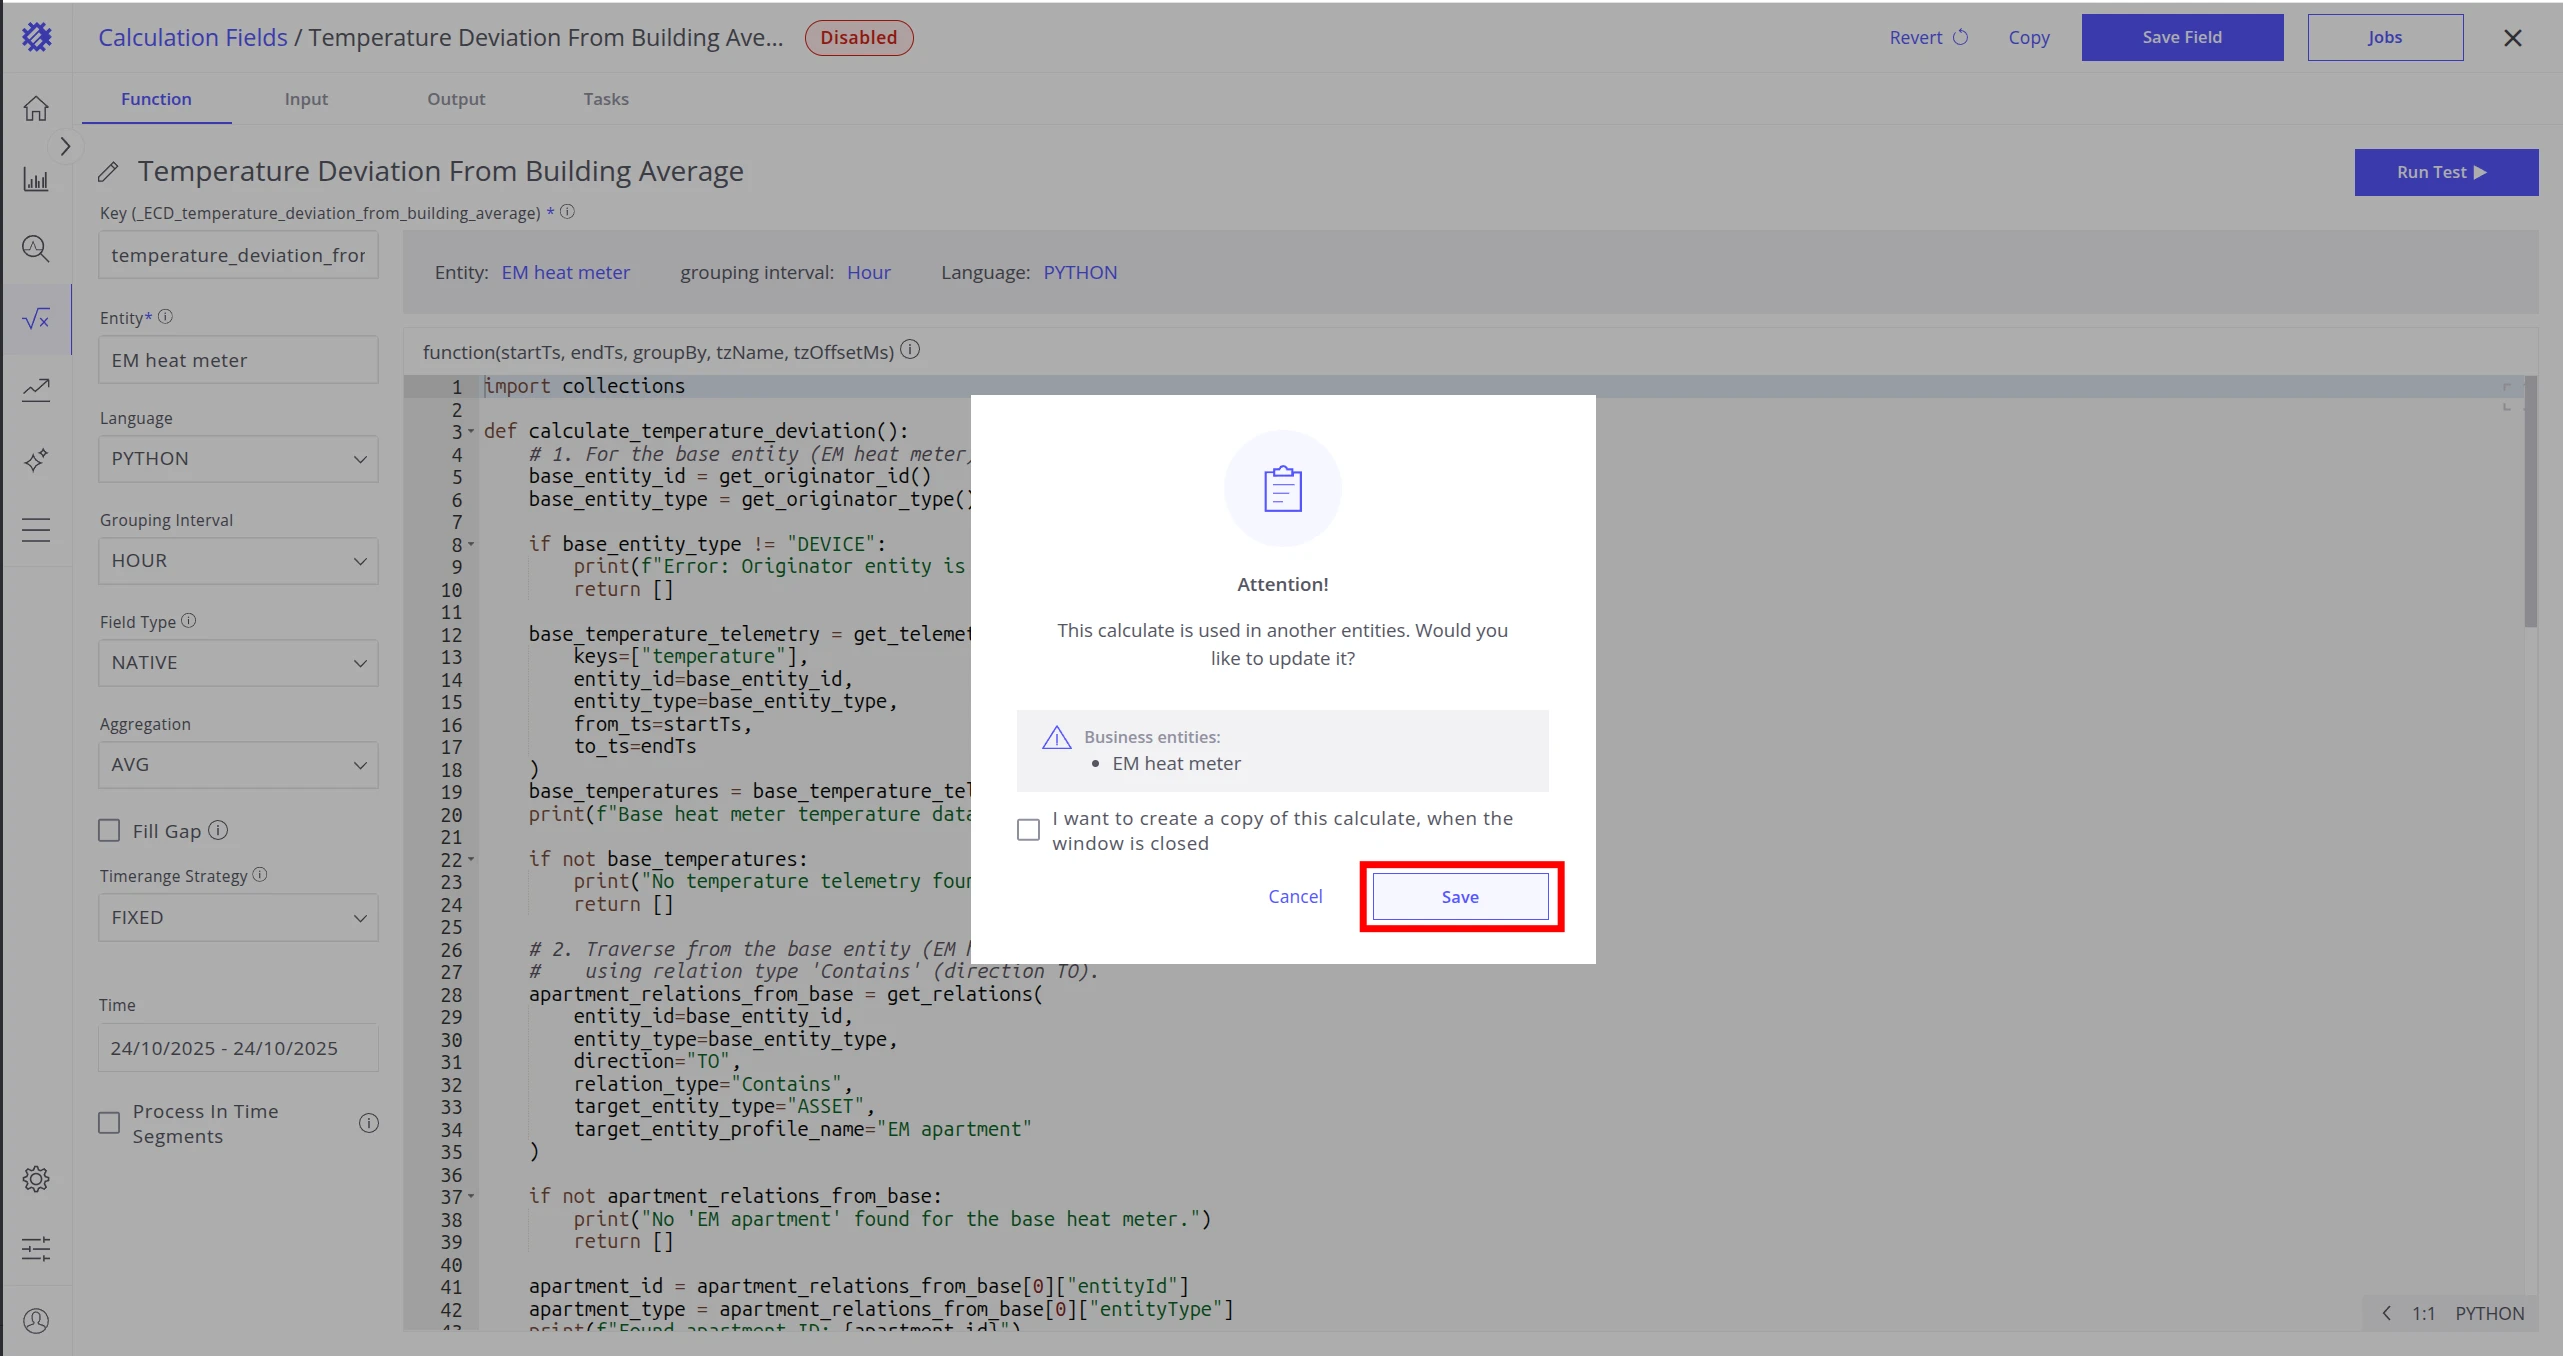
In the confirmation dialog, click Save.
-
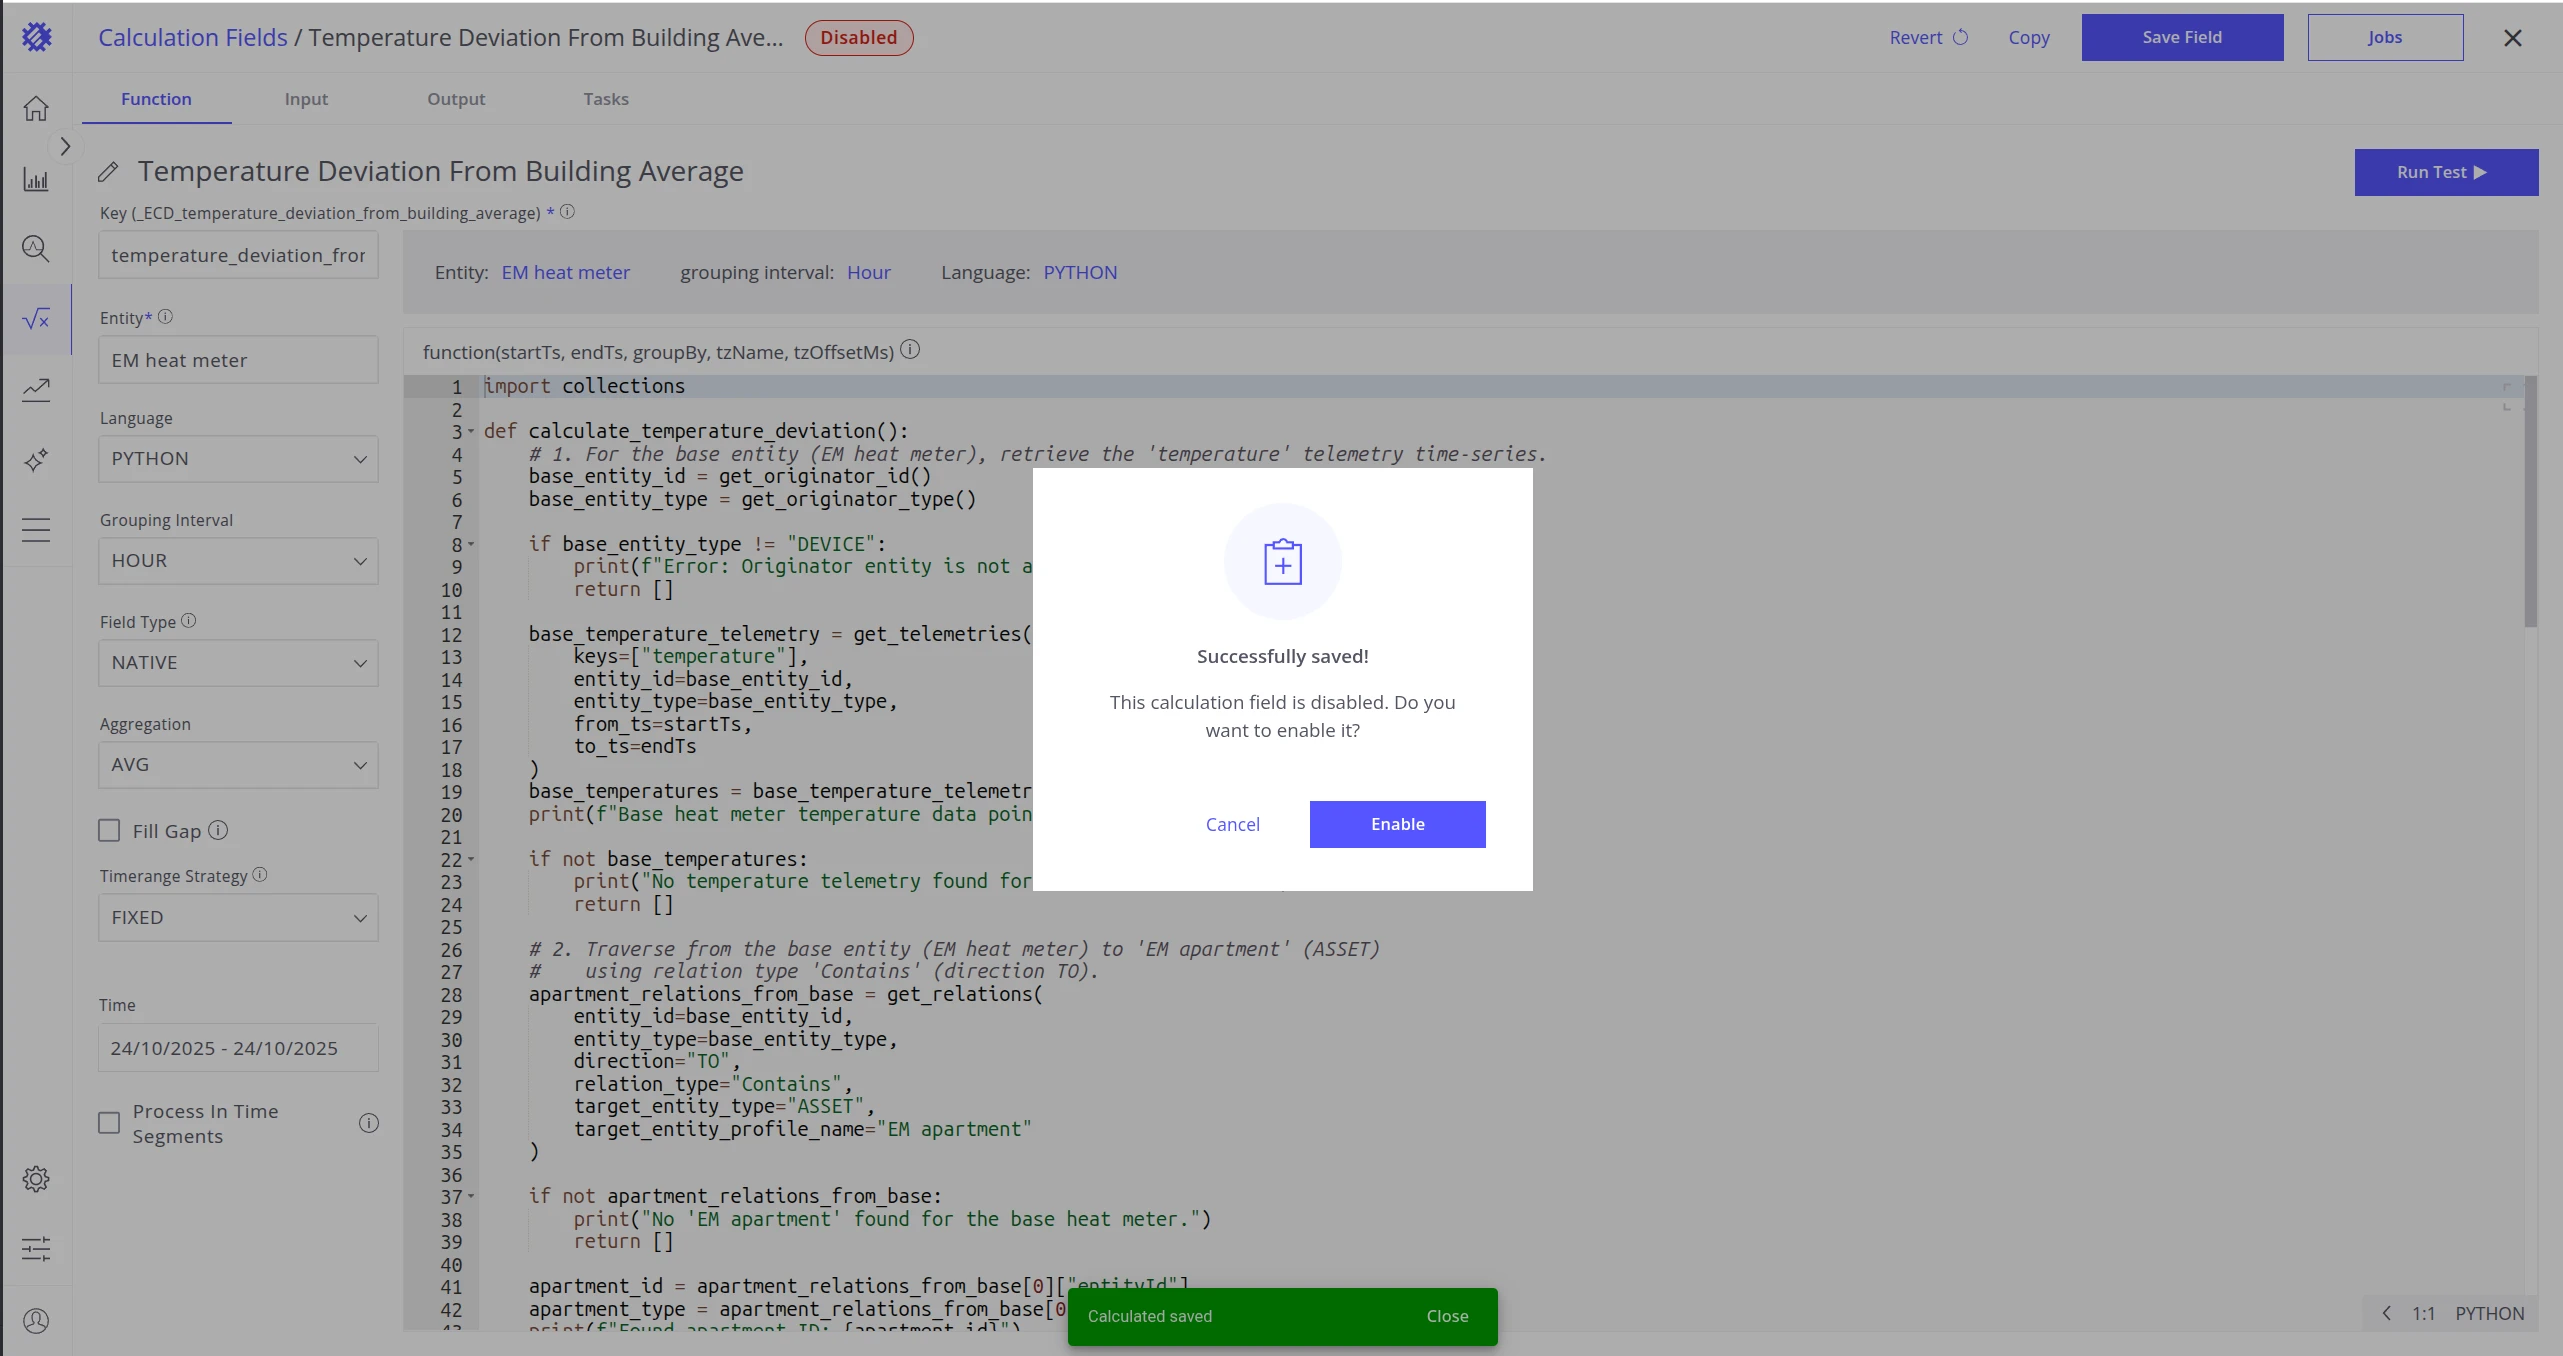
You will be prompted to enable the calculation field and run a refresh task. You can do it now or later.
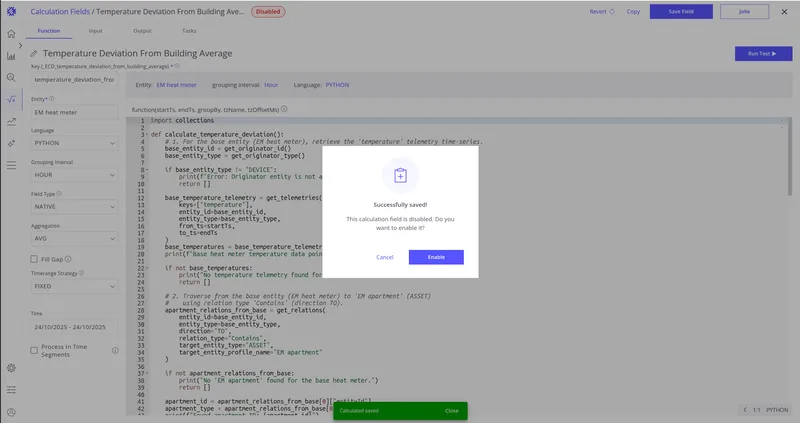
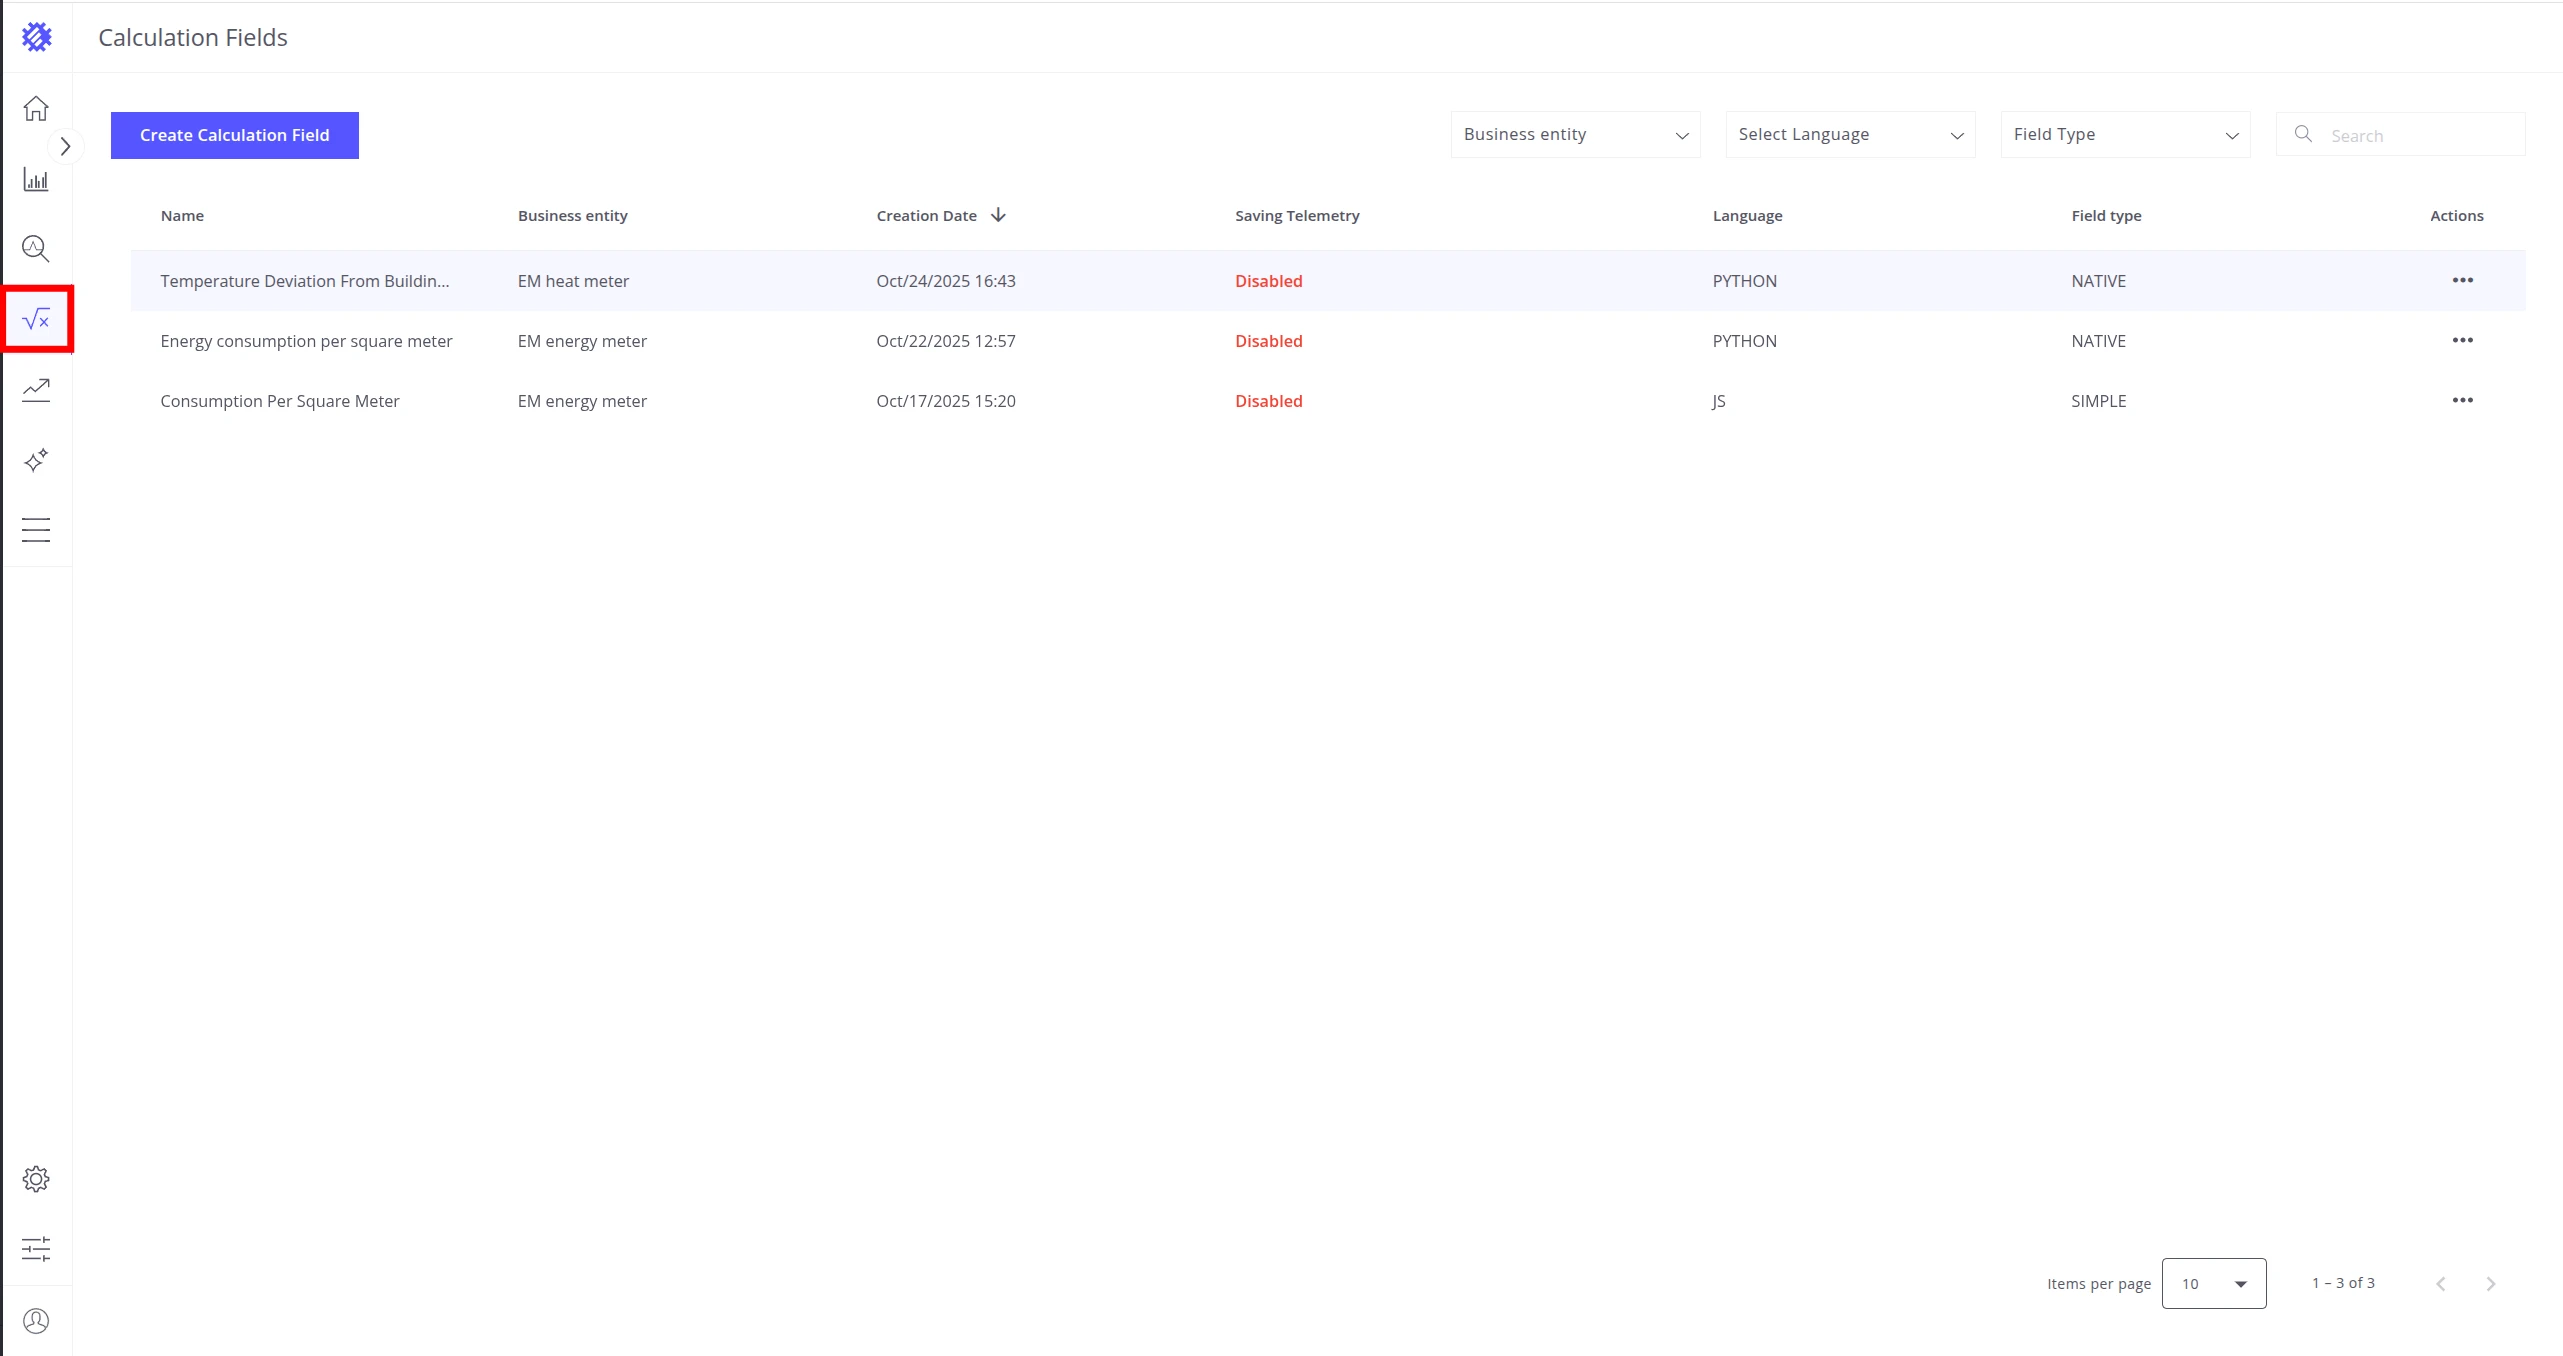
Once saved, the calculation field appears in the Calculation folder in the business entities panel.
Reprocess Task
Section titled “Reprocess Task”The Reprocess Task runs once to compute and store historical data in ThingsBoard for the selected time range and entities.
-
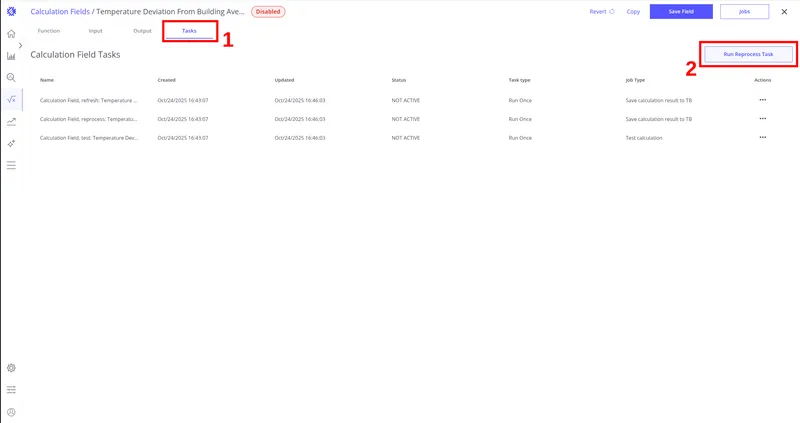
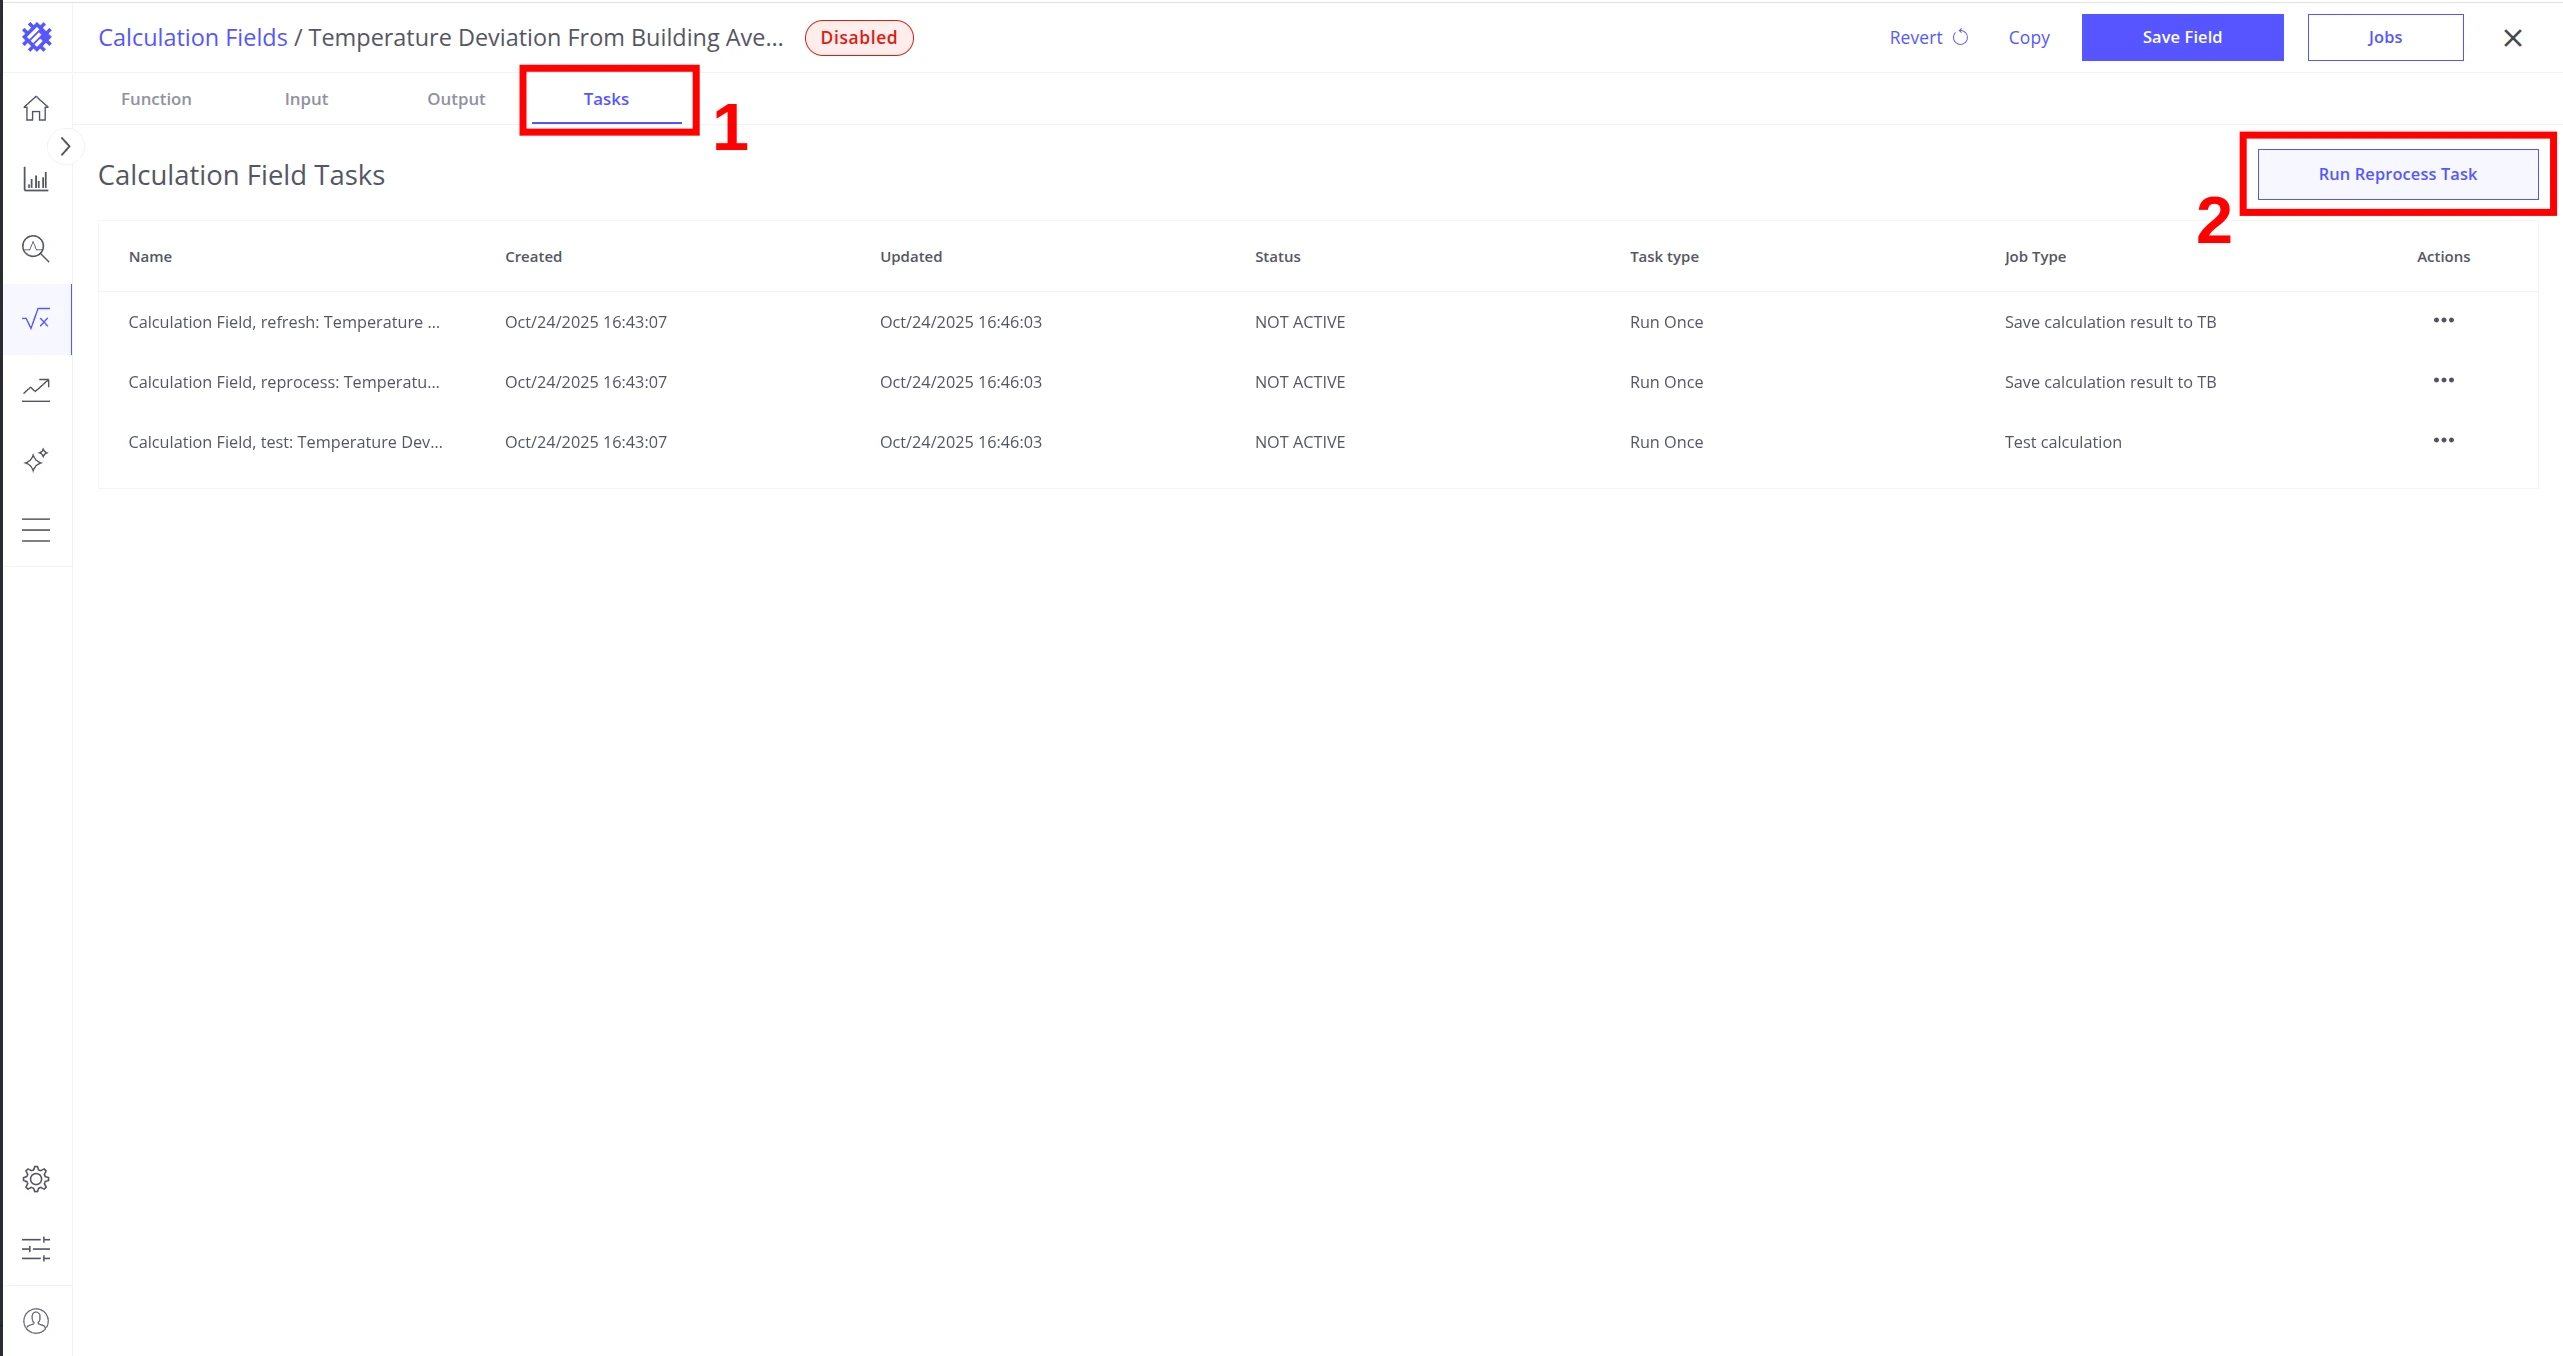
Open the Tasks tab and click Run Reprocess Task.
-
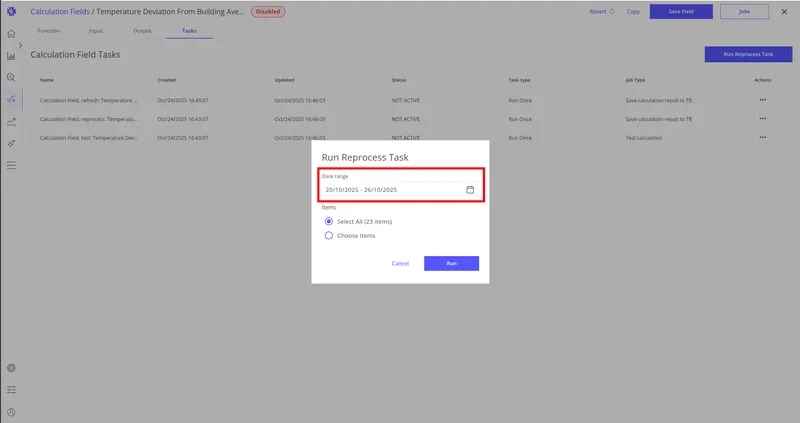
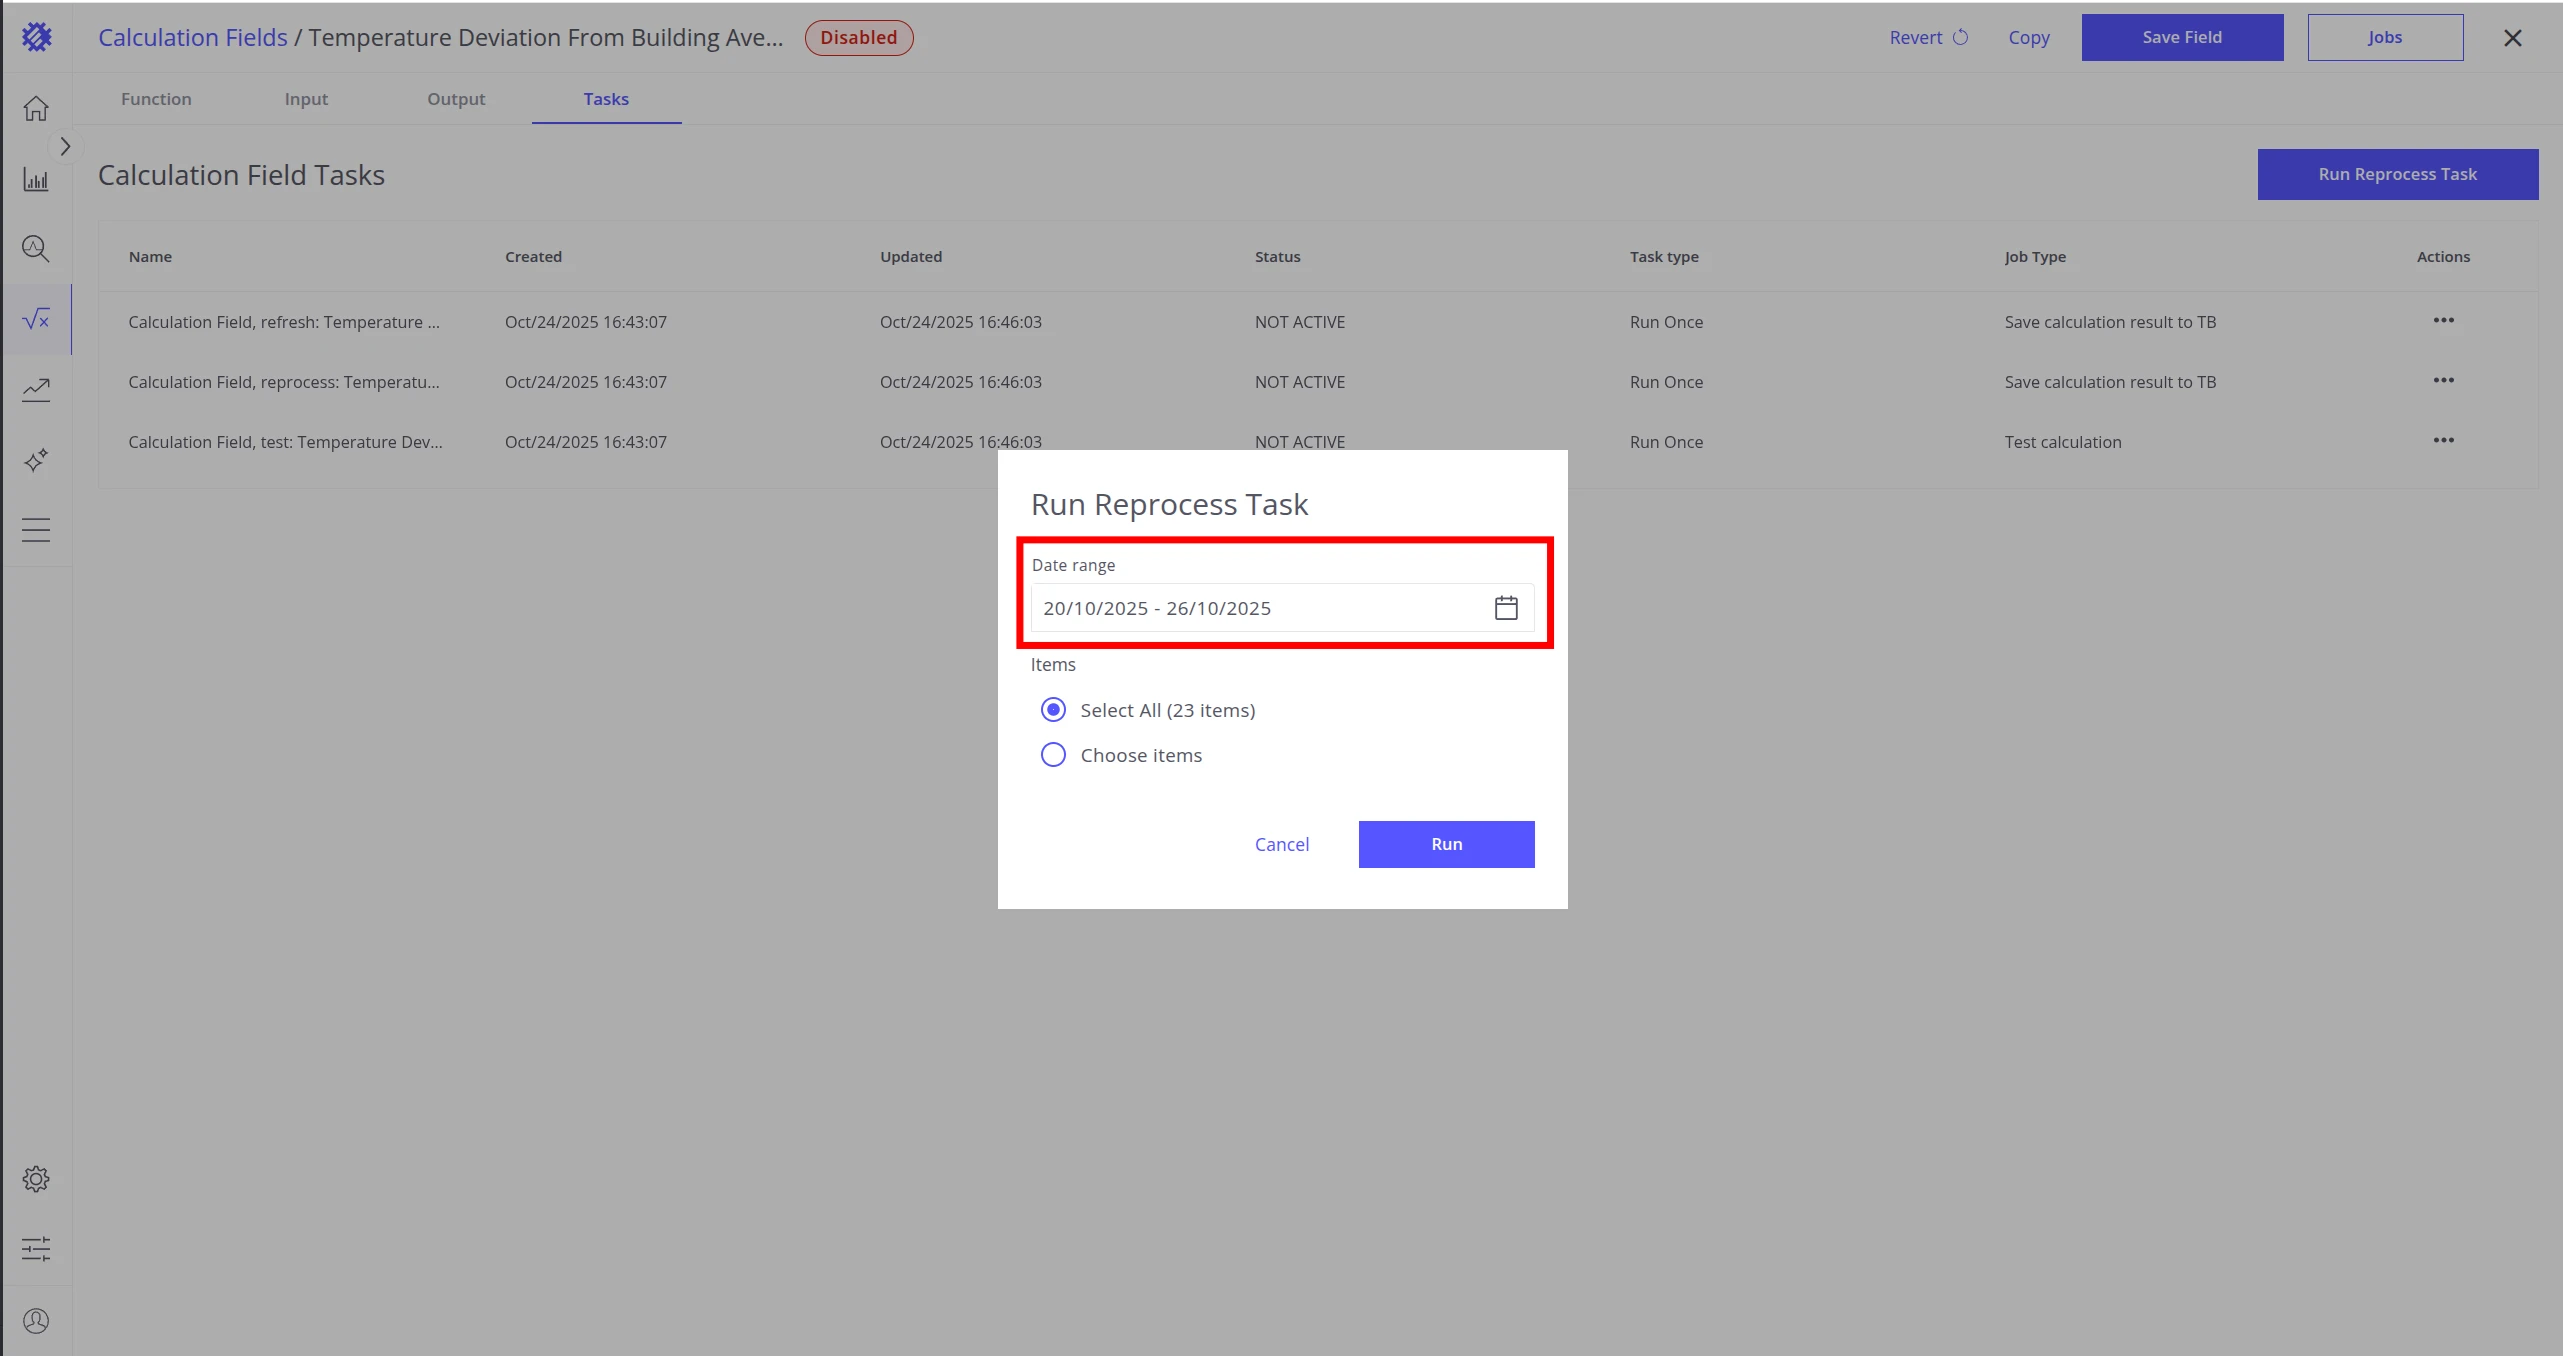
Select the time range to reprocess.
-
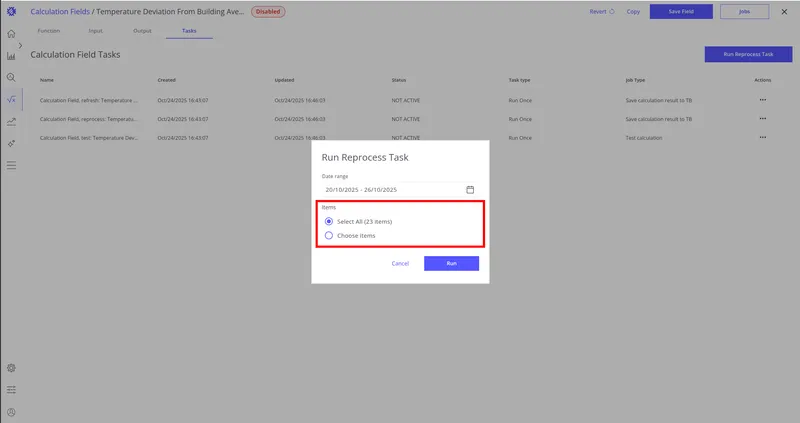
Choose the target entities — you can apply the calculation to all entities with the same entity profile.
-
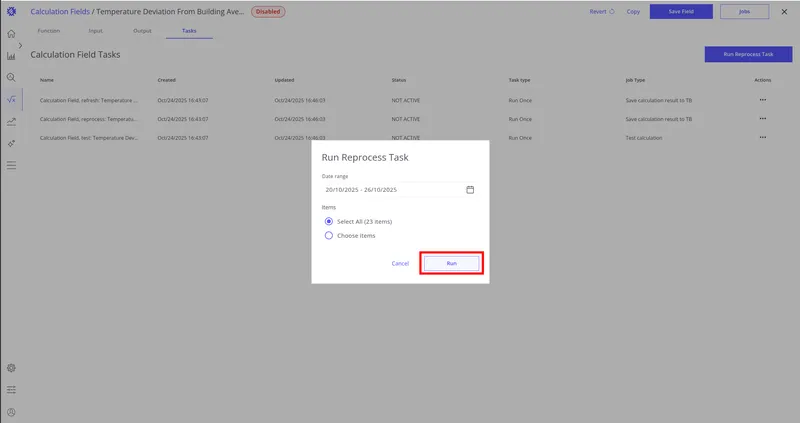
Click Run.
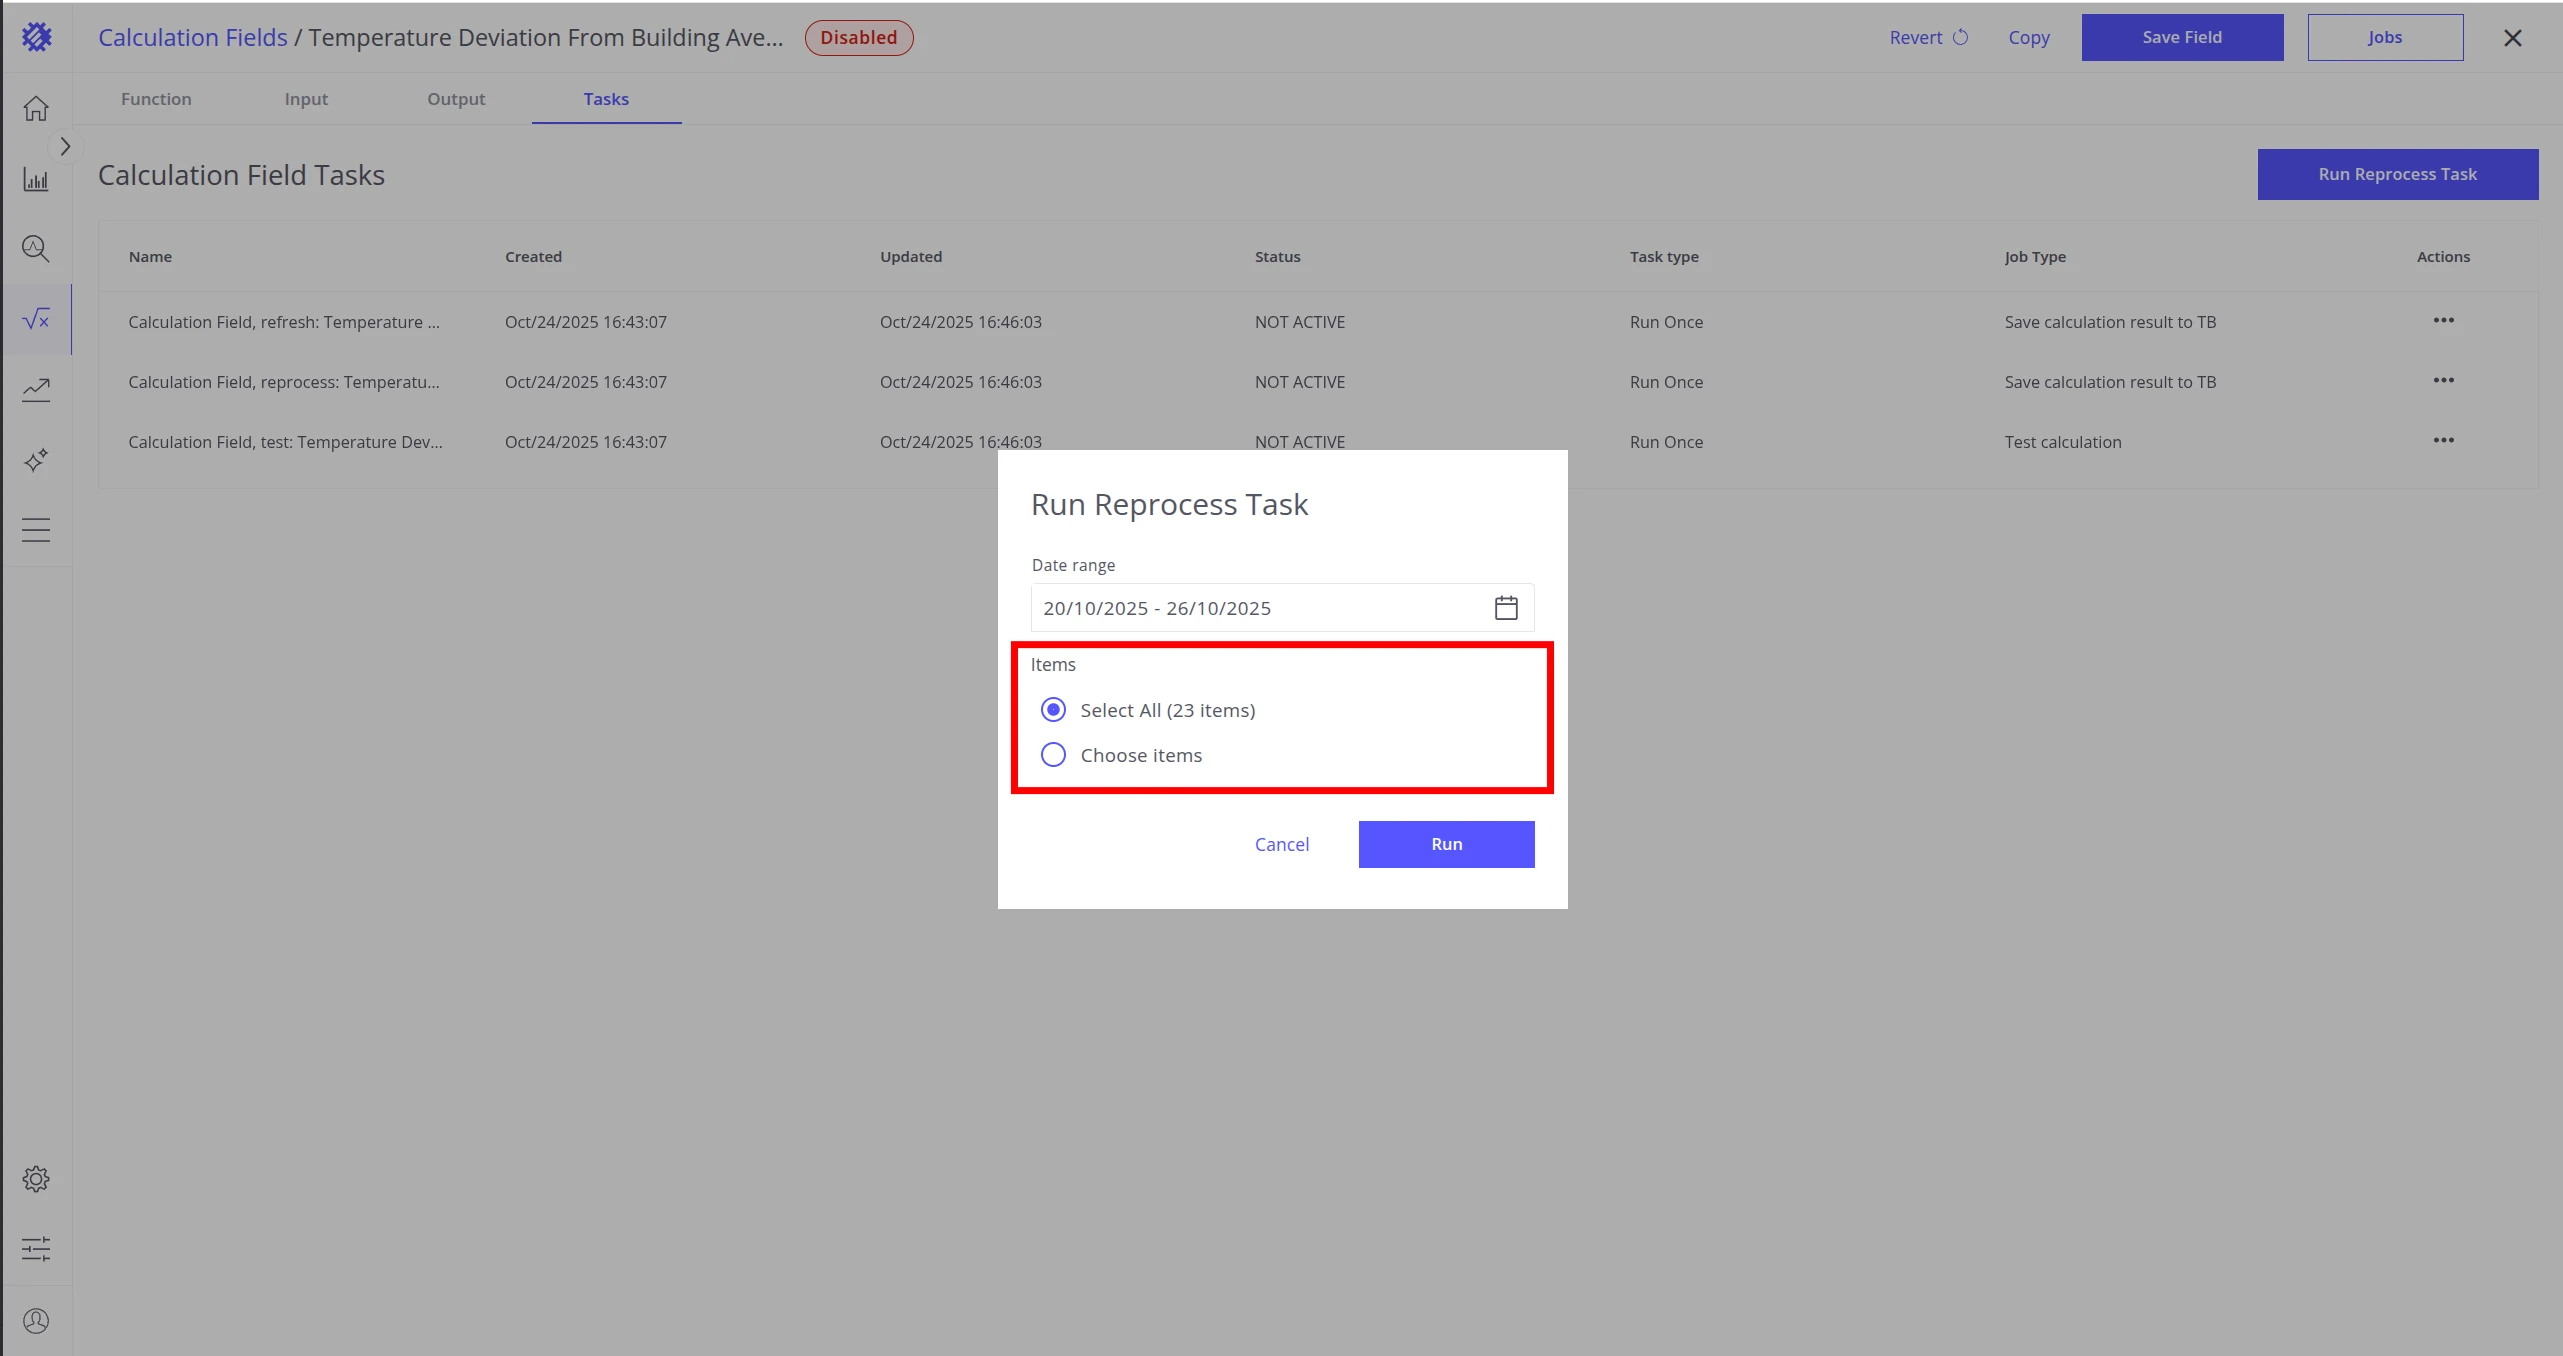
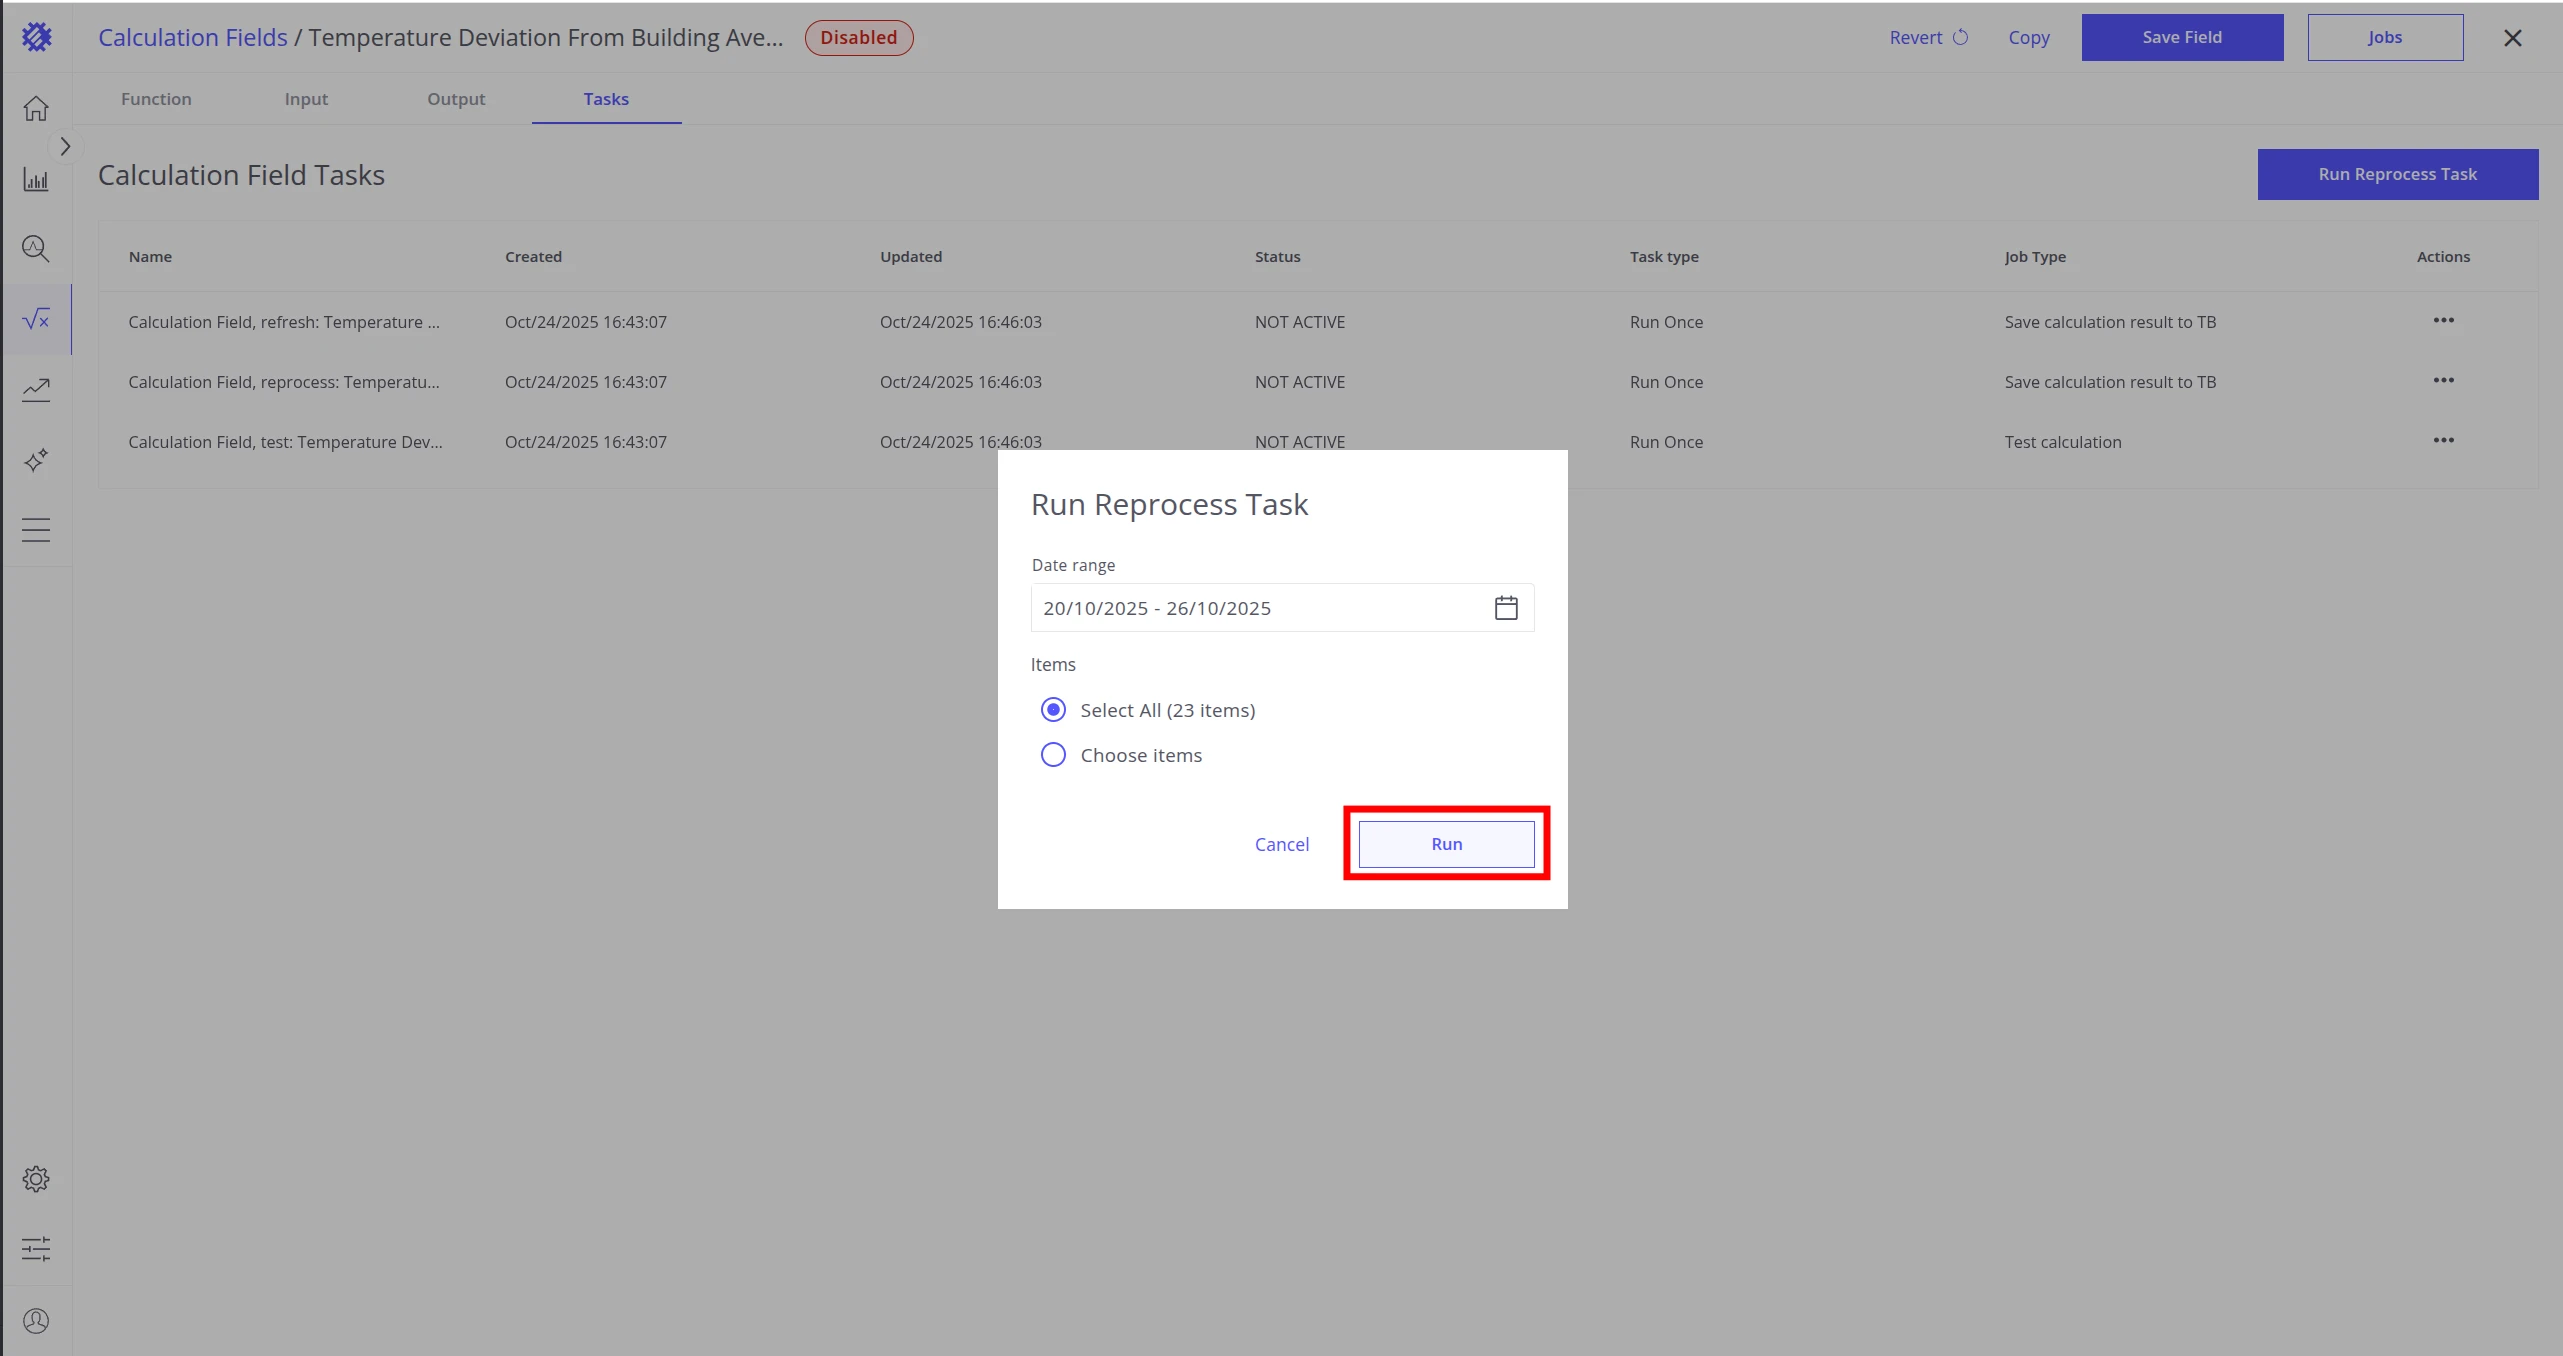
After the job completes, the telemetry appears in ThingsBoard under the key _ECD_{KEY}.
Refresh Task
Section titled “Refresh Task”The Refresh Task runs on a recurring schedule to keep ThingsBoard telemetry up to date.
-
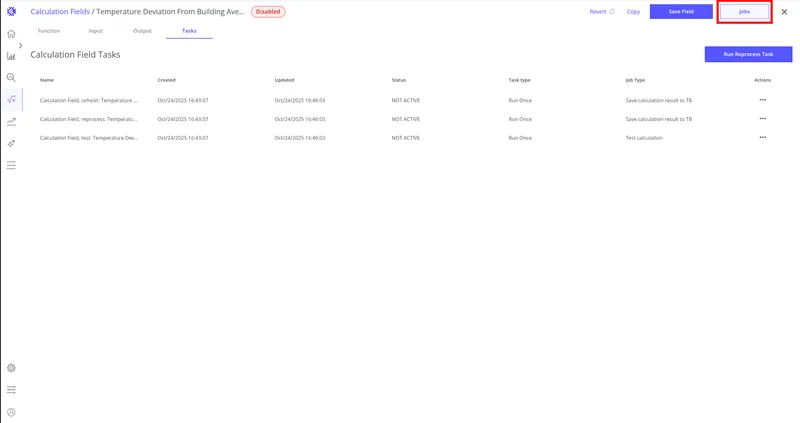
Click the Jobs button in the calculation field editor.
-
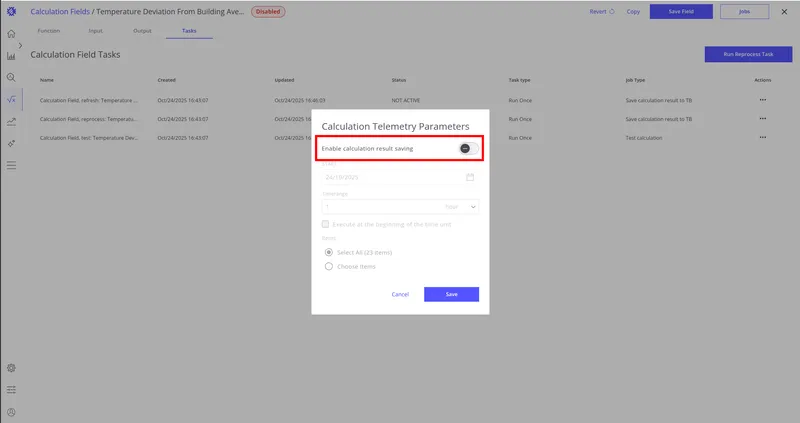
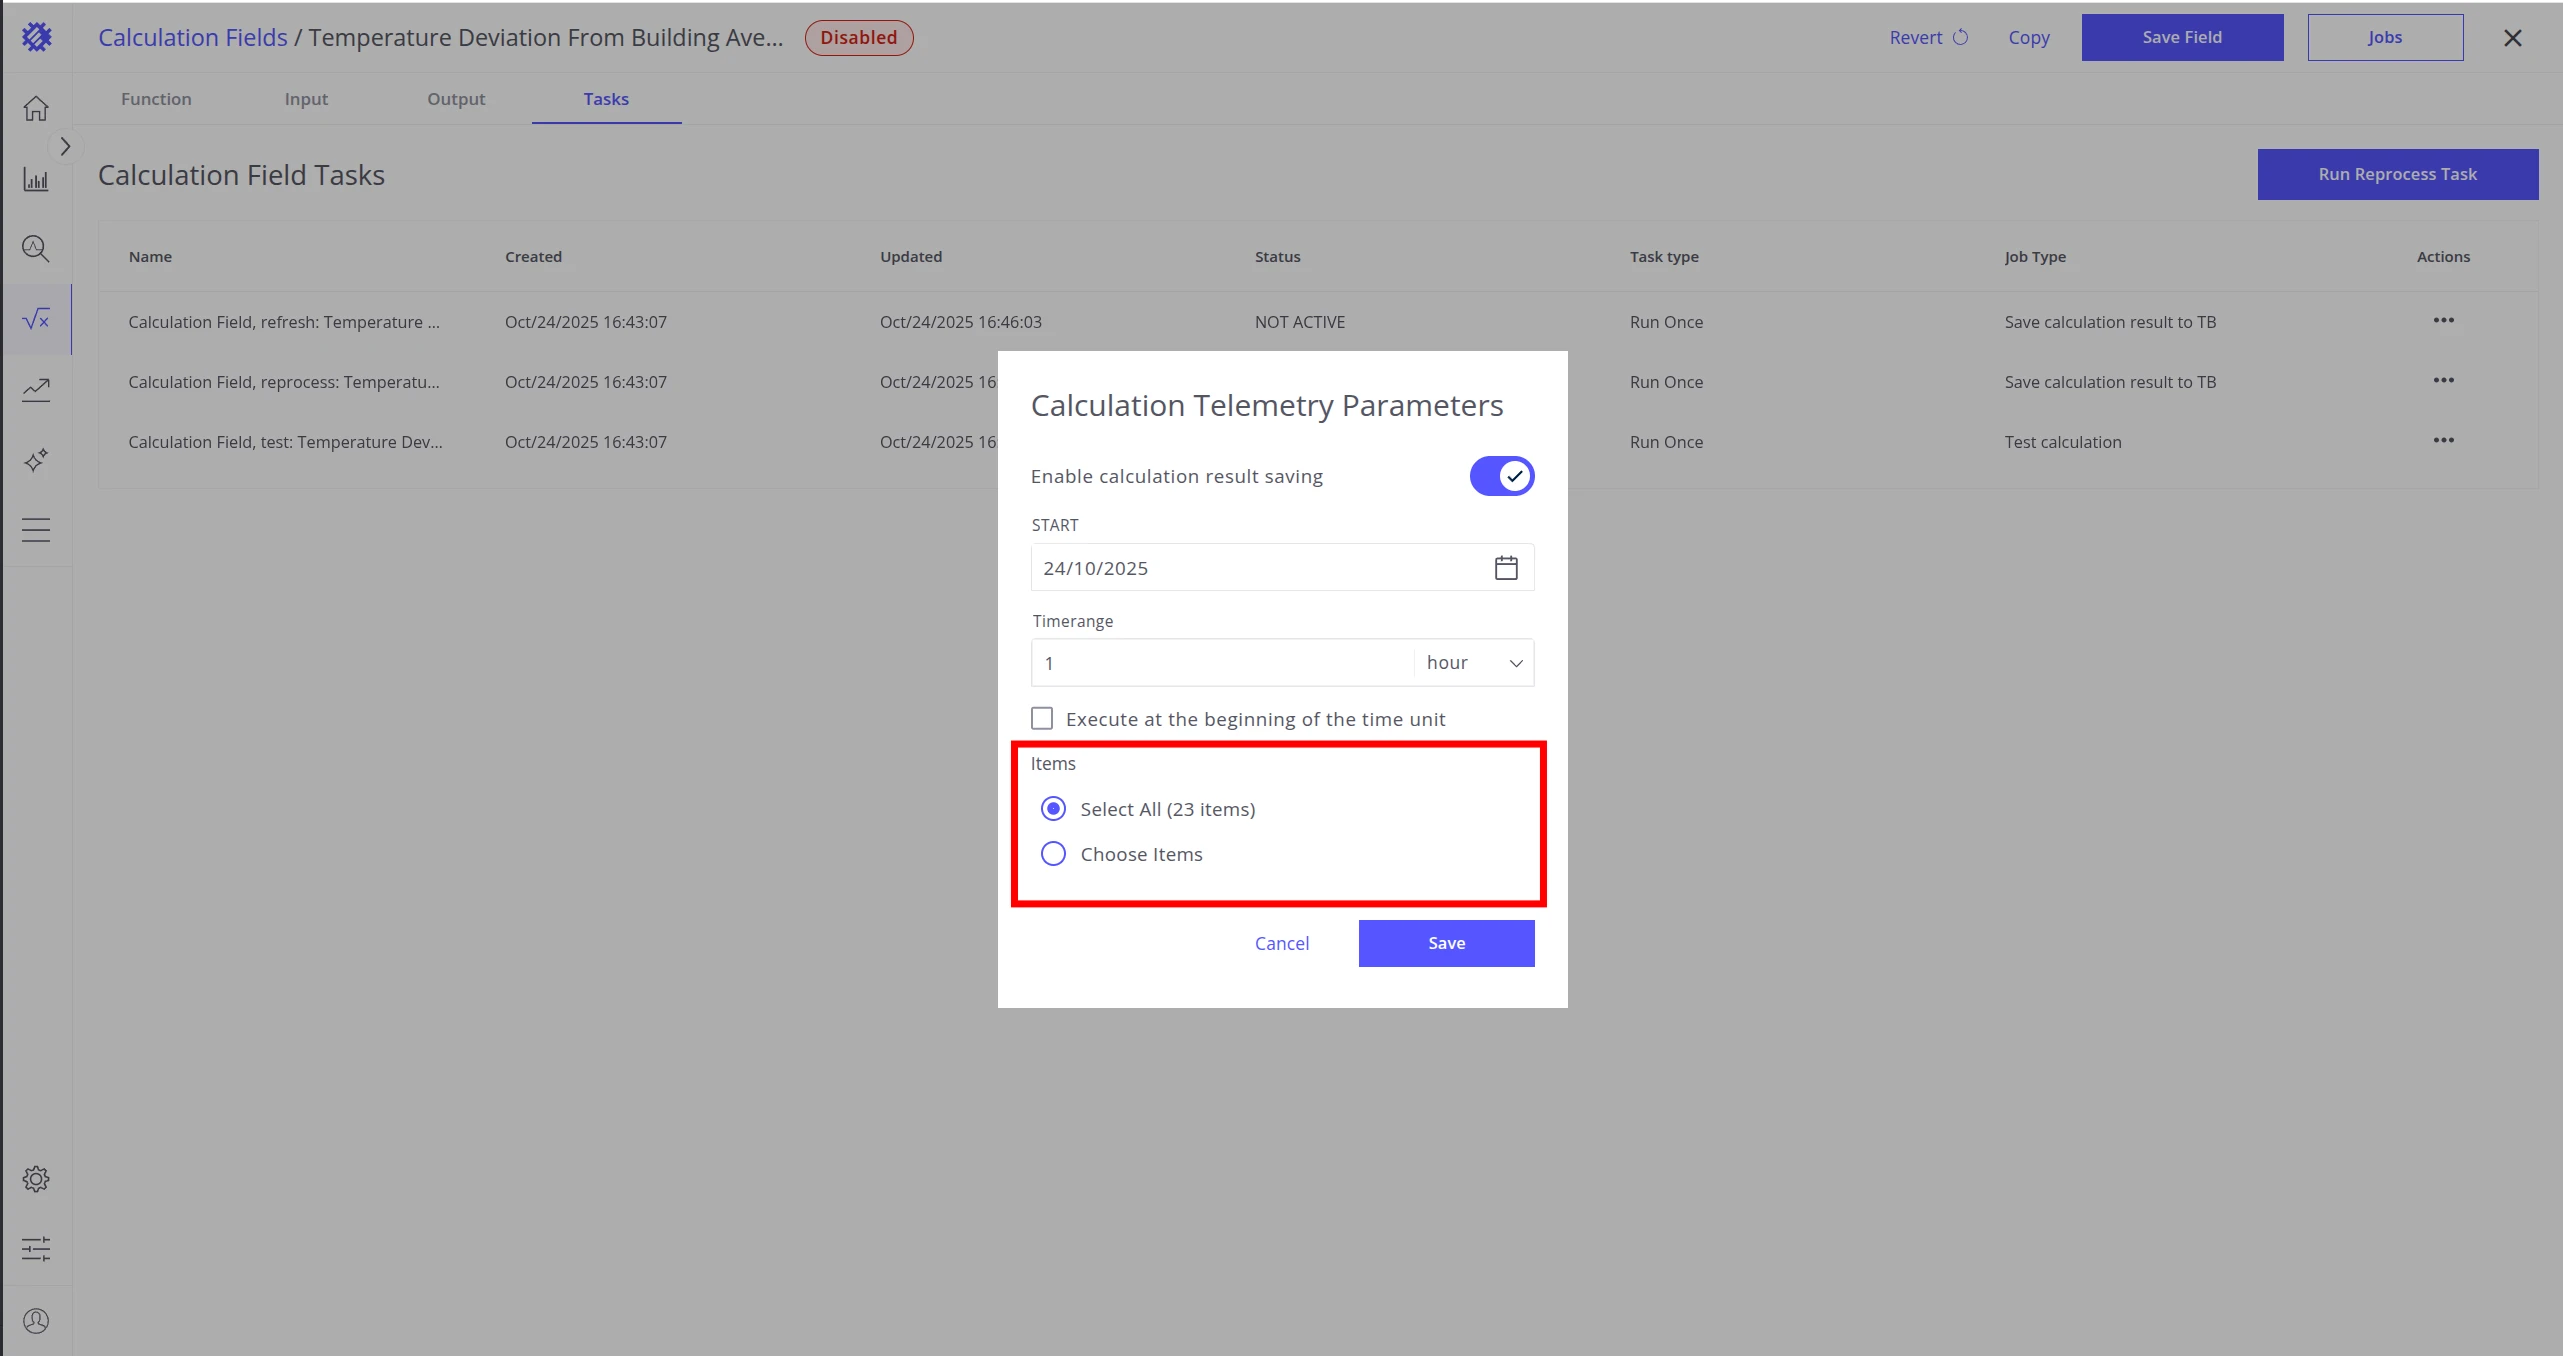
Enable calculation result saving.
-
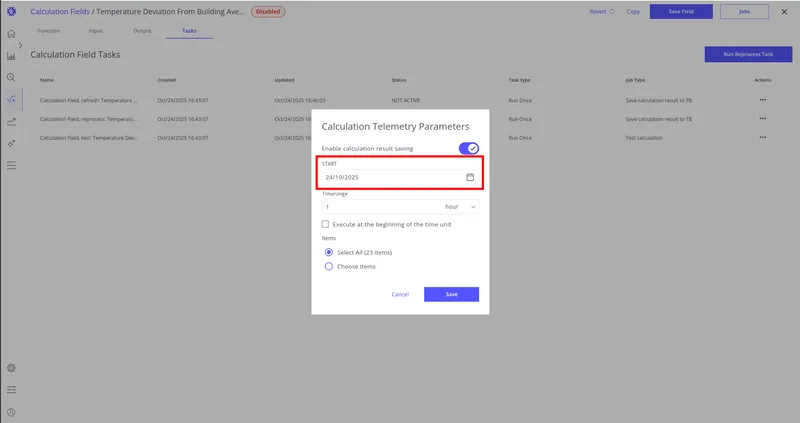
Set the start date — the earliest point from which data will be saved.
-
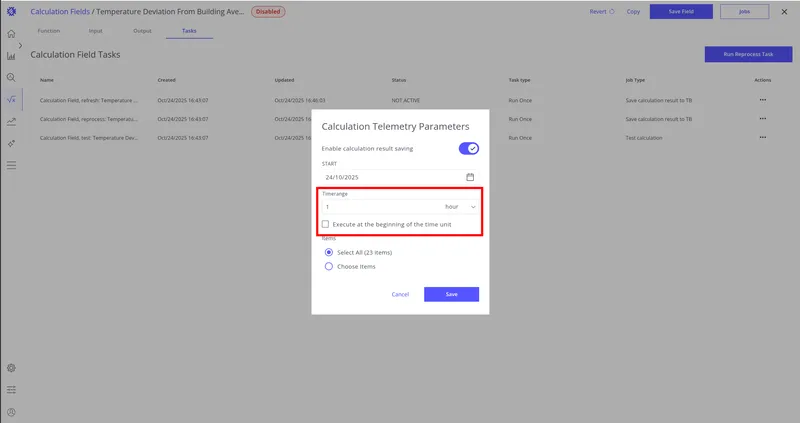
Define the frequency — how often the job runs. The minimum interval is 1 minute (not recommended due to load); on Trendz Cloud the minimum is 1 hour.
-
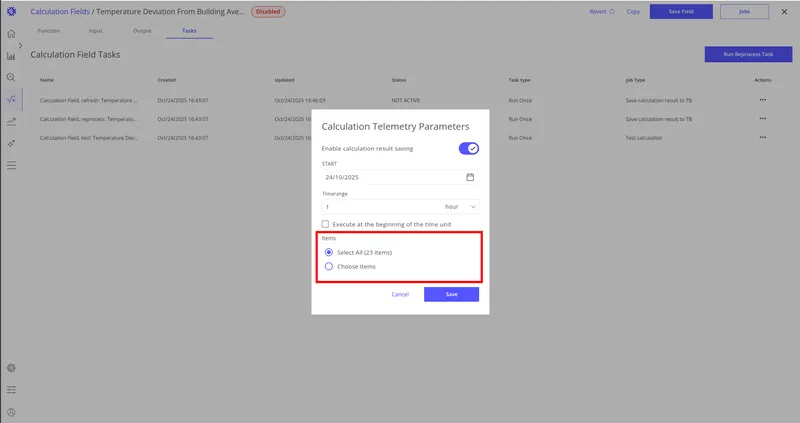
Choose target entities — select individual entities or all entities with the same profile for automatic updates.
-
Click Save.
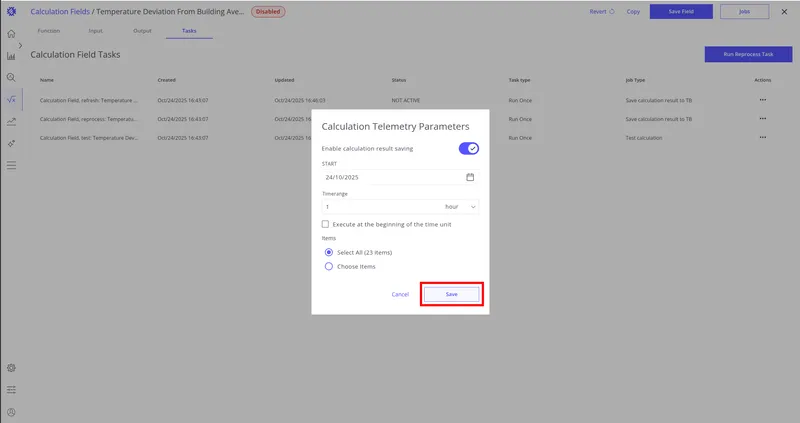
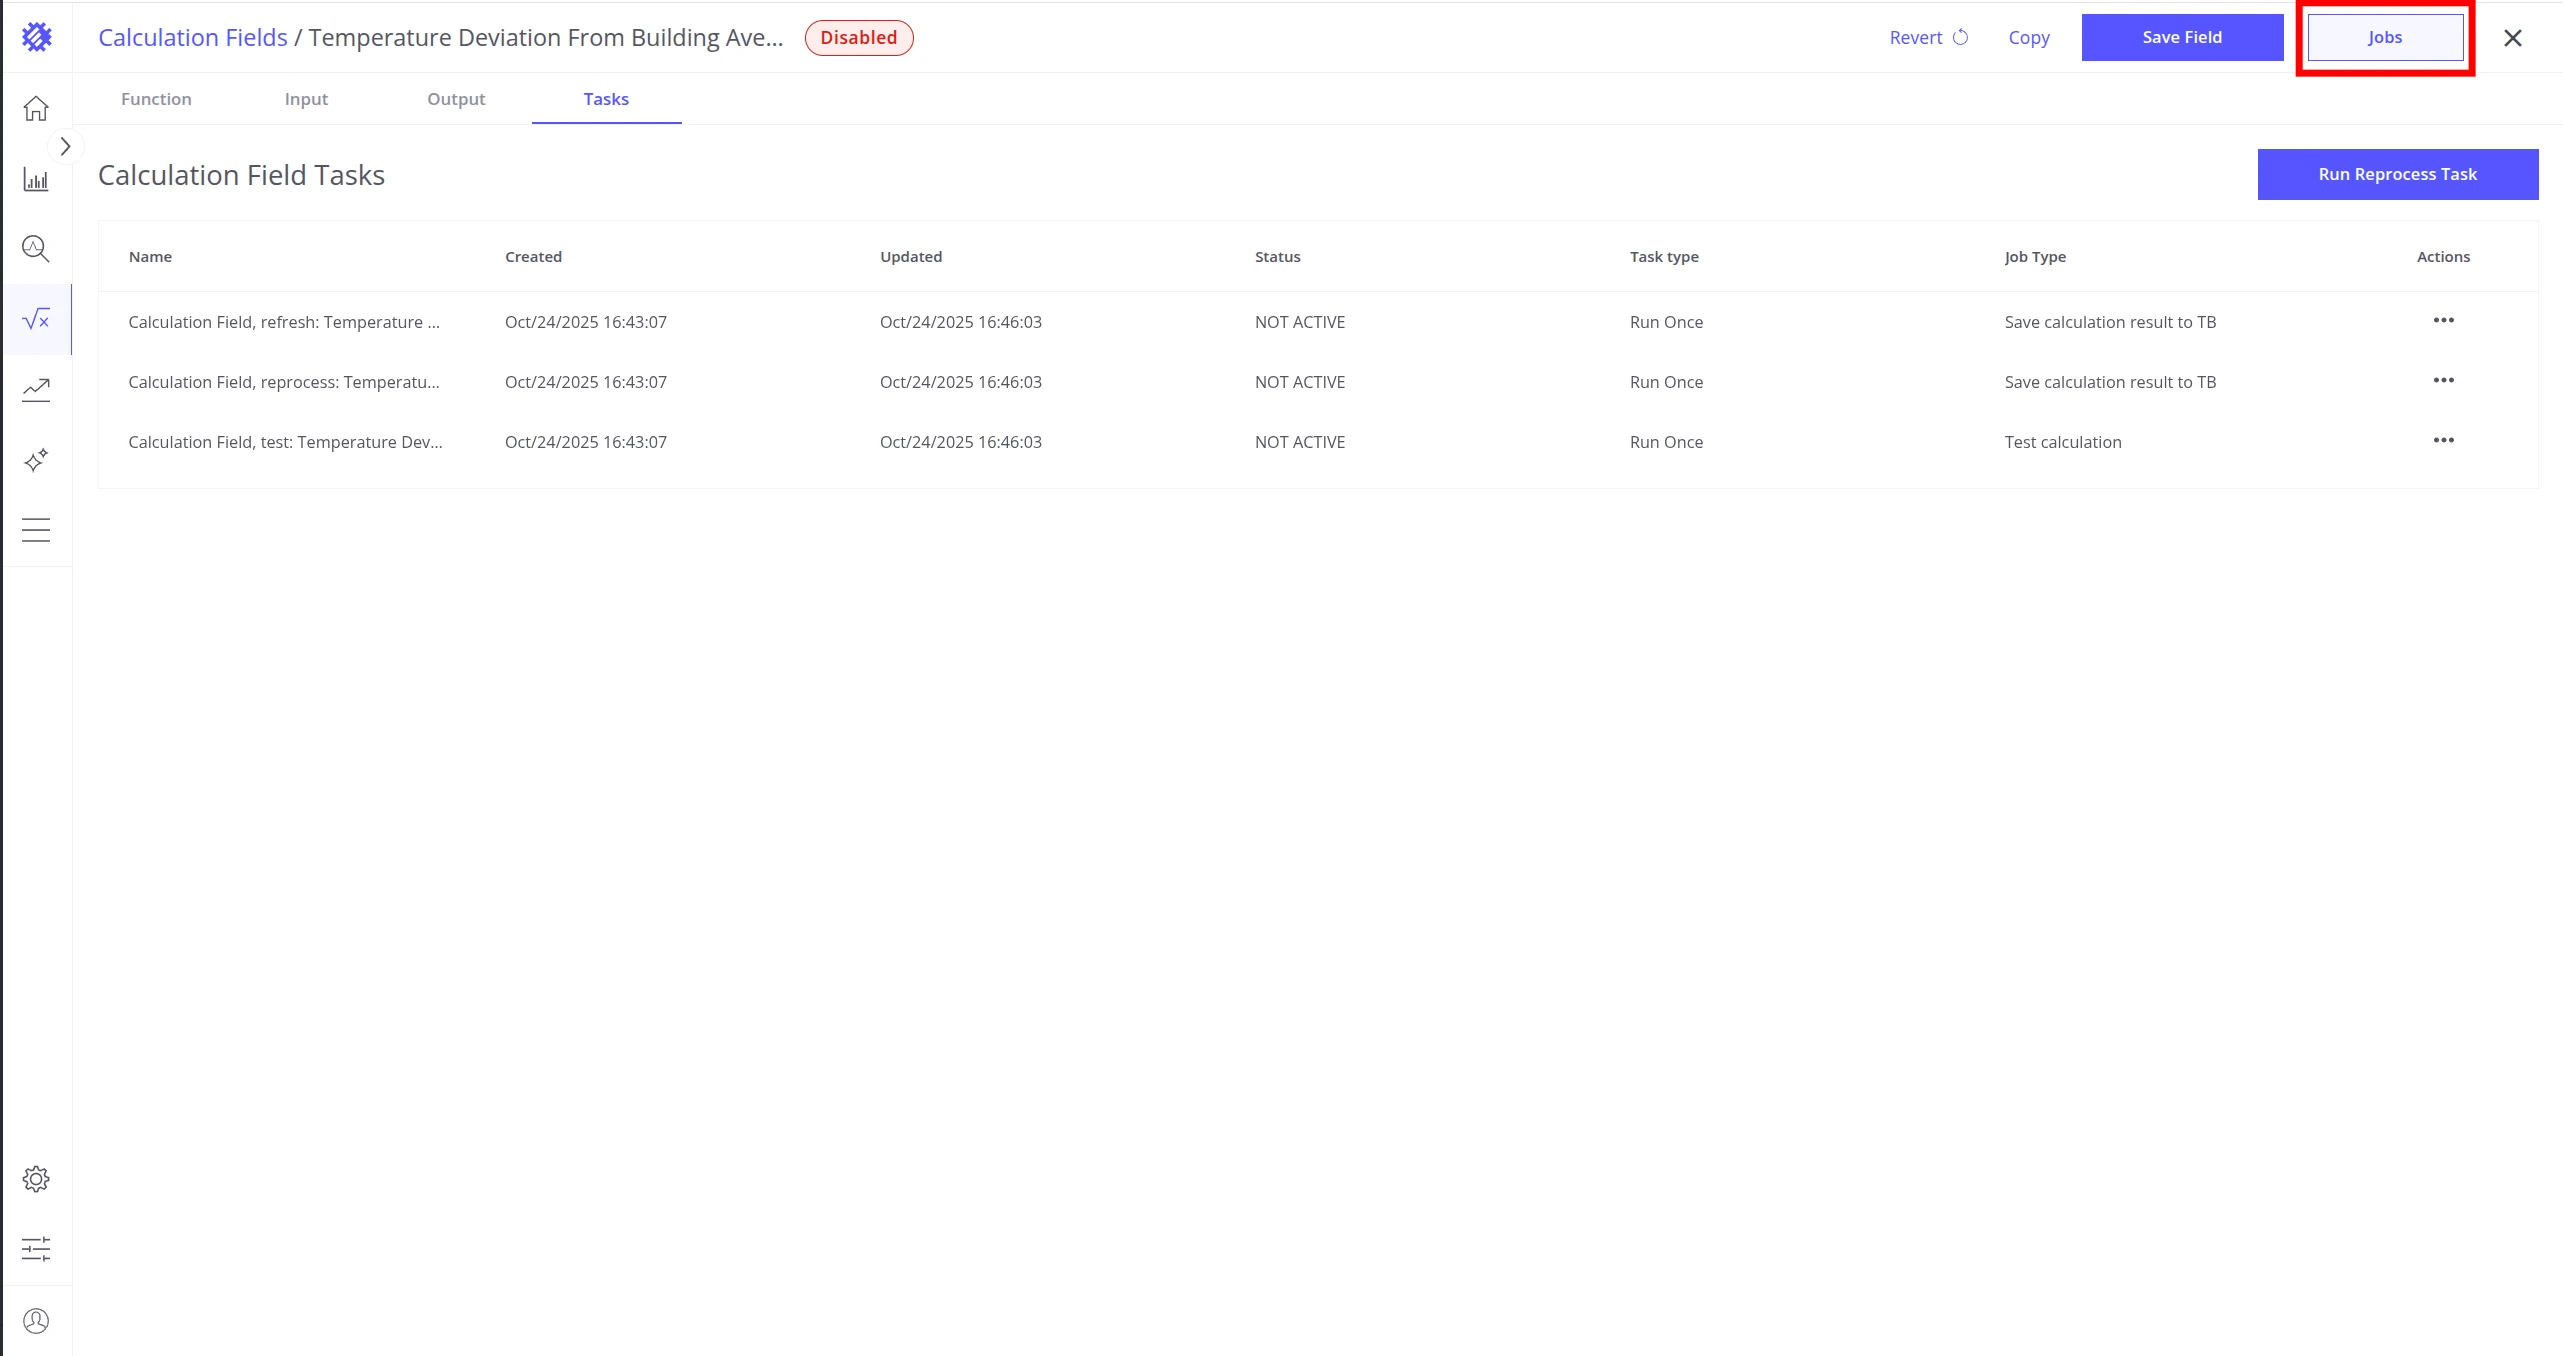
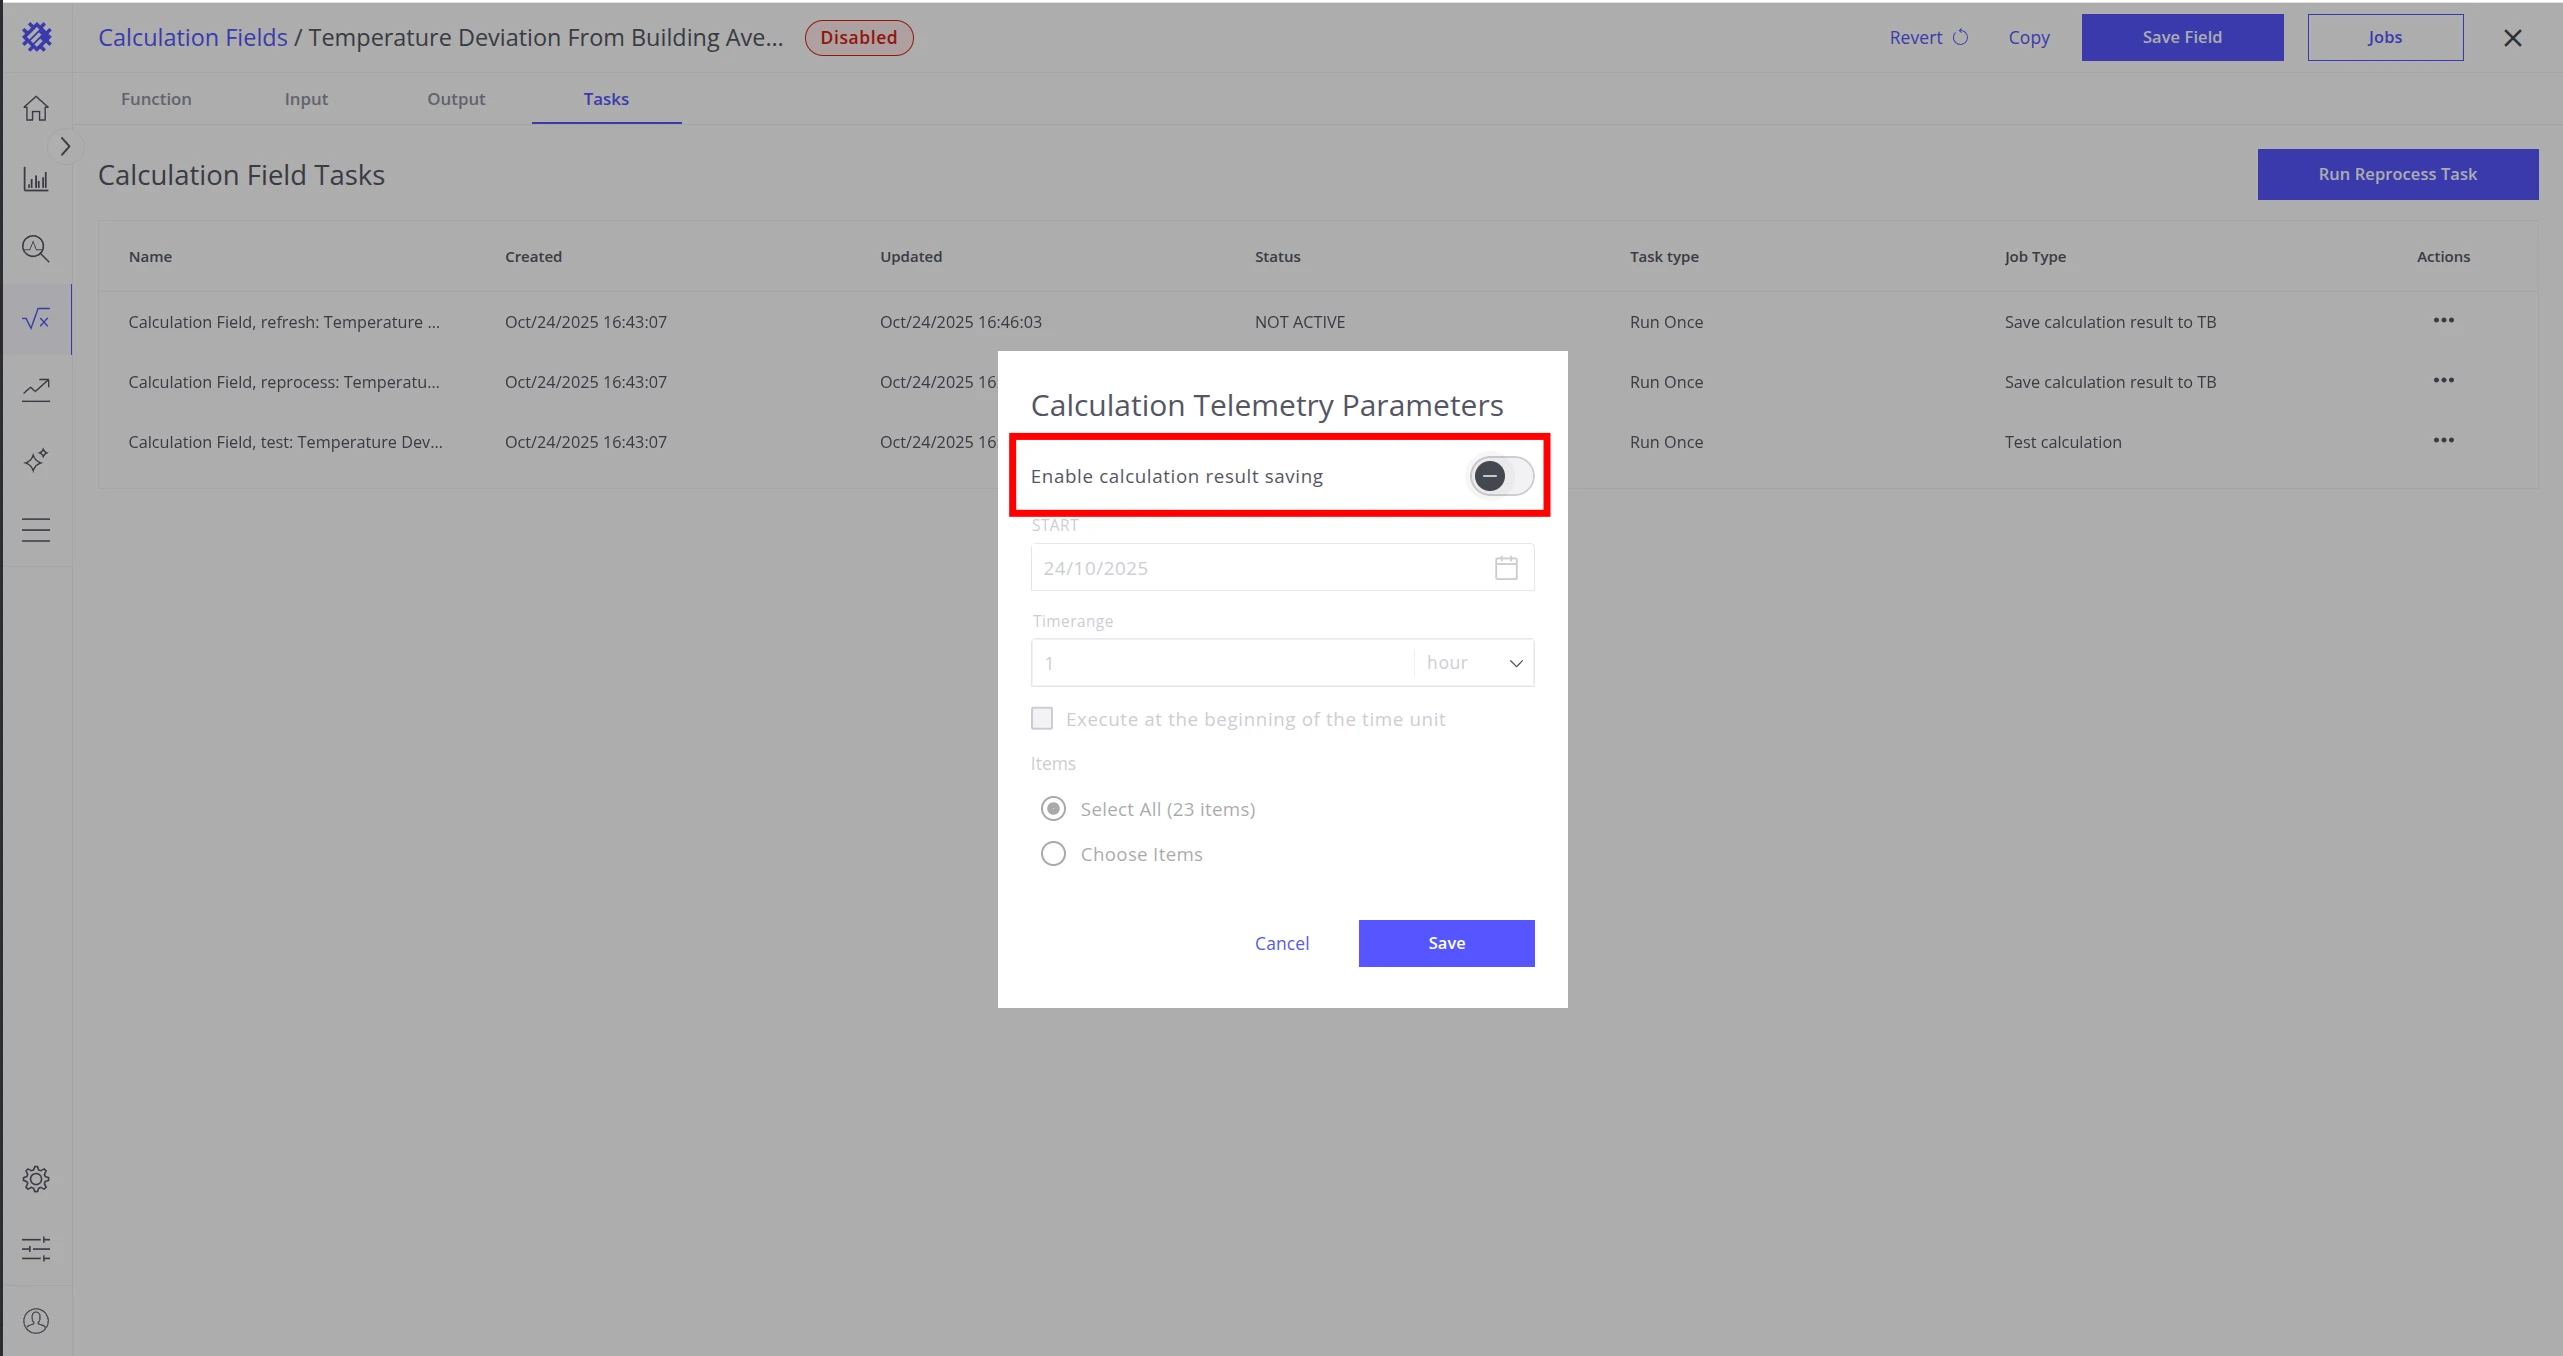
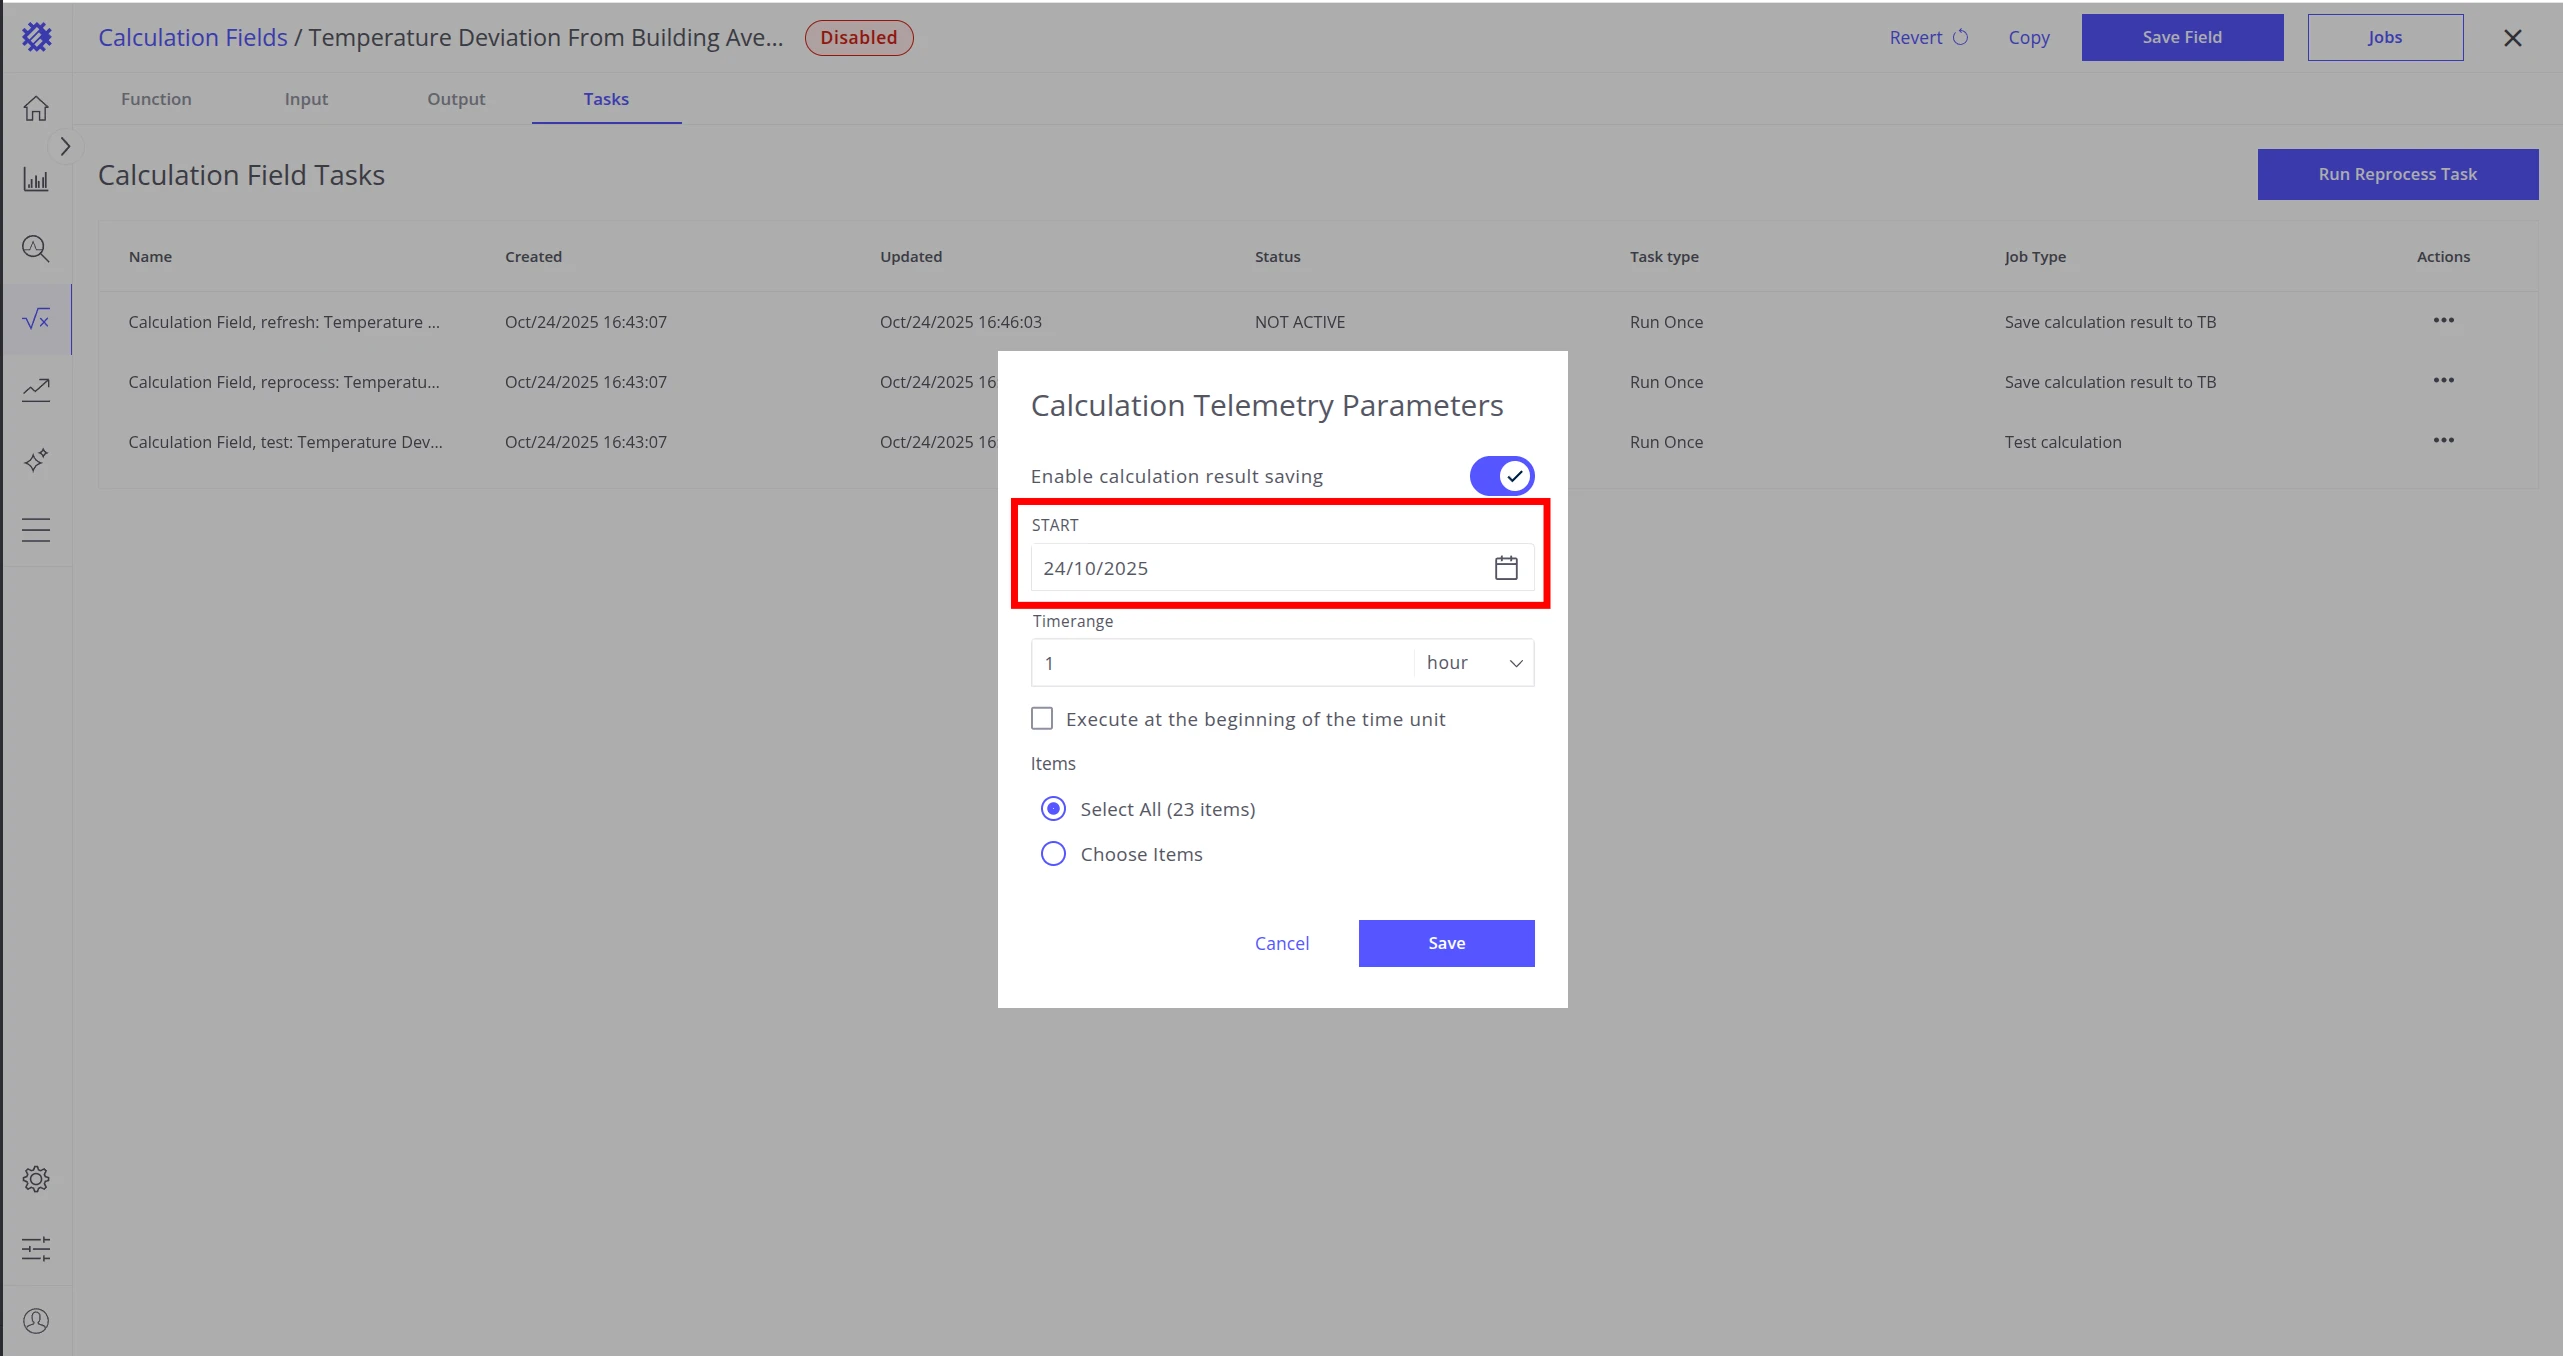
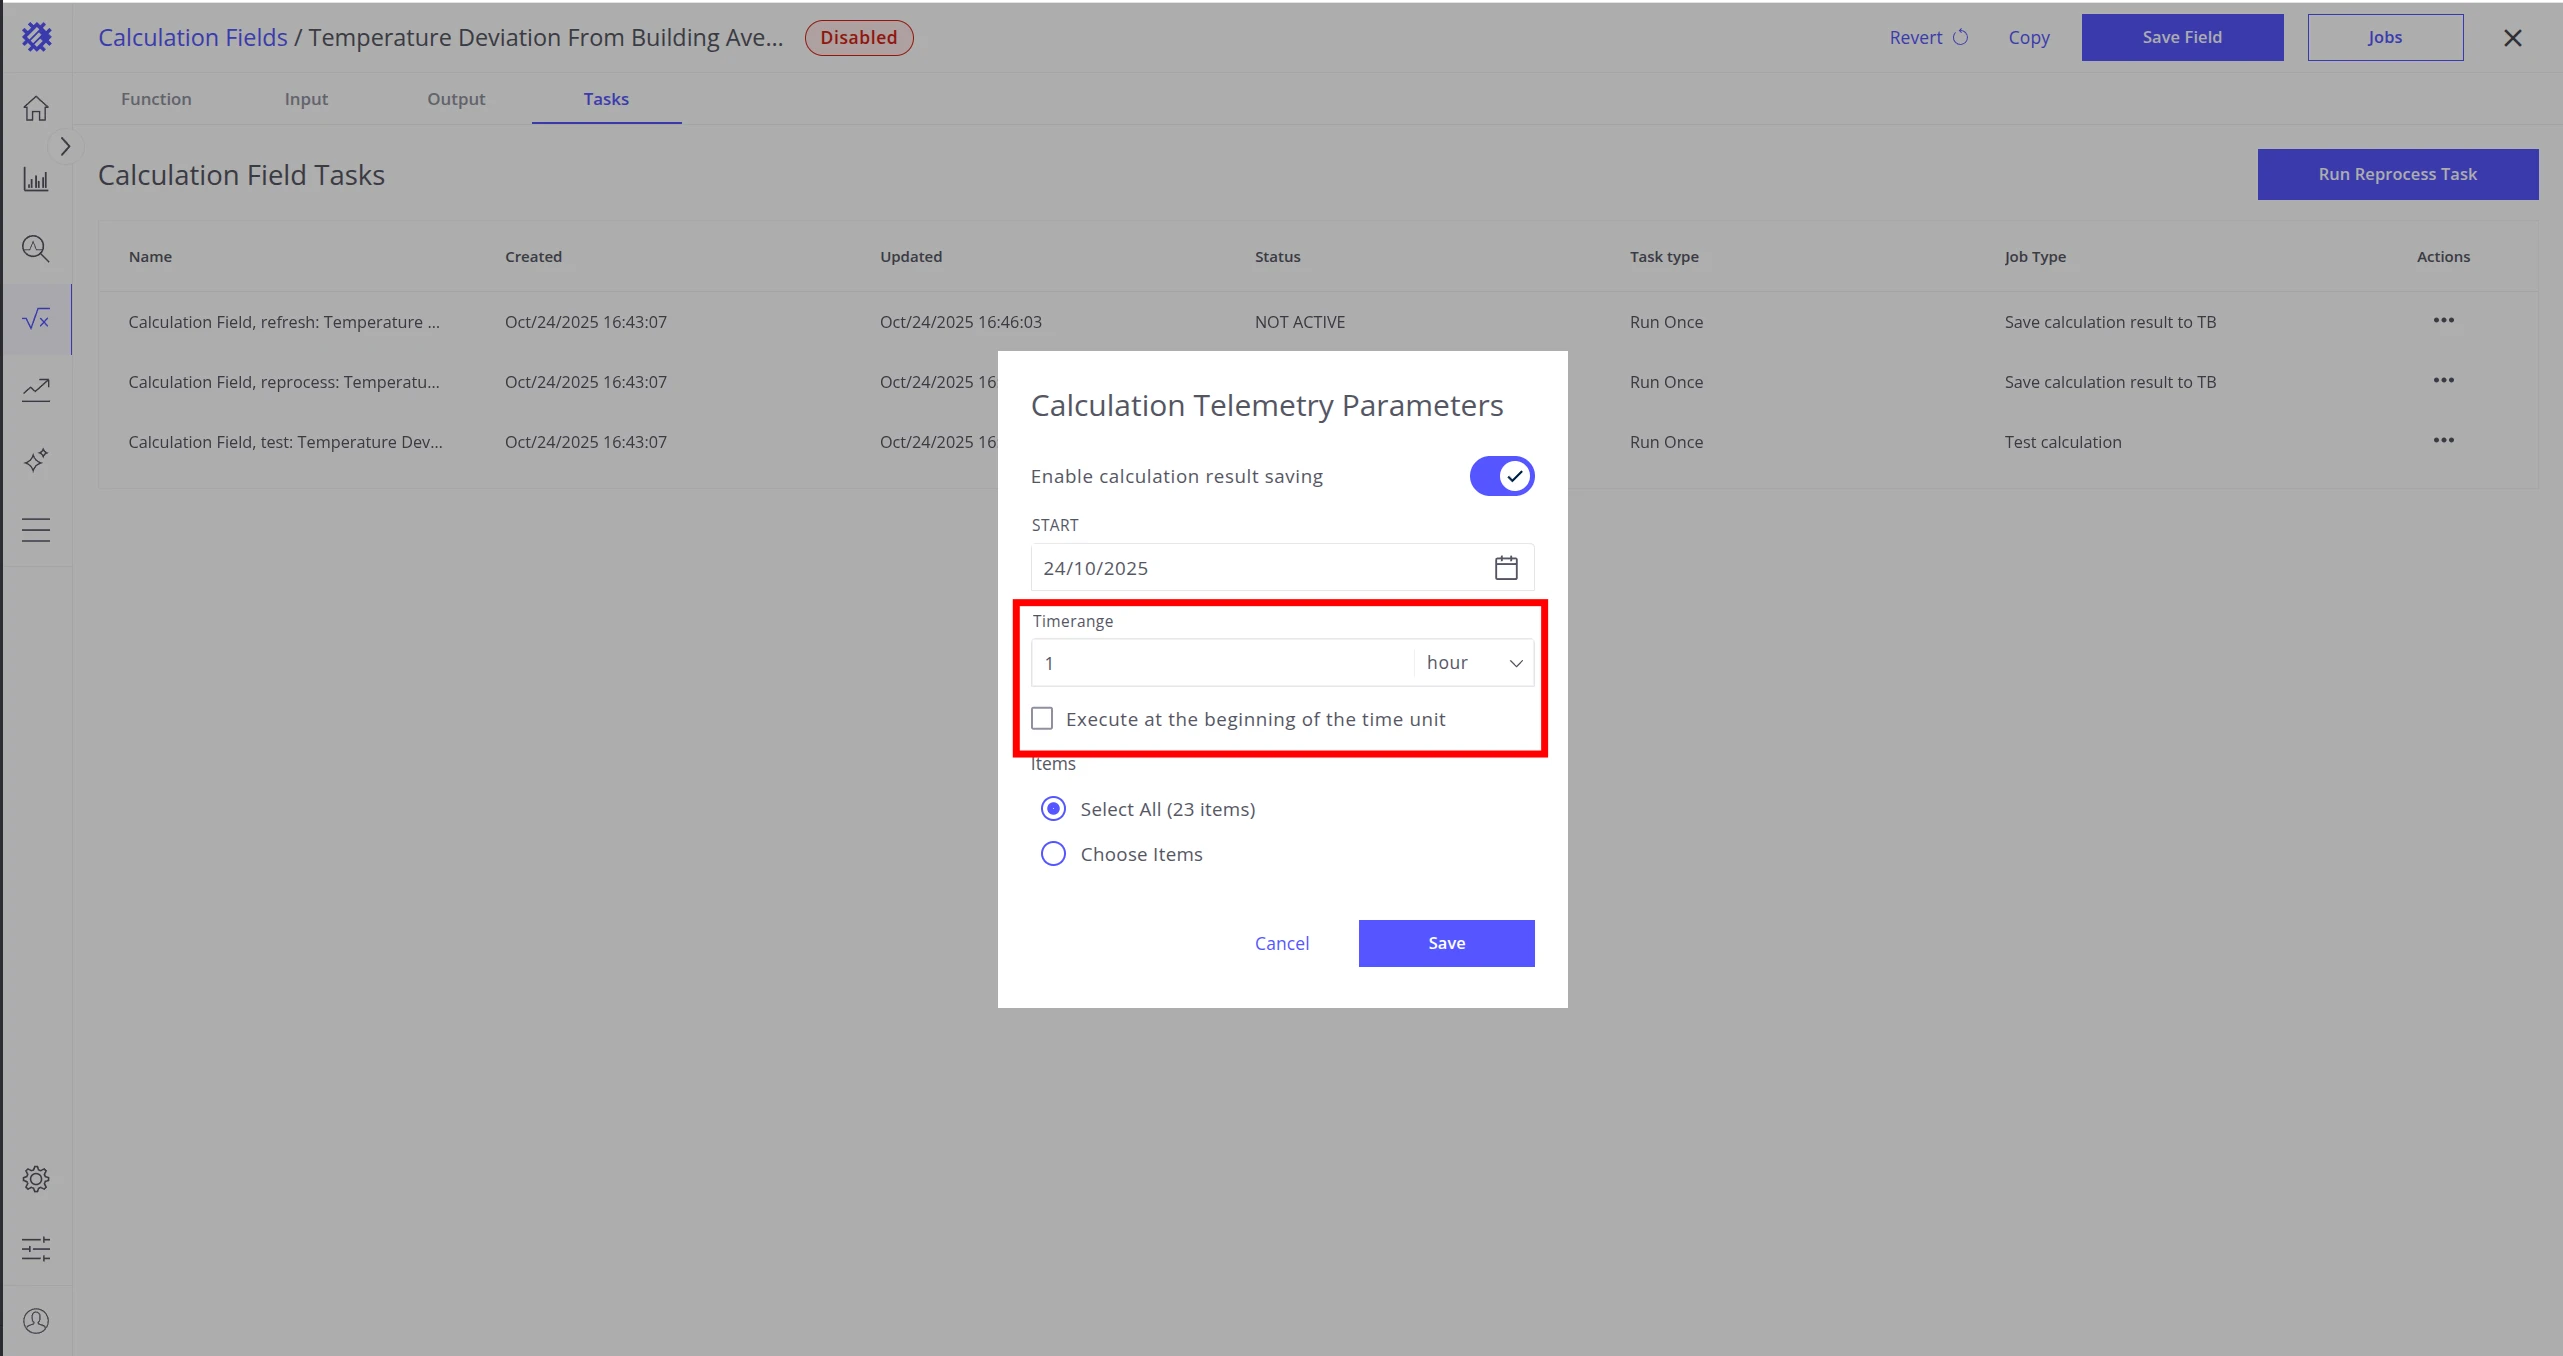
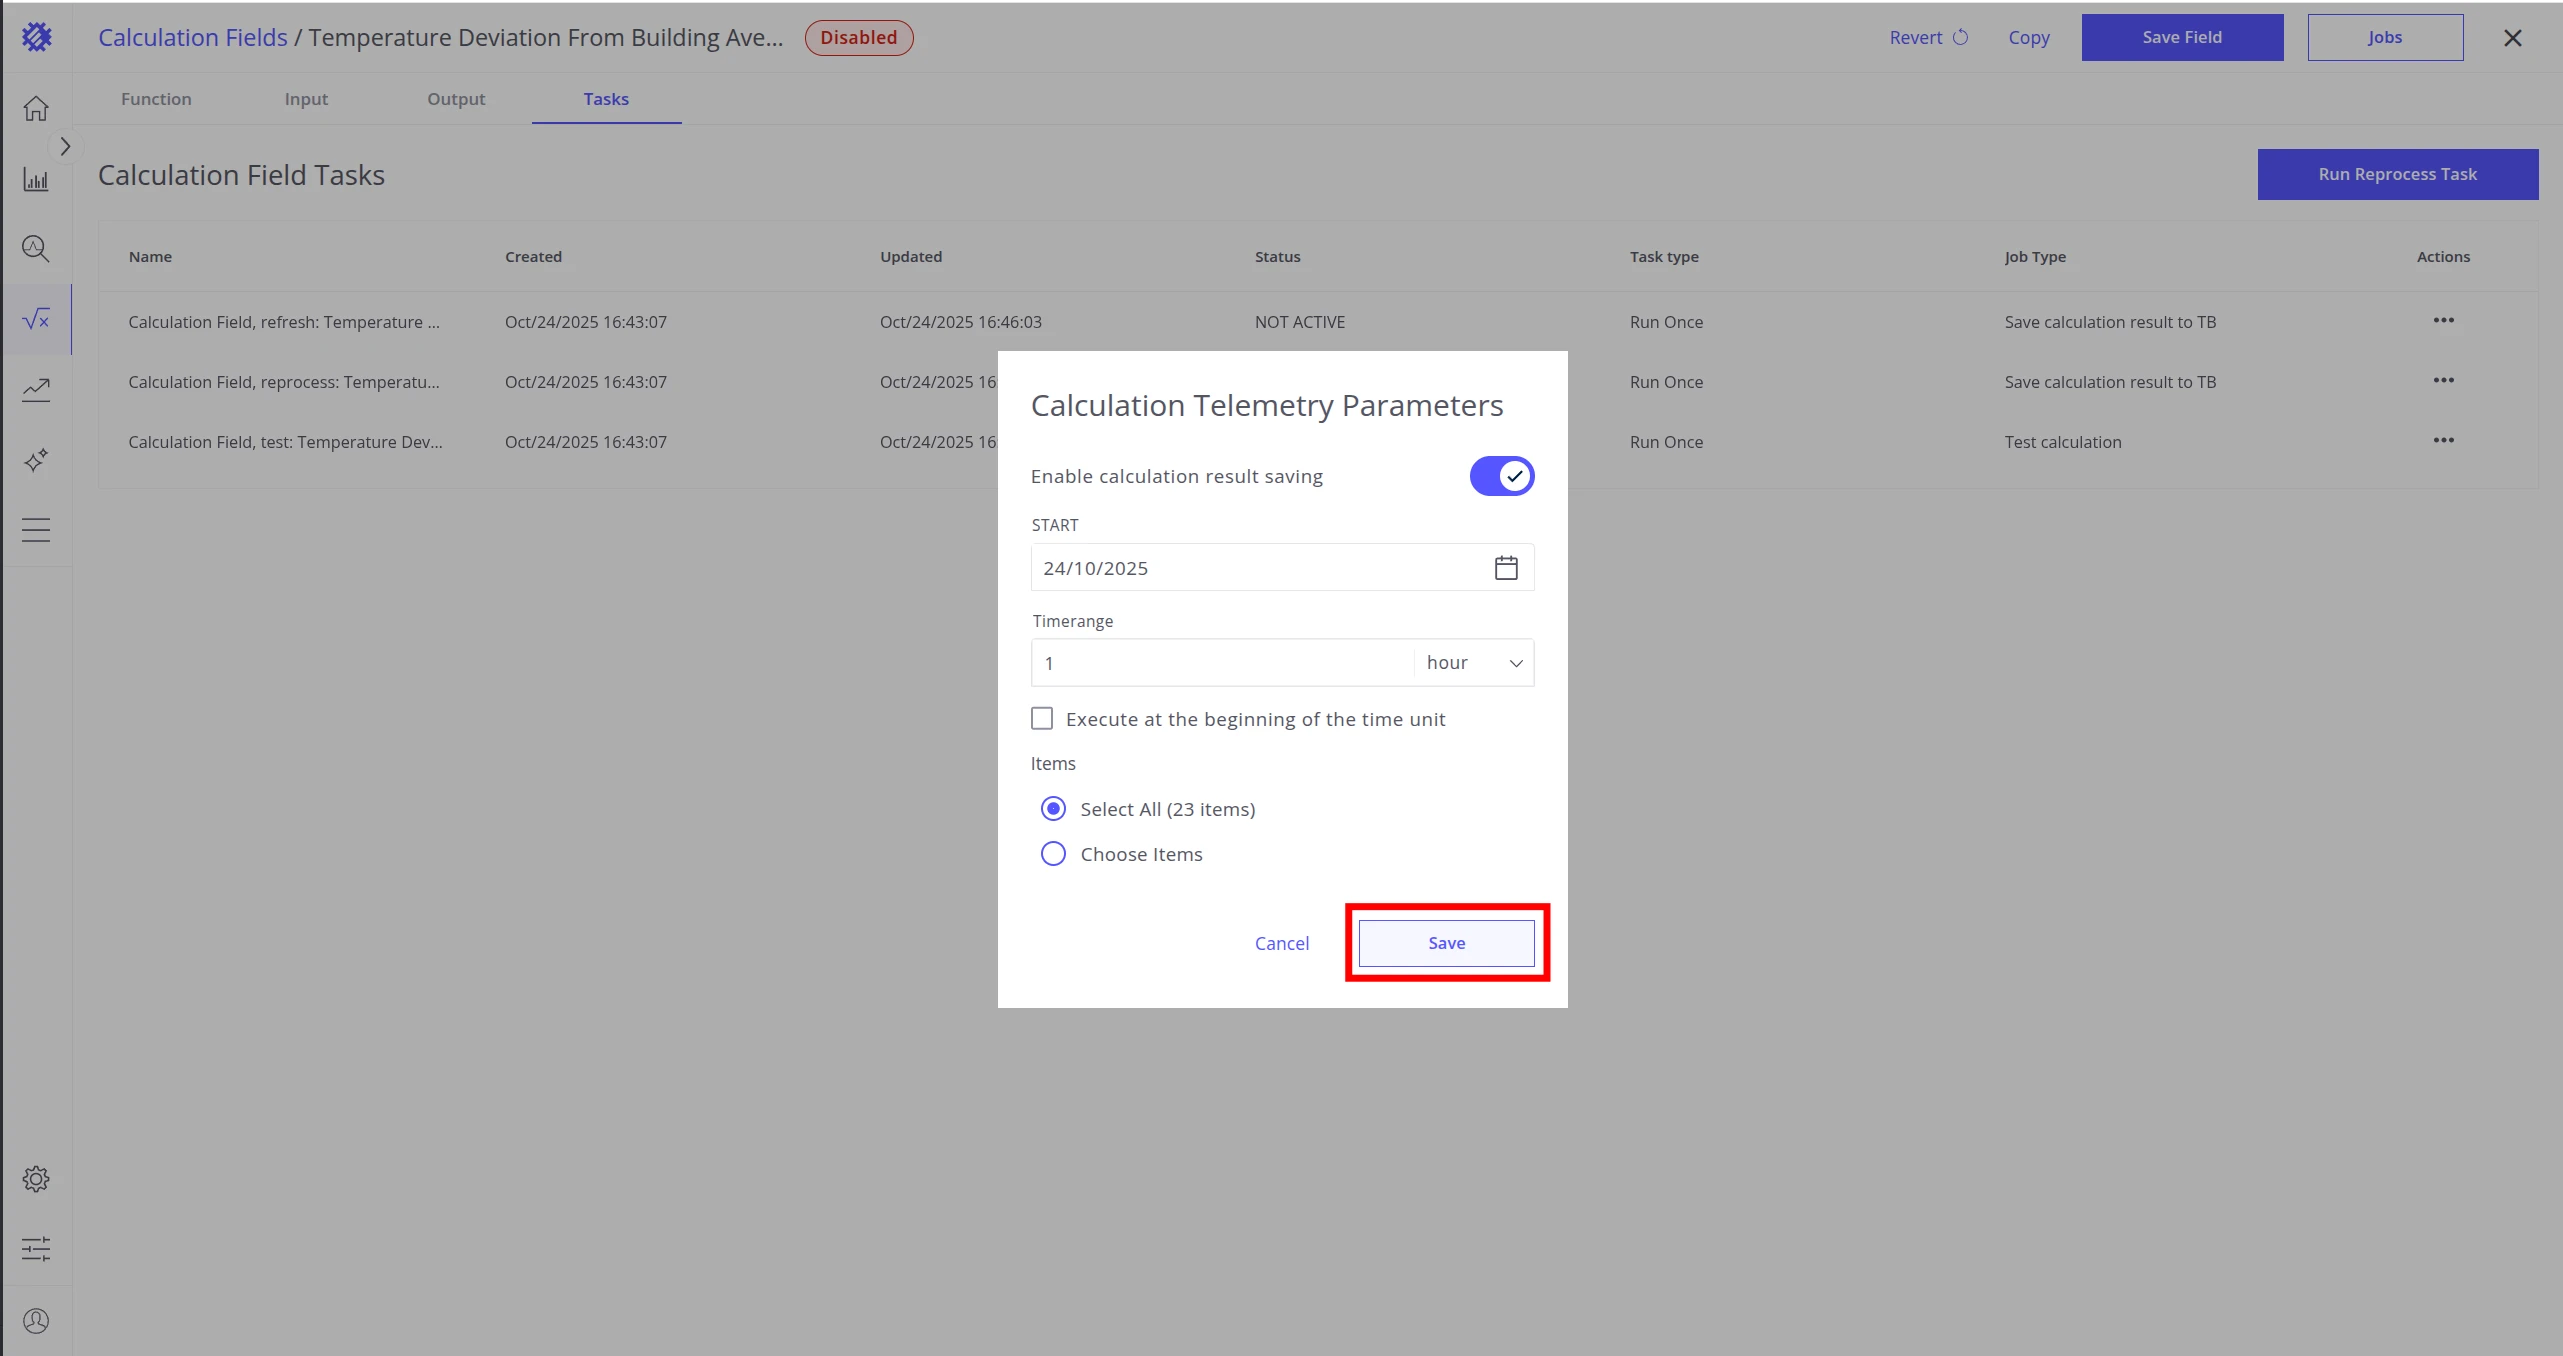
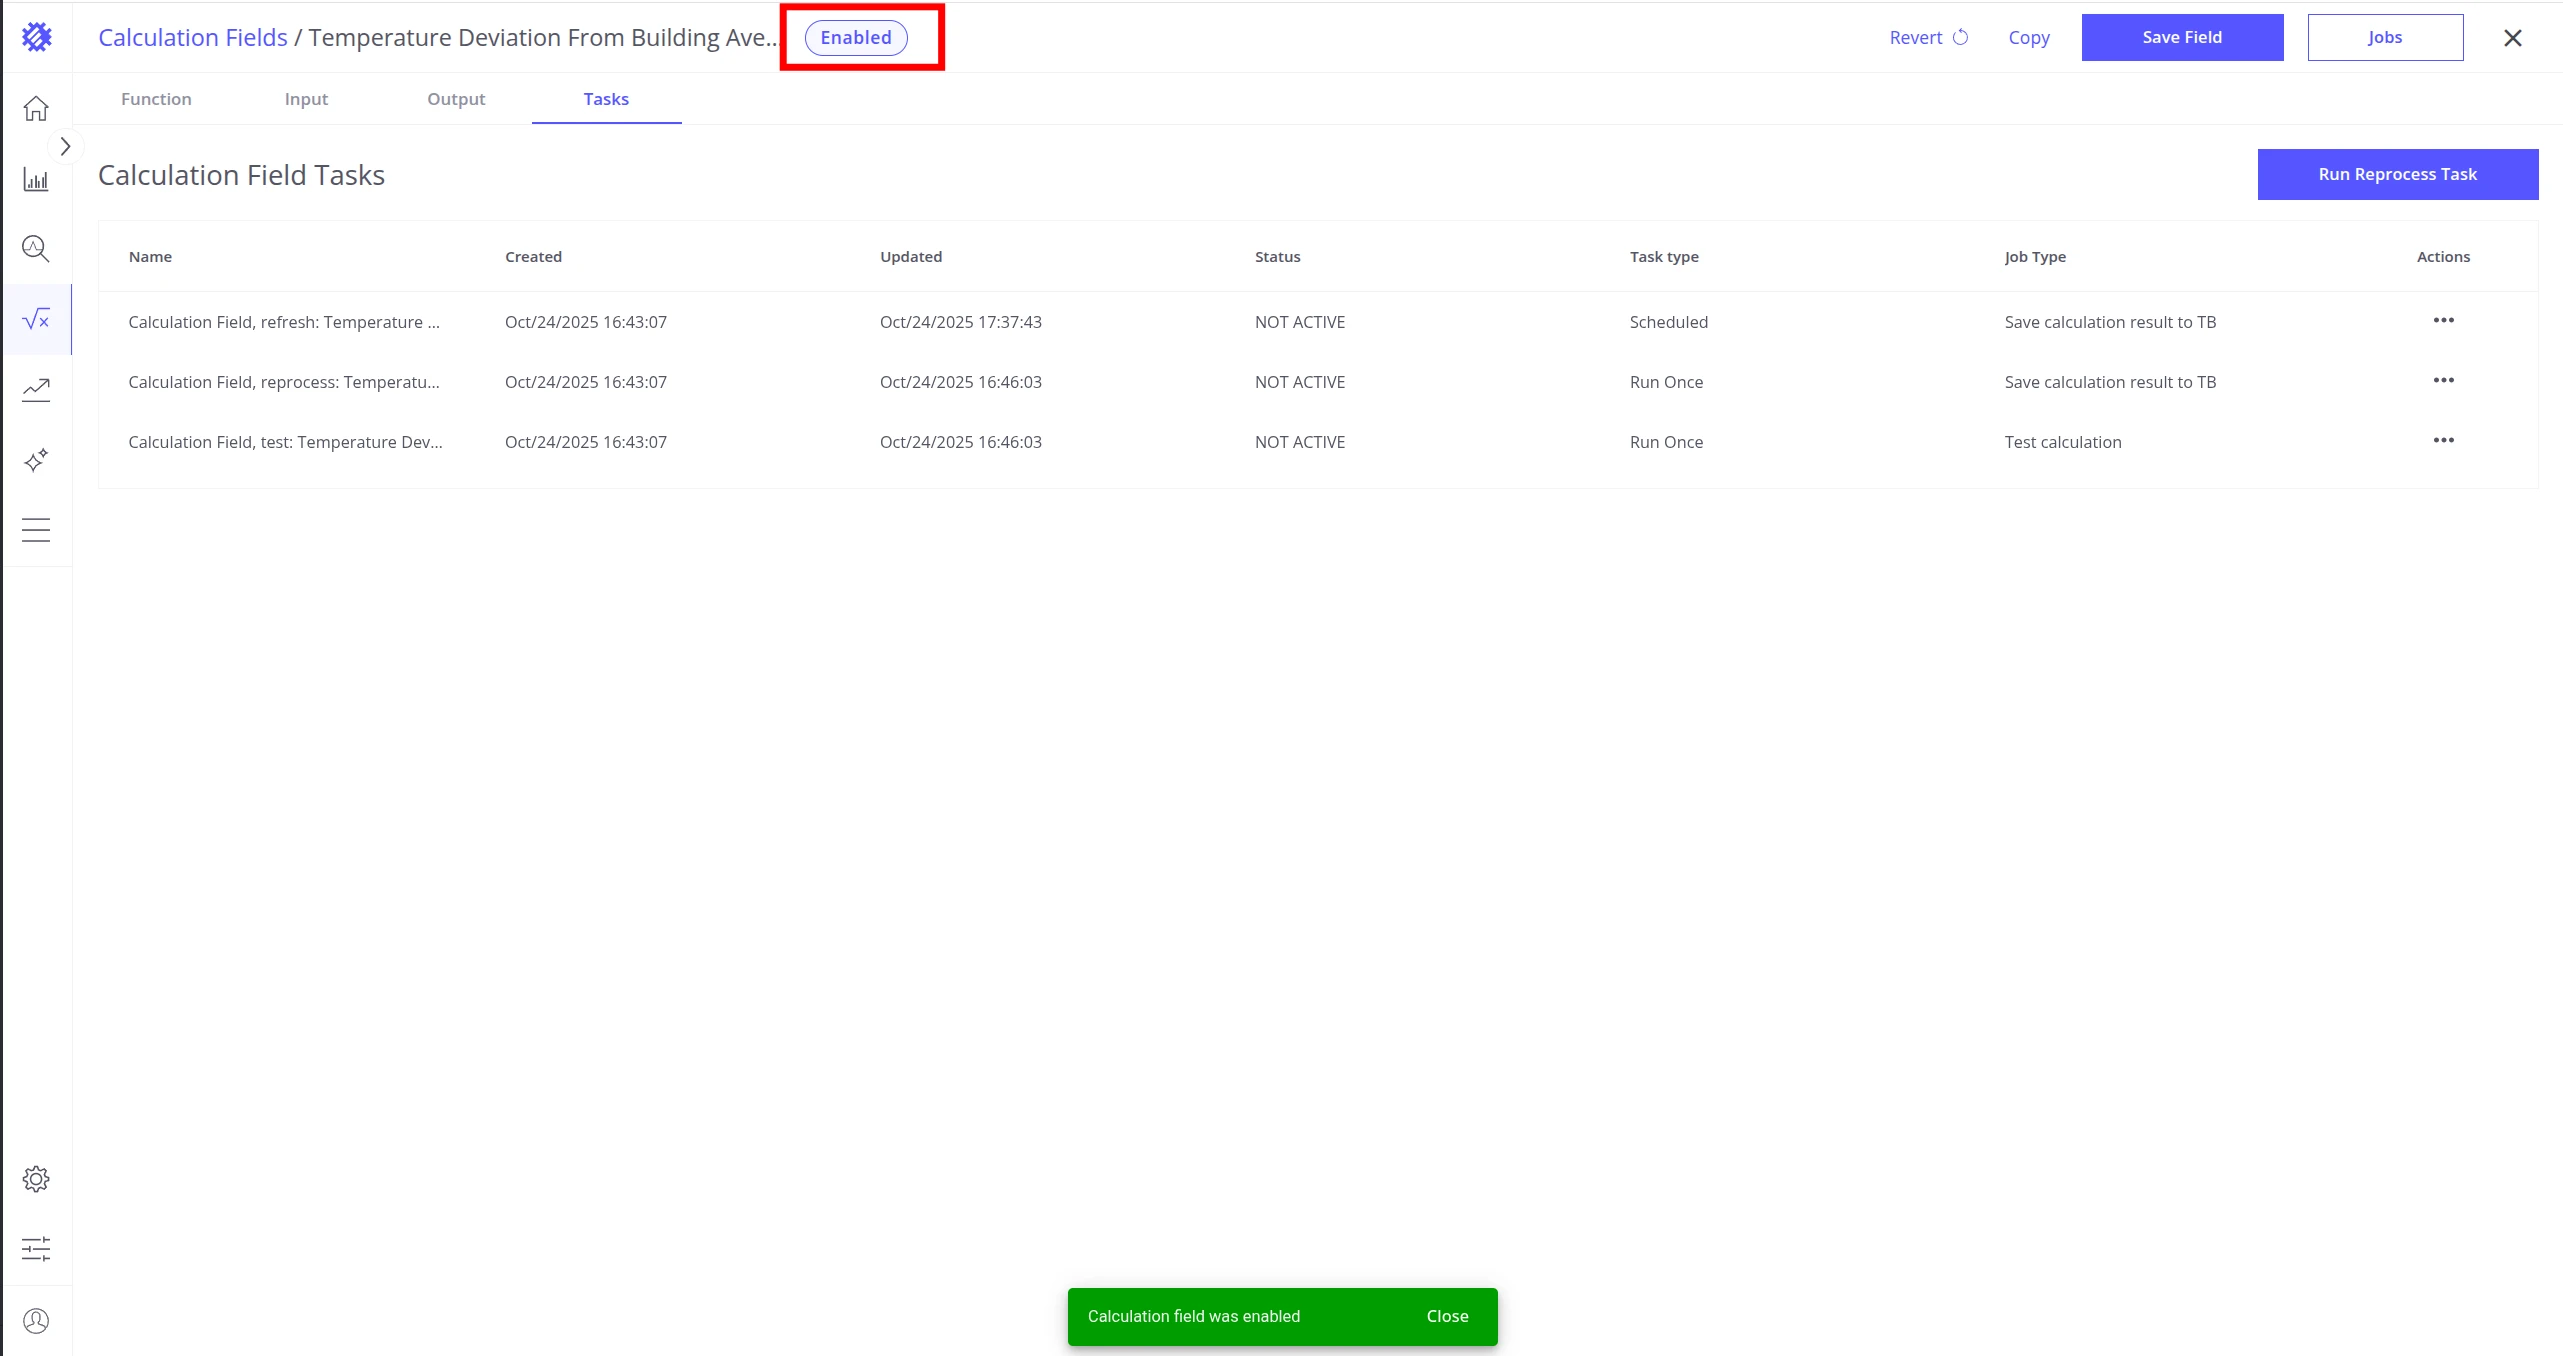
Once saved, the calculation shows an Enabled status. Telemetry will update automatically at the specified frequency for the selected entities.
Using saved telemetry in ThingsBoard
Section titled “Using saved telemetry in ThingsBoard”Once the refresh and reprocess jobs are running, the calculated telemetry is continuously updated in ThingsBoard and available everywhere telemetry is supported.
Alarm rules
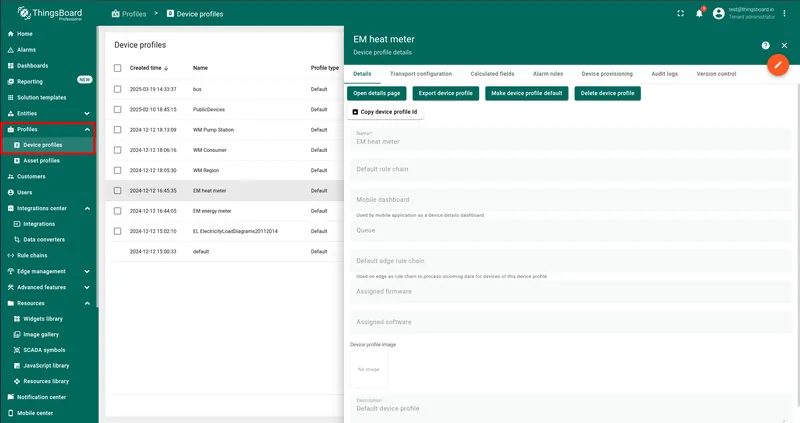
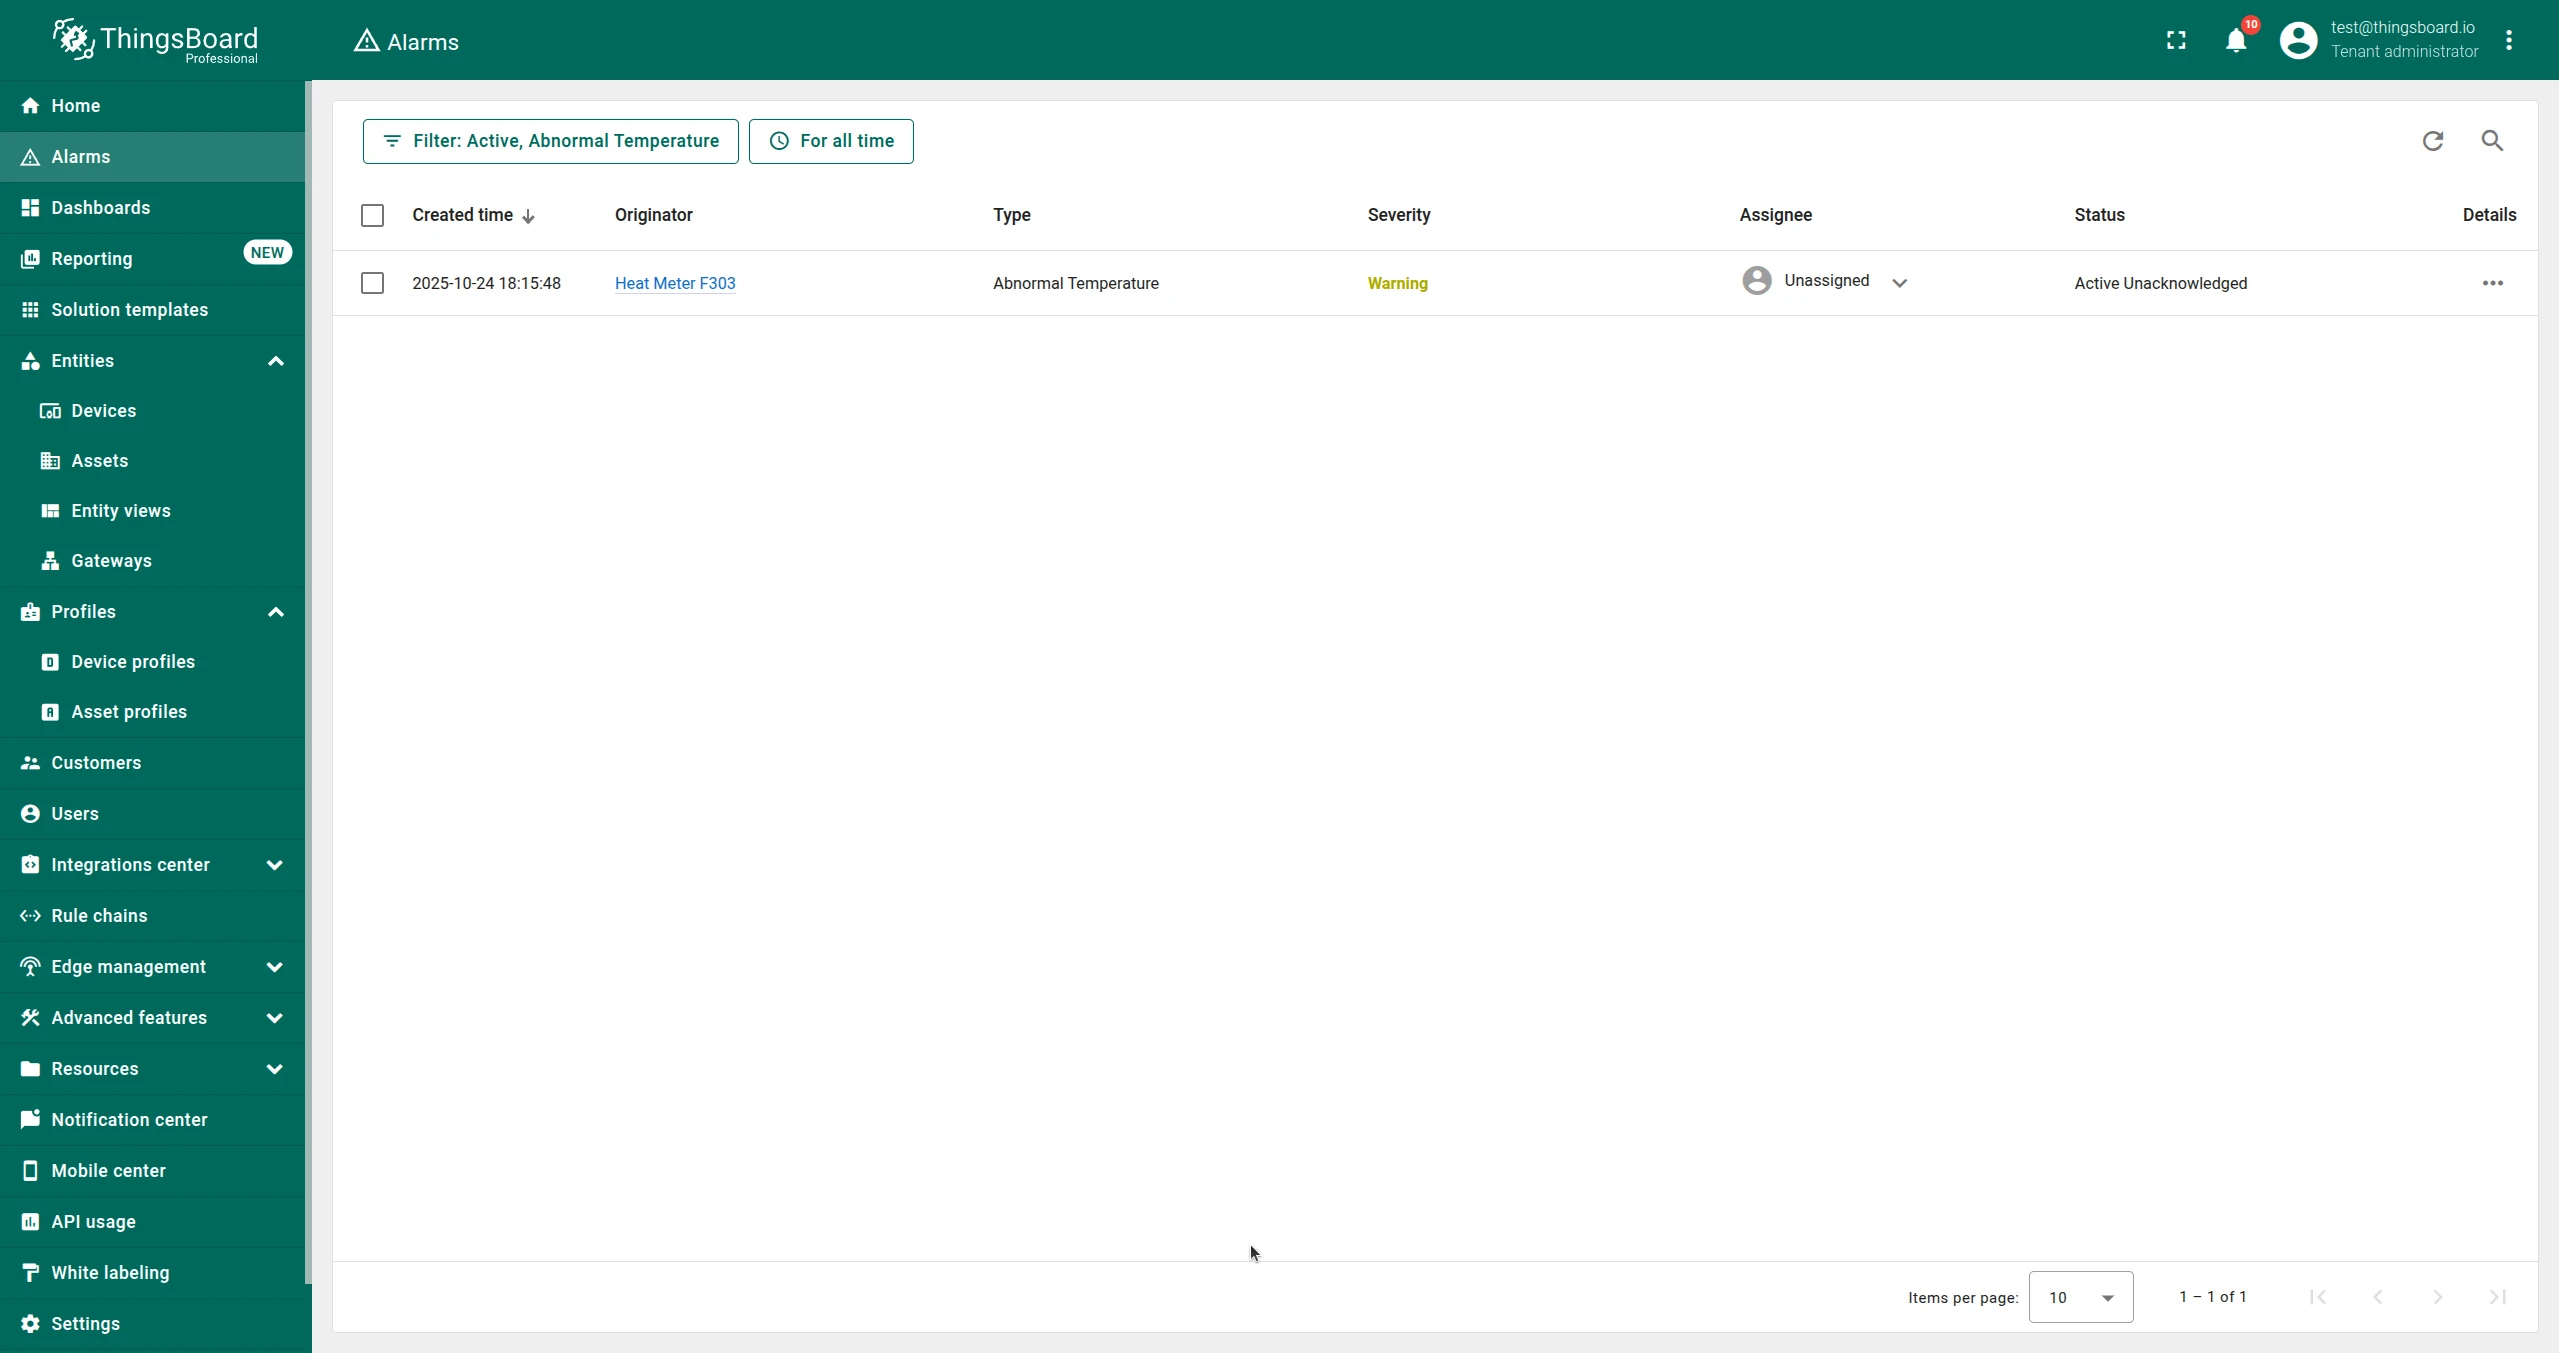
Section titled “Alarm rules”You can create alarm rules based on the calculated telemetry key (_ECD_{KEY}) directly in the entity profile.
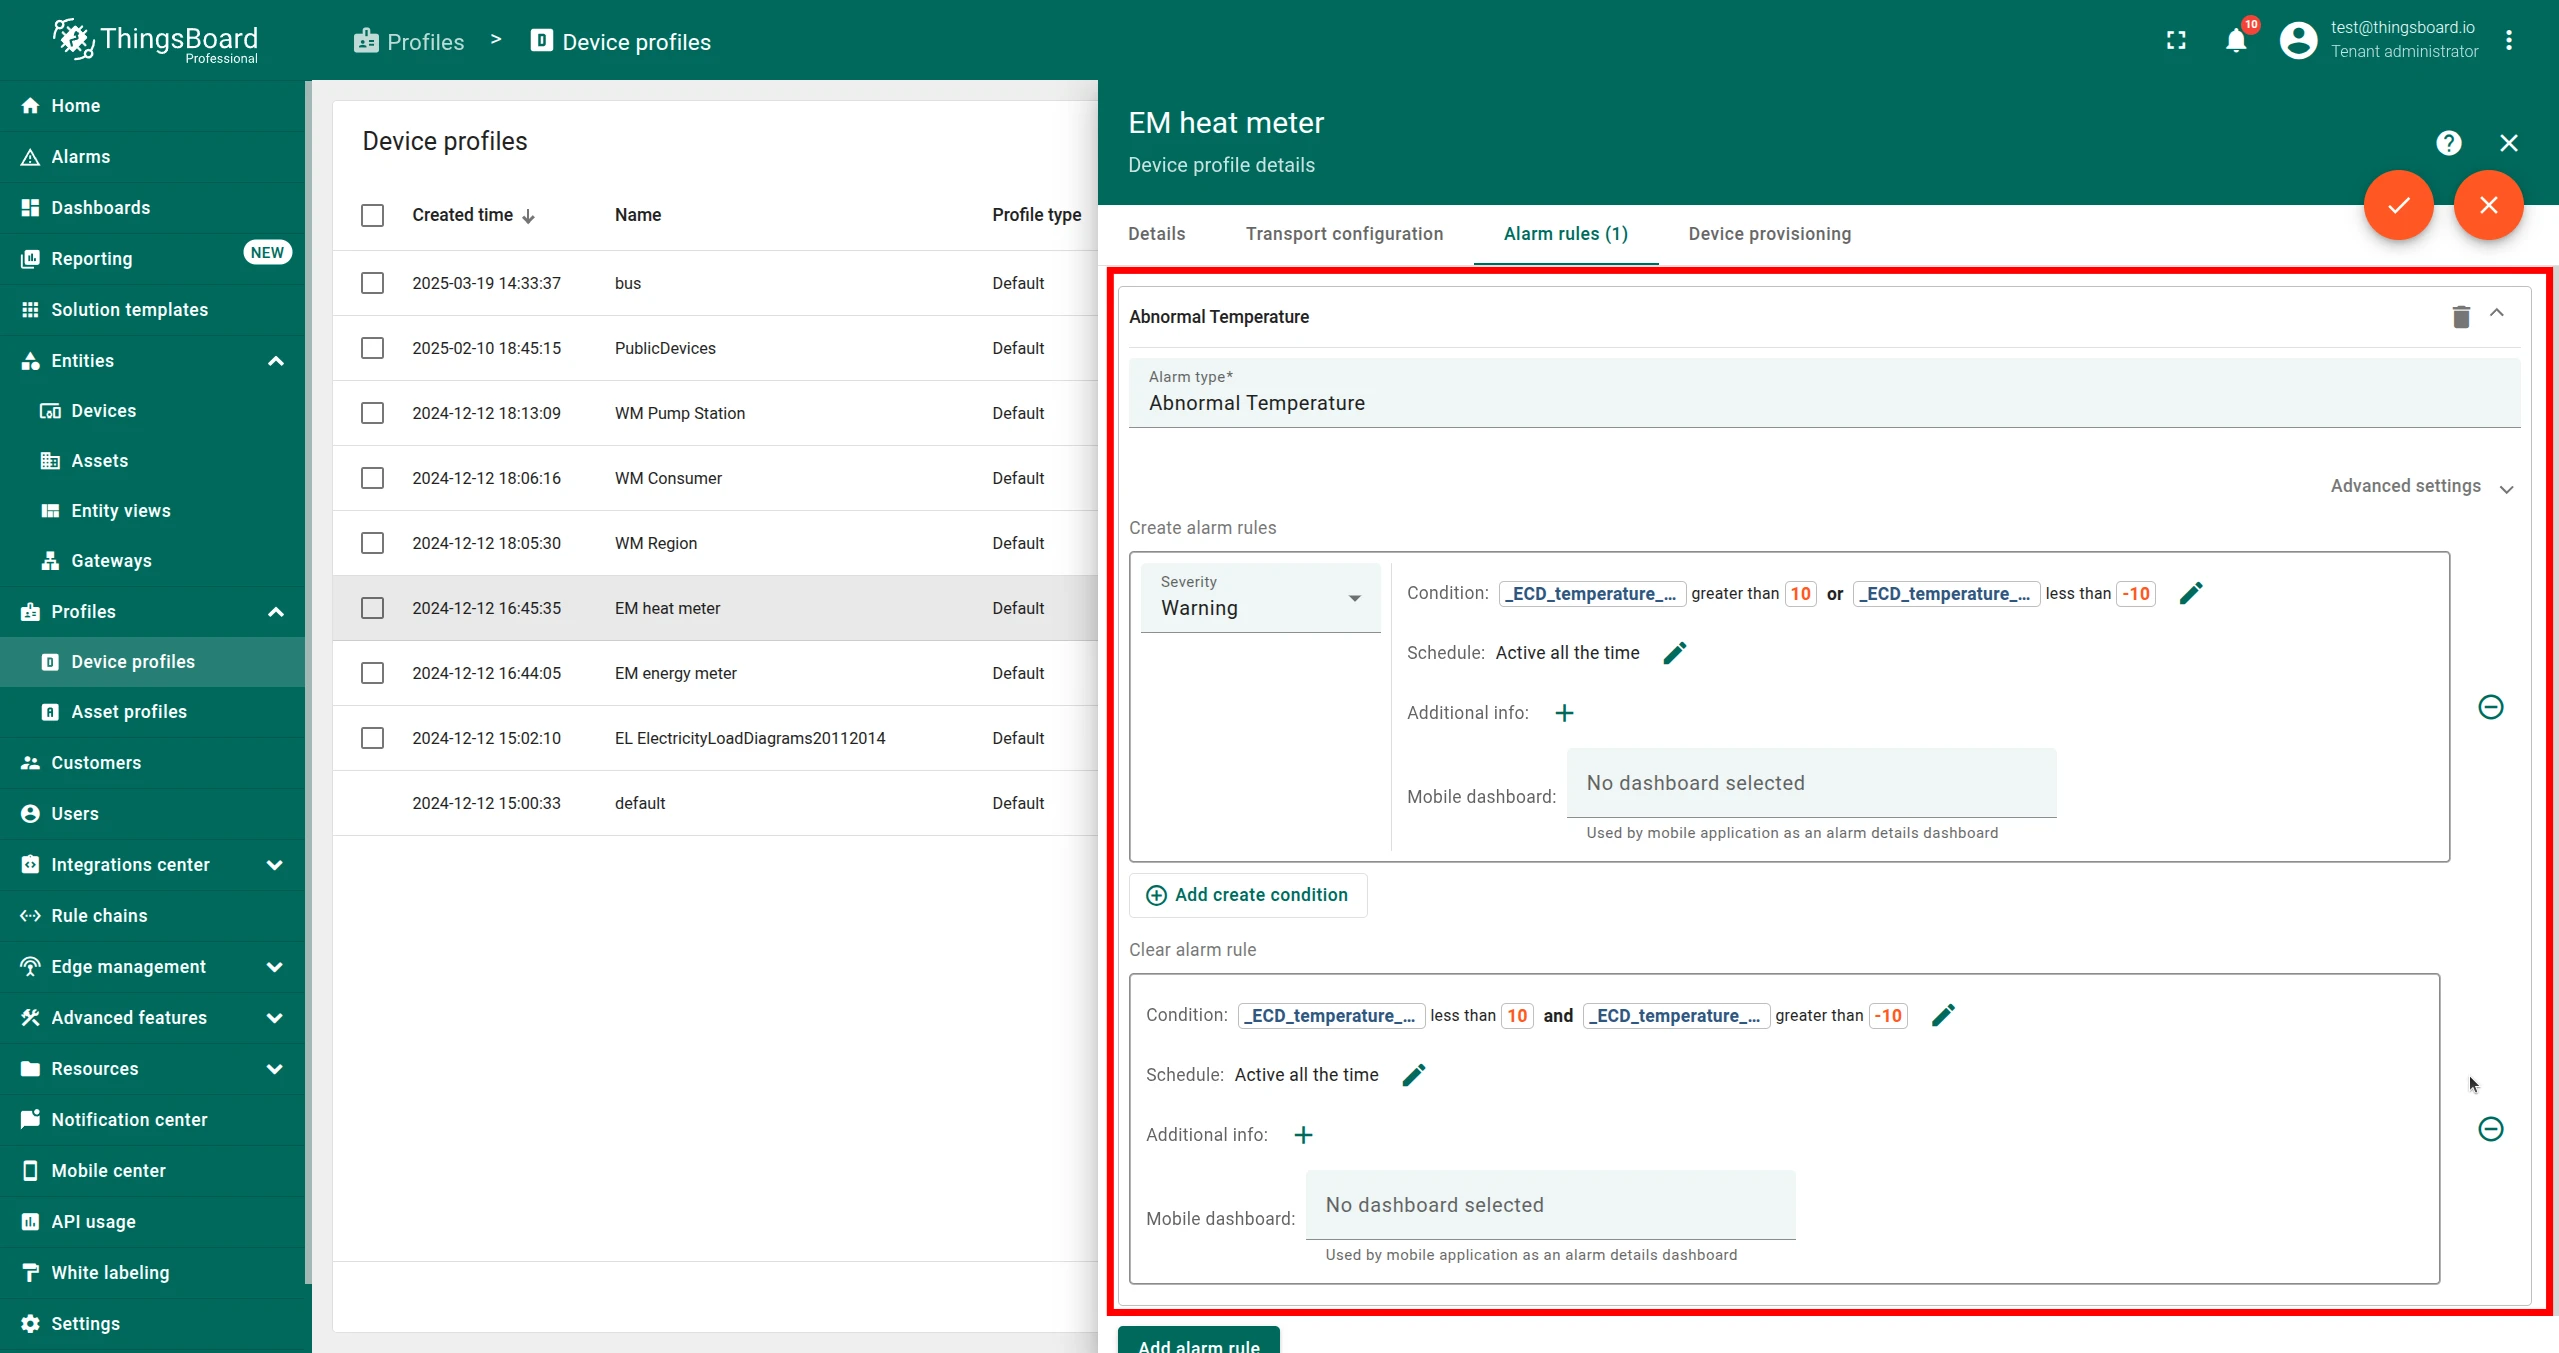
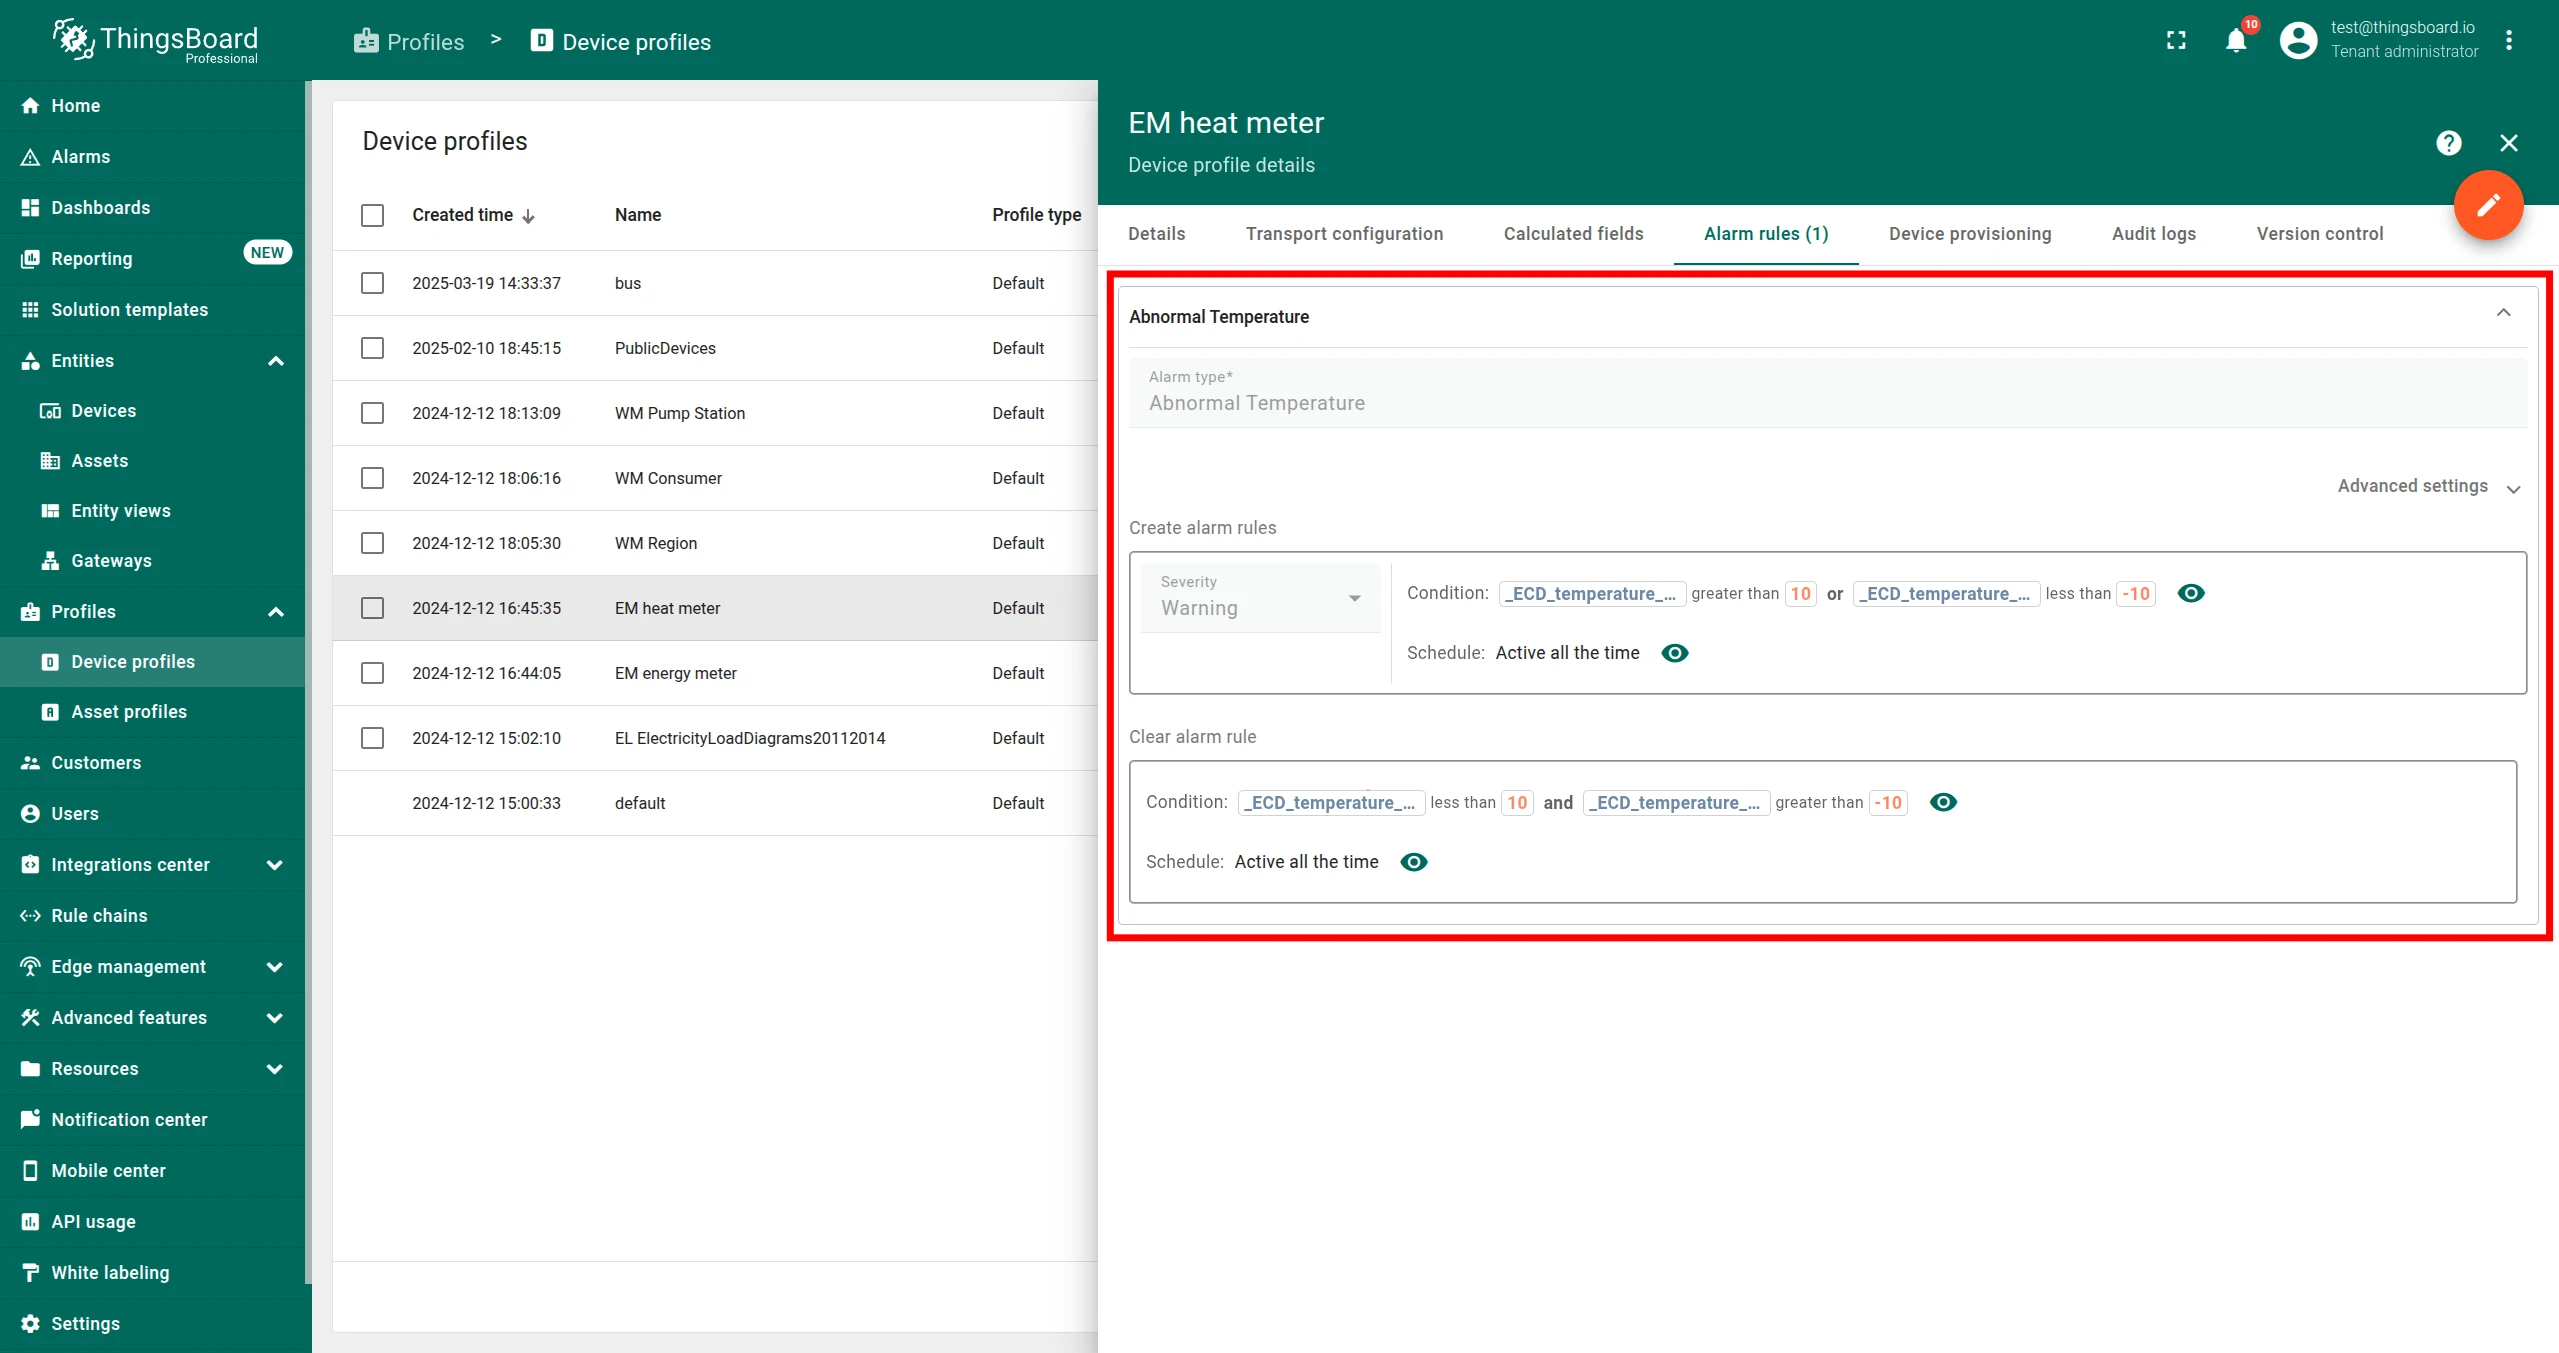
Example: A calculation produces temperature deviation values for each sensor relative to the building average. When the deviation exceeds 10°, an alarm is triggered. When it falls back below the threshold, the alarm is cleared.
-
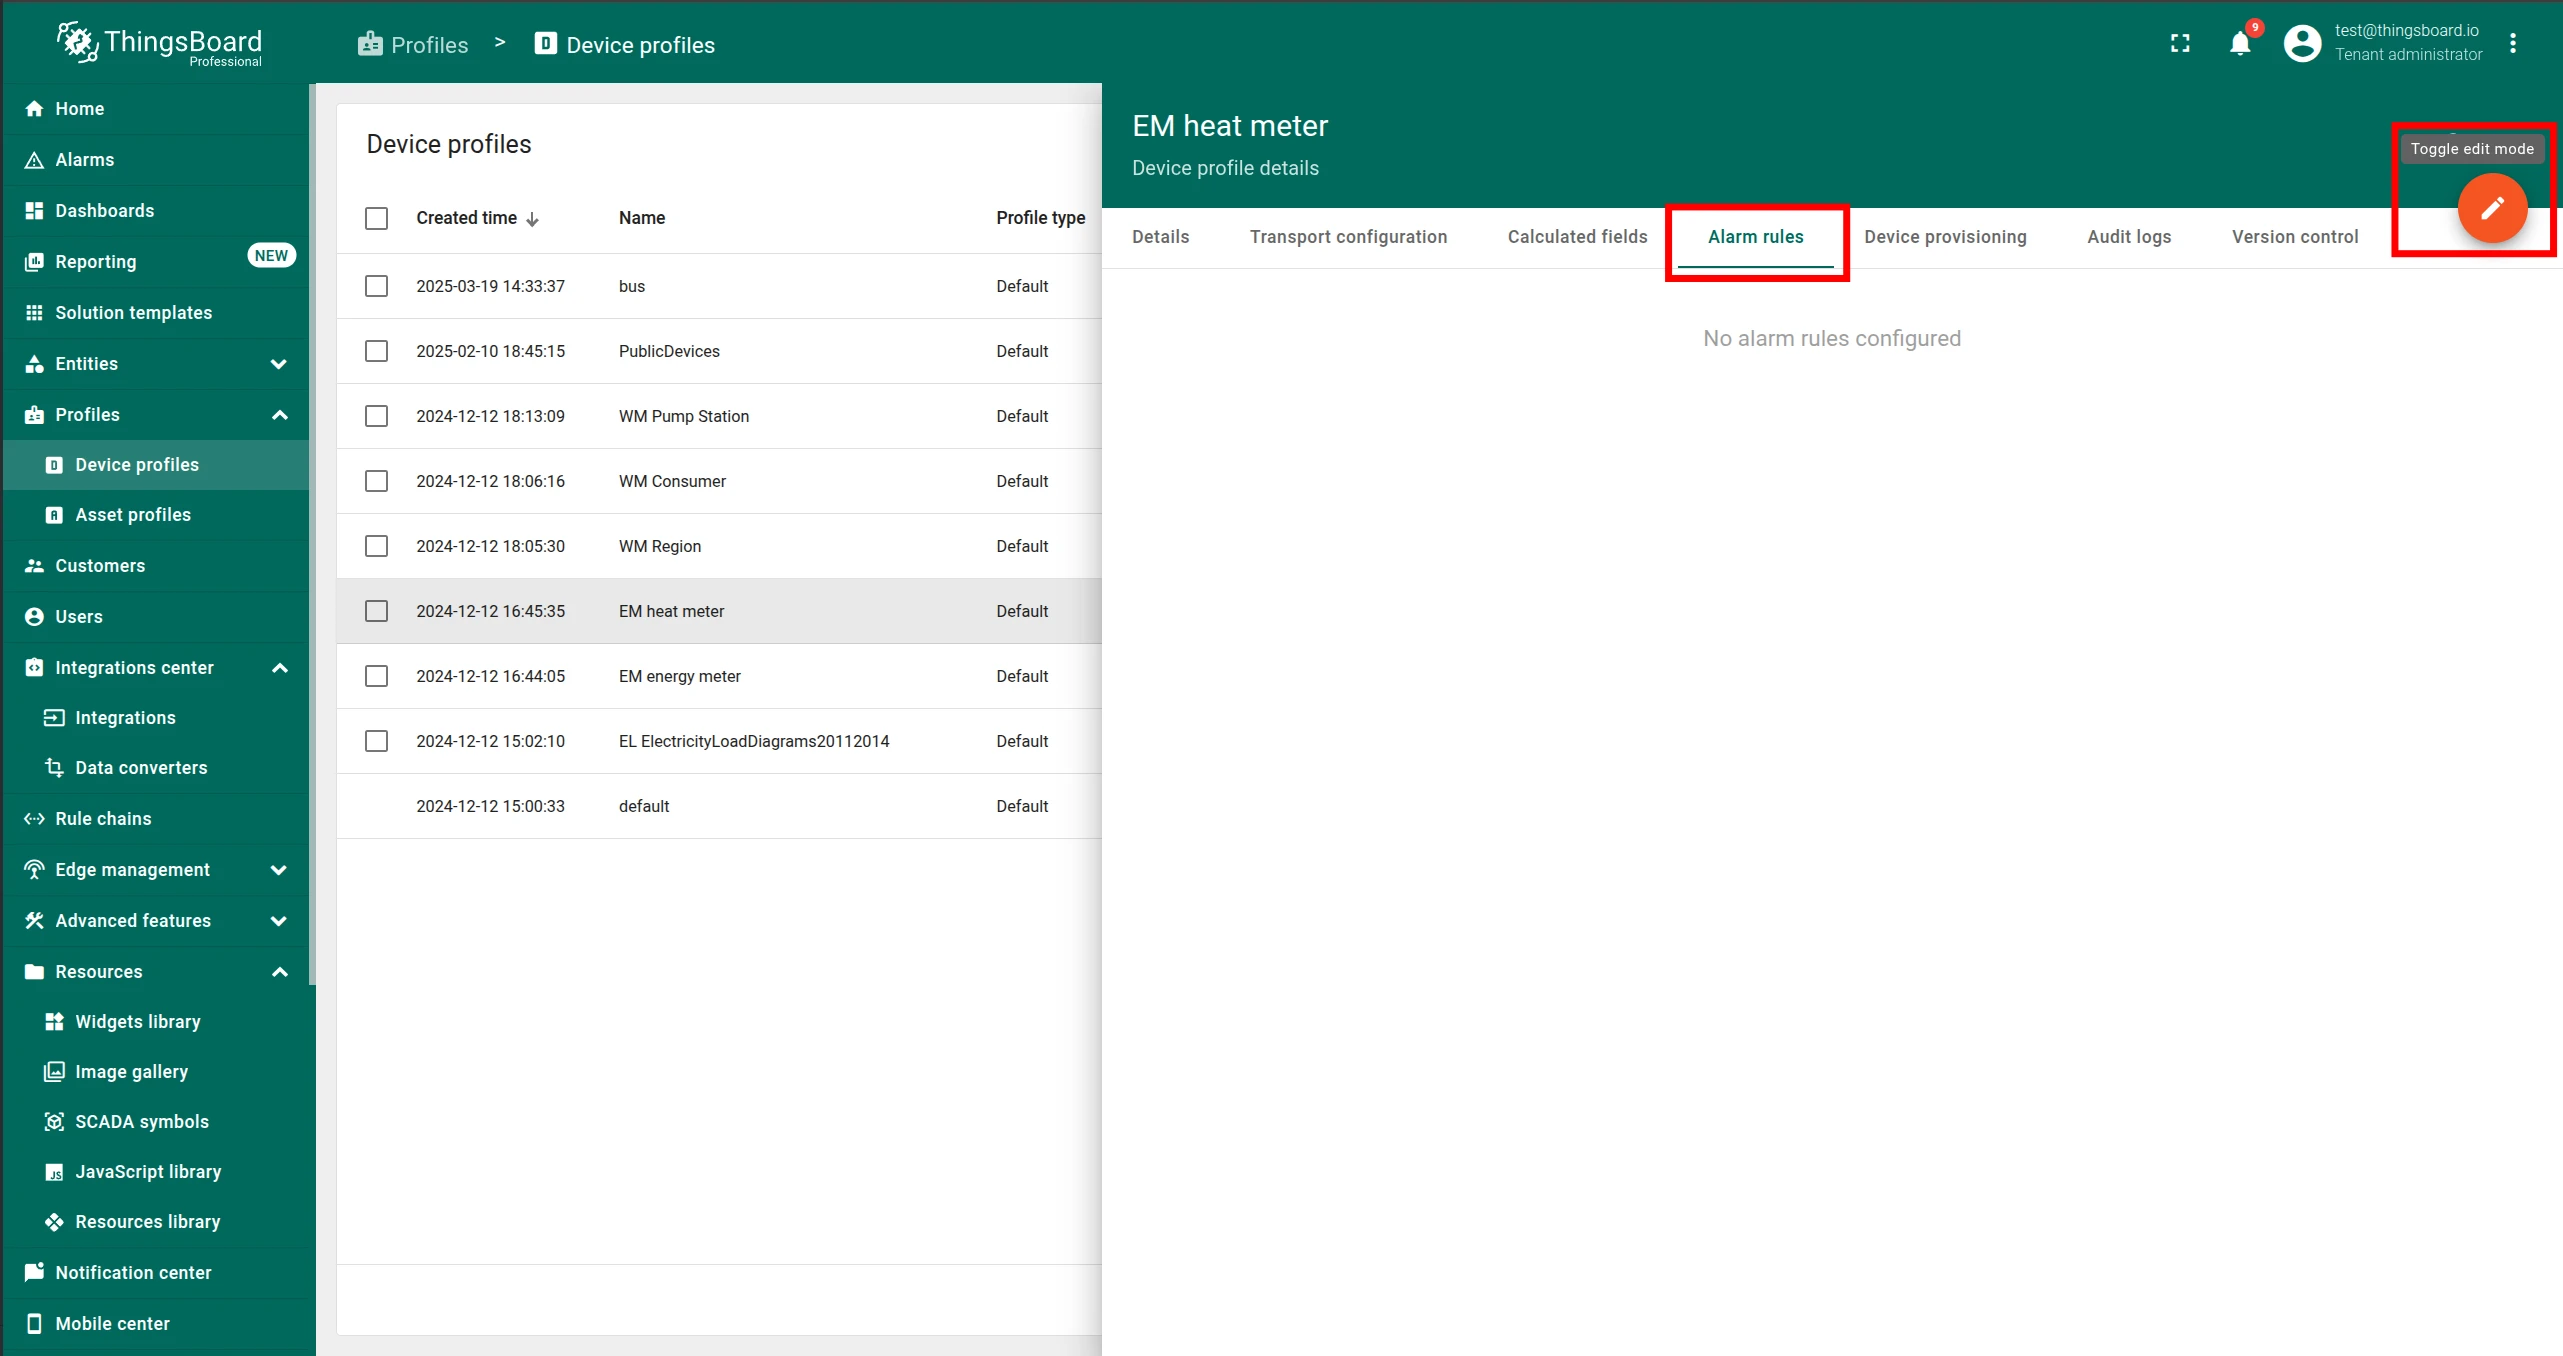
Open the entity profile where the calculation is created.
-
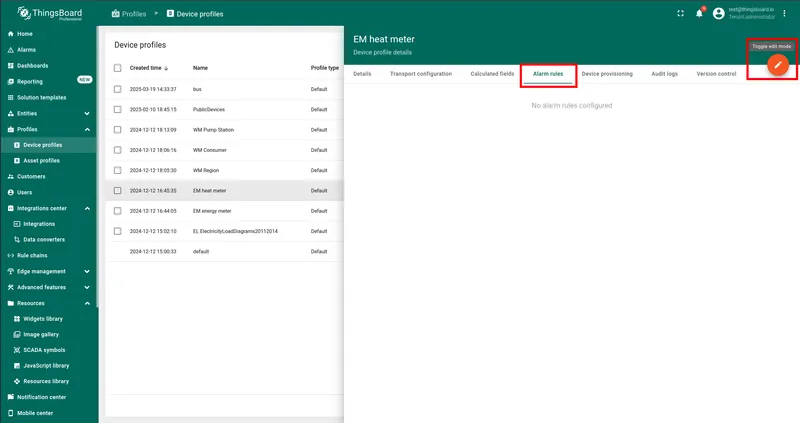
Navigate to Alarm Rules and toggle Edit mode.
-
Click Add alarm rule and configure the create and clear conditions using the
_ECD_telemetry key.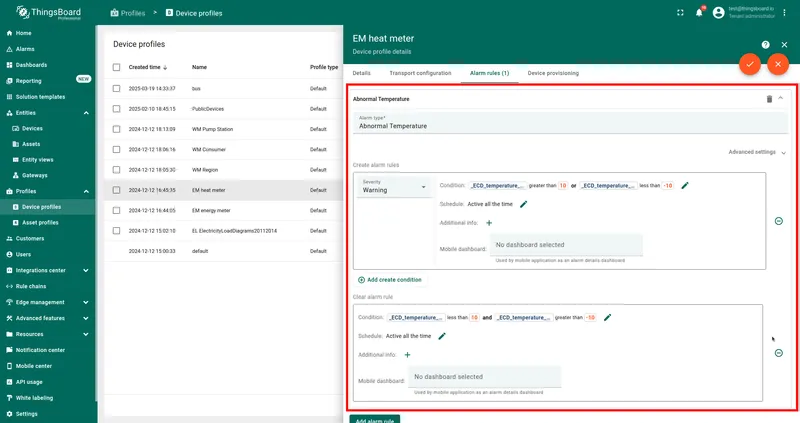
-
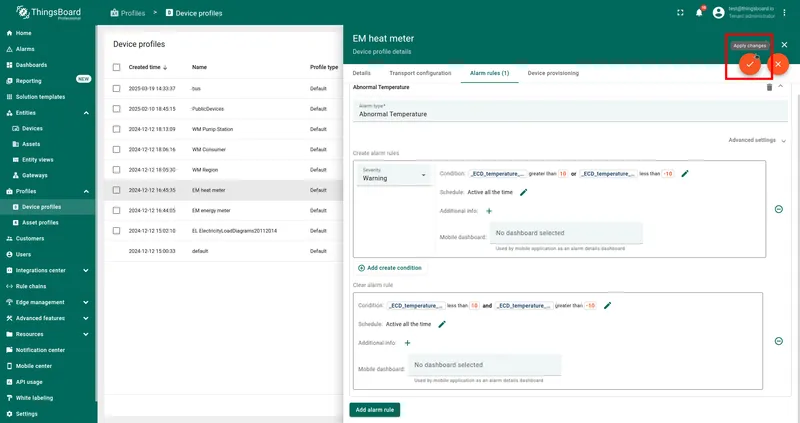
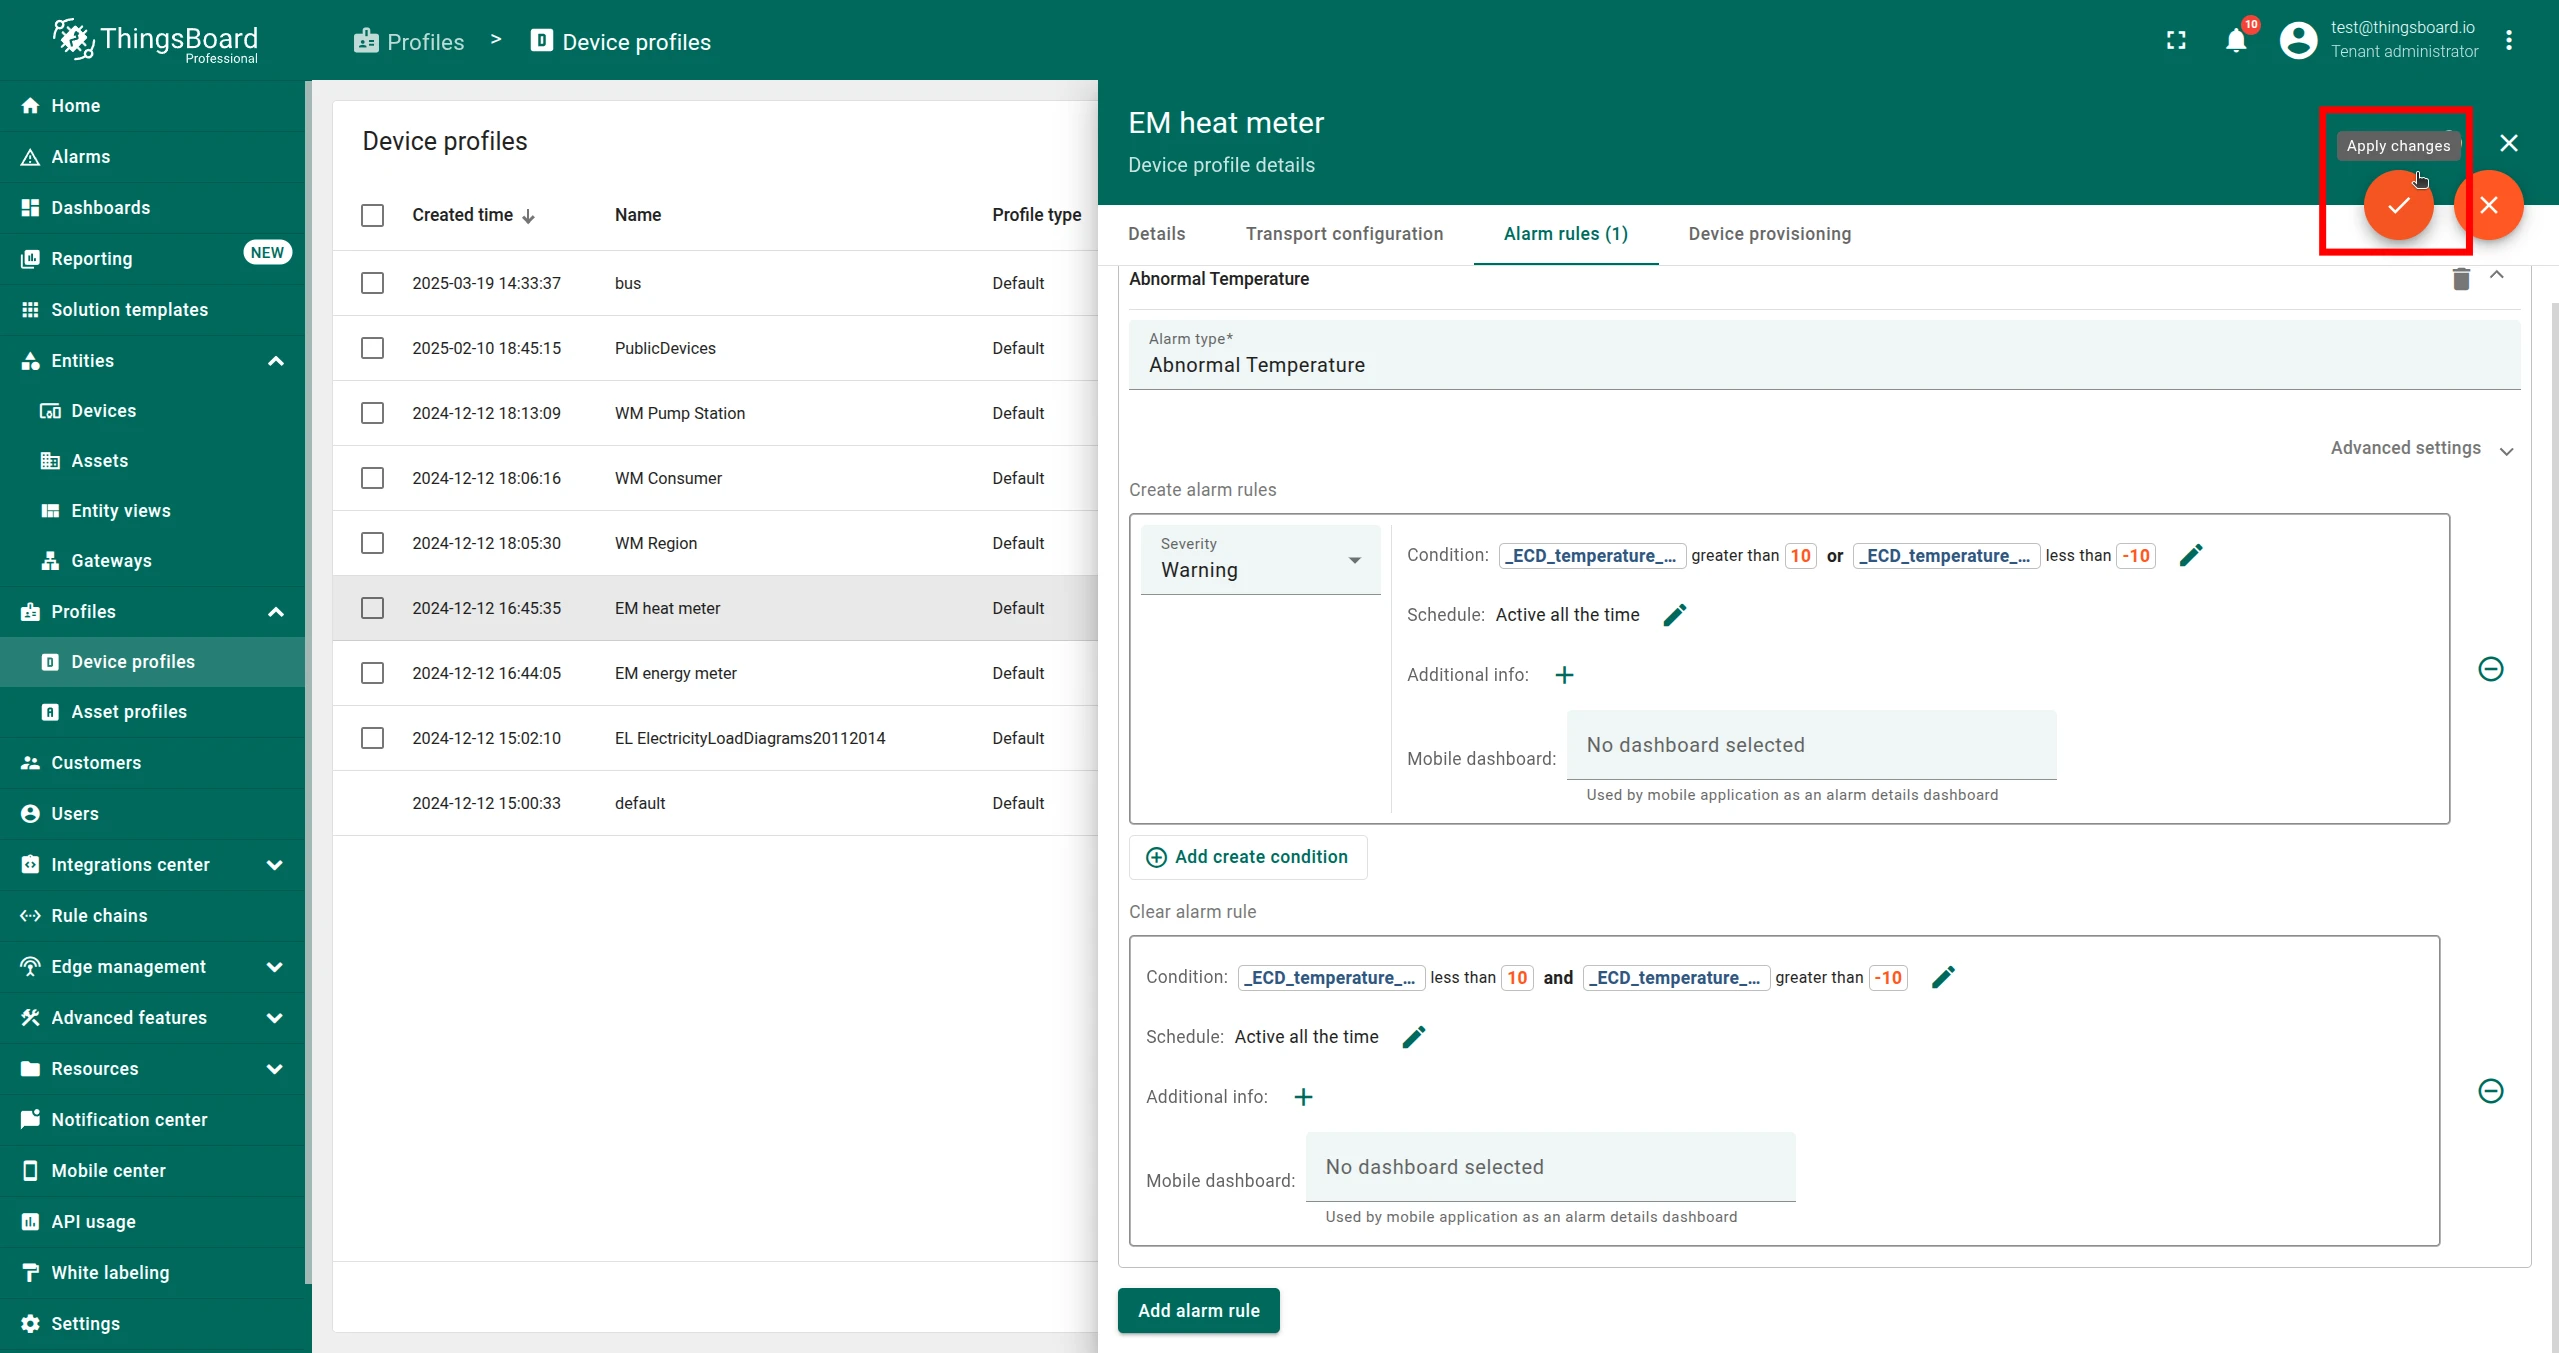
Click Apply changes.
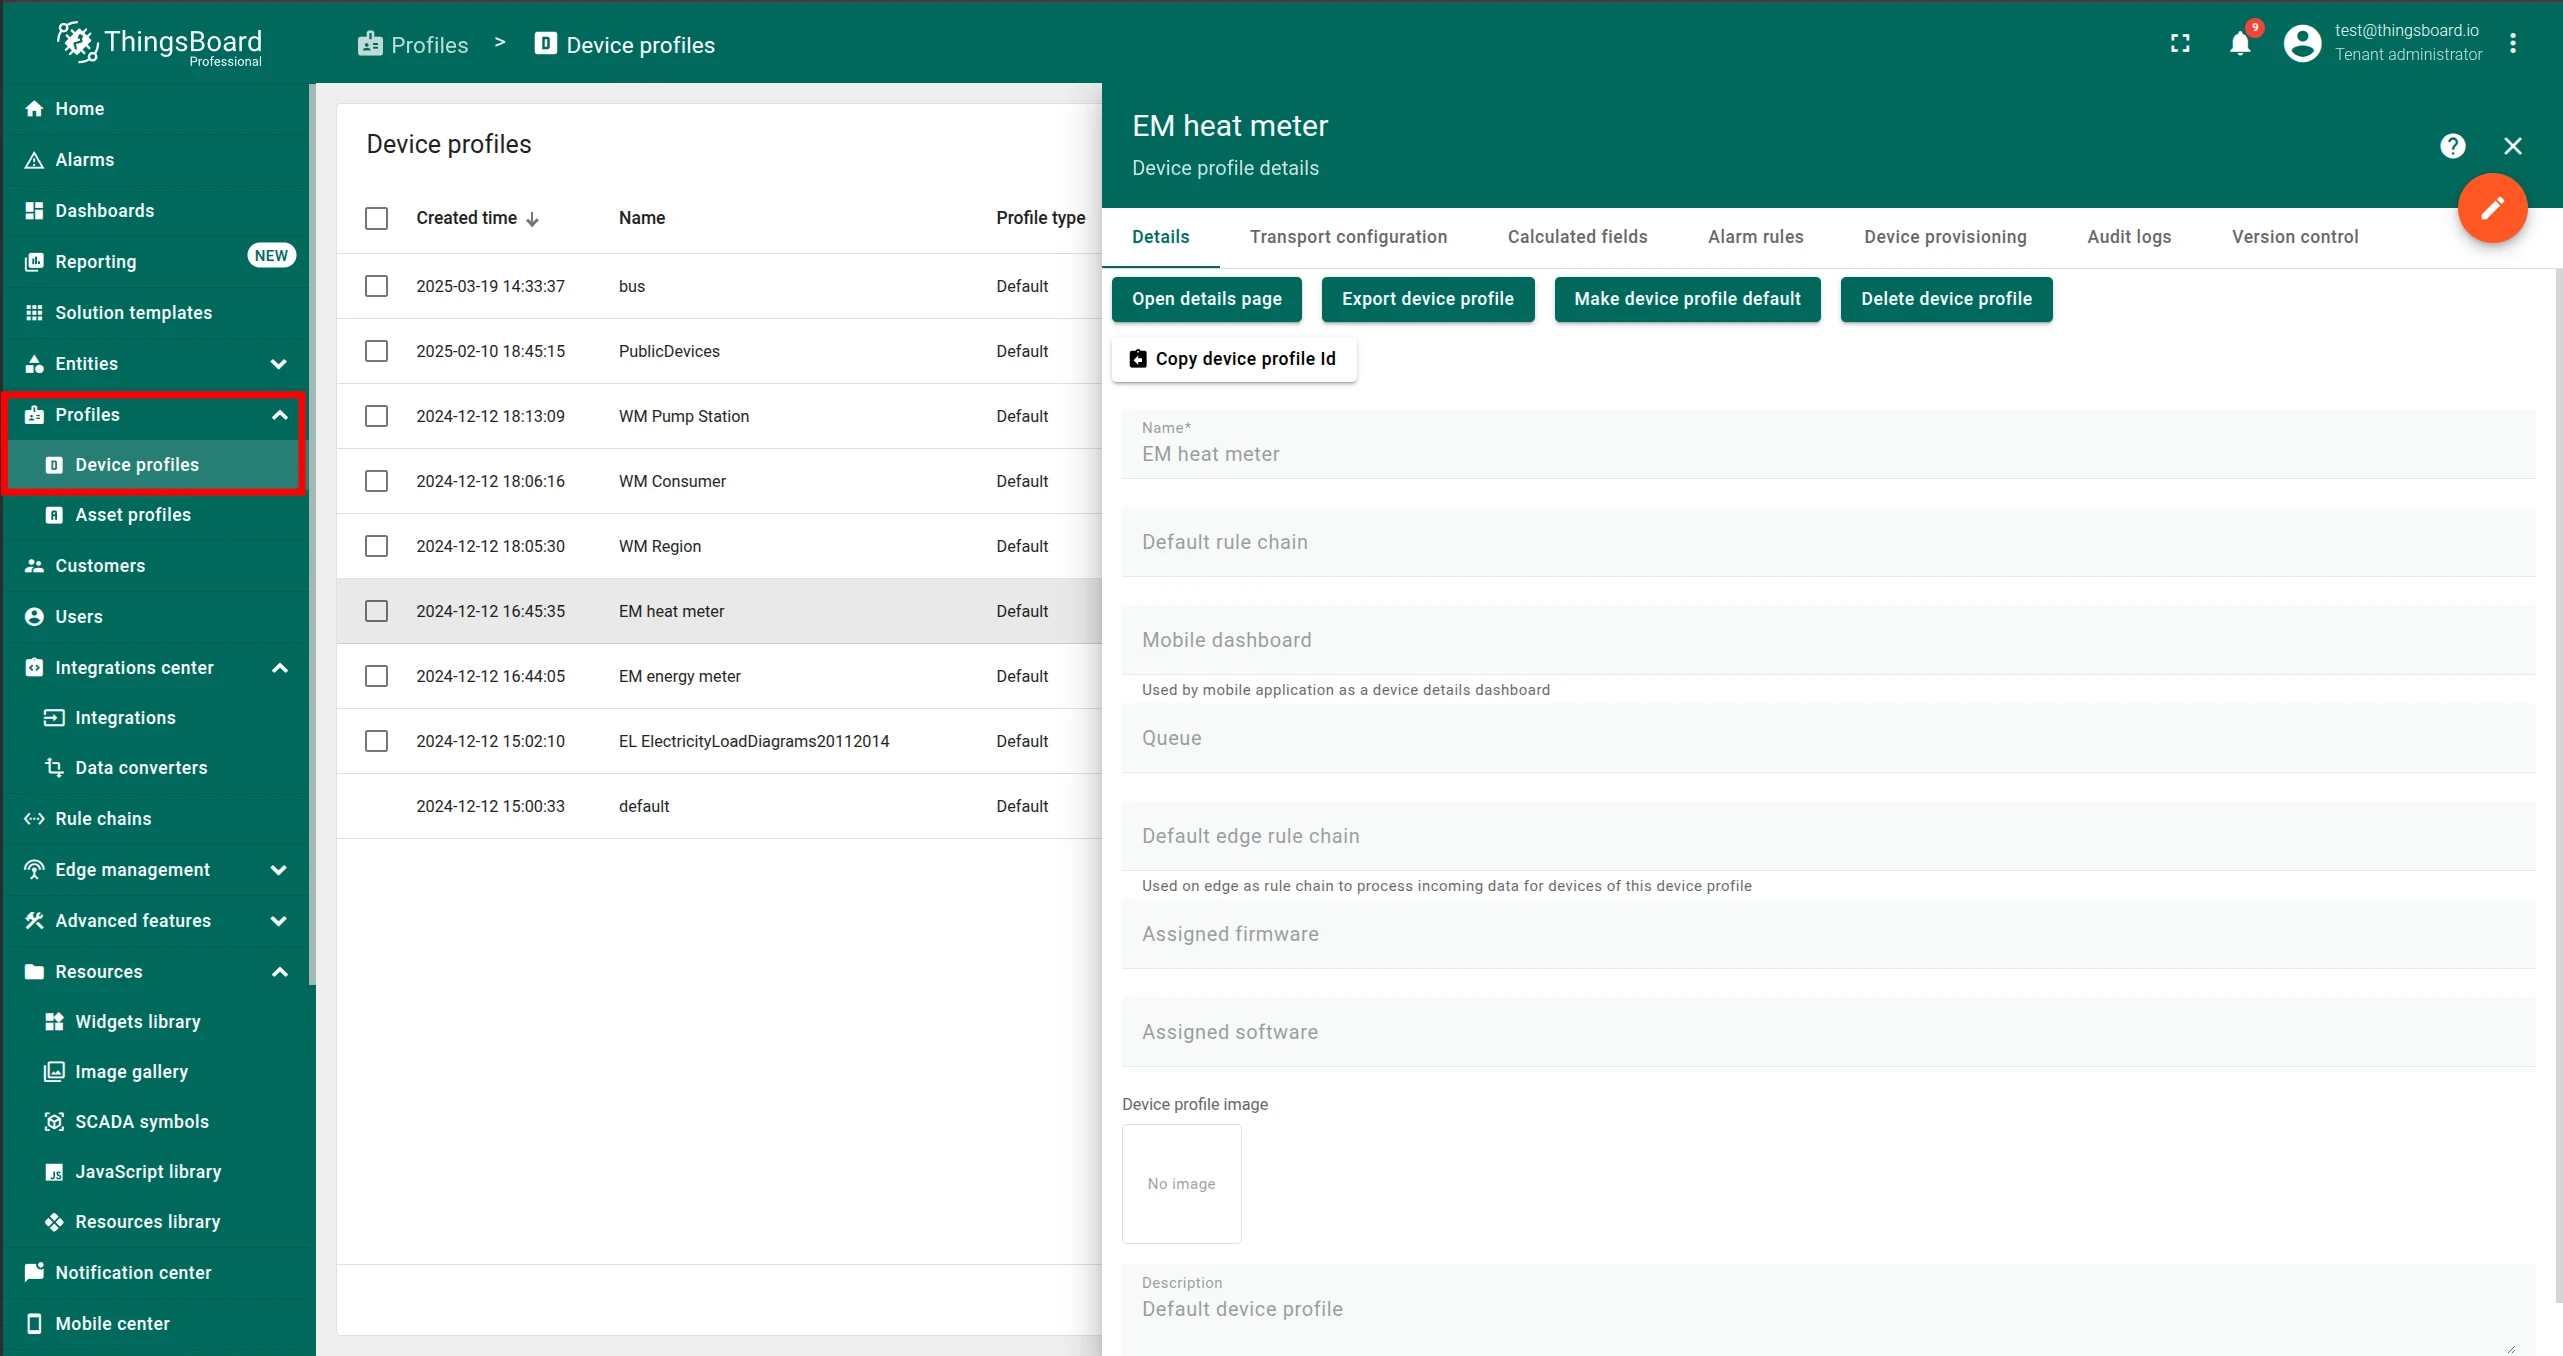
Once saved, the alarm rules are active.
Visualizations
Section titled “Visualizations”Visualize the metric in any Trendz widget — line chart, heatmap, state view, and others. See Trendz Visualizations for the full list of chart types.
To embed a Trendz view into a ThingsBoard dashboard, see Embed Trendz Views.
Predictions
Section titled “Predictions”Use Trendz Prediction Models to forecast future values of the saved metric and visualize them alongside the historical data.
Anomaly detection
Section titled “Anomaly detection”Detect anomalies or outages in the saved metric using Trendz Anomaly Models. When an anomaly is detected, you can automatically trigger an alarm in ThingsBoard.
Was this helpful?