
AI Card
The AI Card displays cumulative telemetry for a selected time range, extends it with a forecast for the remaining portion of that period, and adds an AI-generated summary. It is well-suited for monitoring energy consumption, sales metrics, equipment performance, or any cumulative measurement where historical context and short-term forecasting matter.
  Time range: This Month (Oct 1 – Oct 31, today = Oct 27)
  ┌─────────────────────────────────────────────────────┐  │  Current cumulative value  (incl. forecast)         │  │  Δ vs. previous month  (absolute + %)               │  │                                                     │  │  ──────────────────────╌╌╌╌╌╌╌╌   ← main value     │  │  ░░░░░░░░░░░░░░░░░░░░░░░░░░░░░░   ← prev. period   │  │        ↑ Oct 27                                     │  │  <── real data ──><── forecast ──>                  │  │                                                     │  │  AI summary text …                                  │  └─────────────────────────────────────────────────────┘
Base AI Card
Section titled “Base AI Card”-
Open Trendz and create a new view, selecting AI Card as the visualization type.
-
Drag the telemetry field you want to analyze into the Value column and choose an aggregation type.
-
Select a time range. The card shows real data from the start of the range up to today, and generates a forecast for all remaining dates in the range.
Example: With This Month selected on October 27th, the card shows actual data for Oct 1–27 and a forecast for Oct 28–31.
-
Click Build Report.
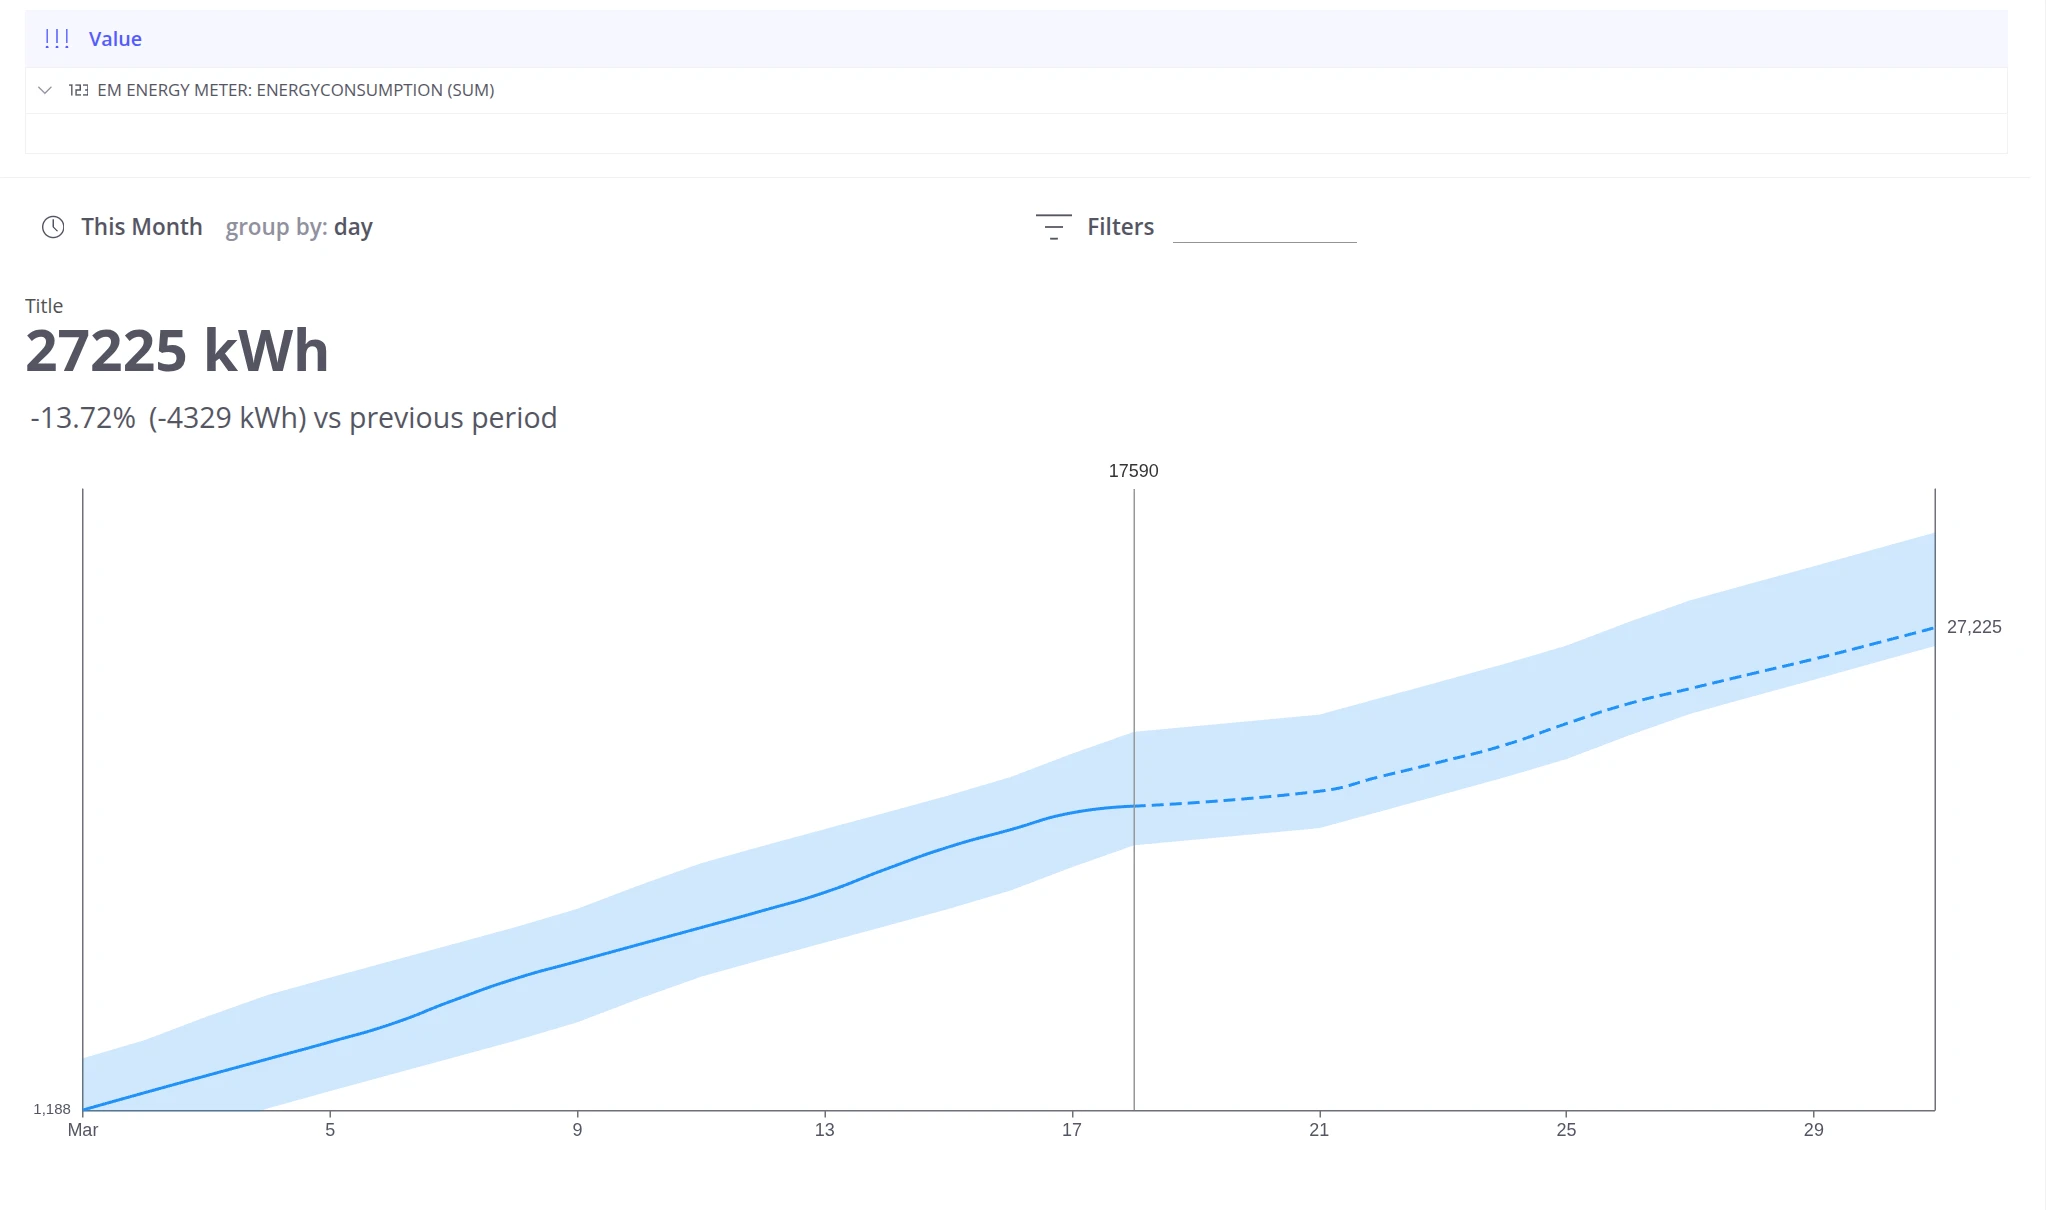
The resulting card shows six elements:
| # | Element | Description |
|---|---|---|
| 1 | Current cumulative value | Total for the range including forecast; color-coded by threshold |
| 2 | Difference from previous period | Absolute change and percentage versus the equivalent preceding period |
| 3 | Historical data (solid line) | Actual cumulative telemetry up to today |
| 4 | Predicted data (dashed line) | Forecast extending to the end of the selected range |
| 5 | Previous period trend (shaded area) | Cumulative trend from the equivalent previous period |
| 6 | AI summary | Auto-generated interpretation based on historical data and the selected prompt |
Configuration
Section titled “Configuration”Prediction method
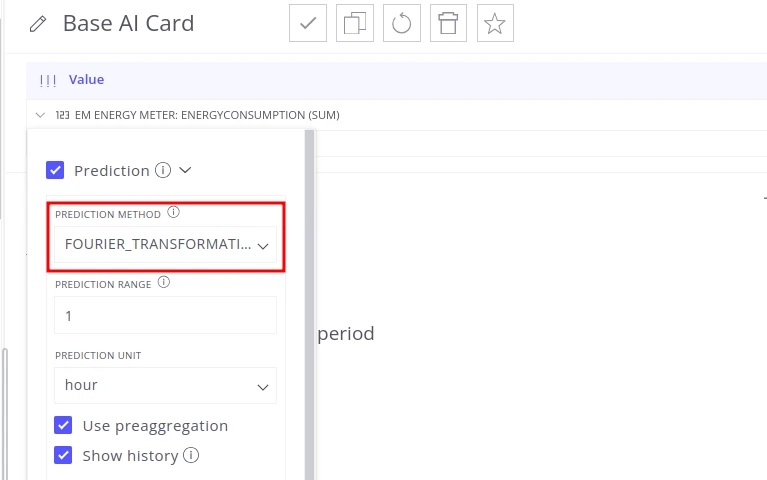
Section titled “Prediction method”The AI Card uses Fourier Transformation by default. To switch methods:
- Click the telemetry field in the Value column to open its settings.
- Go to the Prediction section.
- Select the desired method from the dropdown.
Prediction time range
Section titled “Prediction time range”The card generates predictions for all dates within the selected range that fall after the current timestamp.
| Time range | Behavior |
|---|---|
| This Month | Real data from the 1st through today; forecast for the rest of the month |
| This Year | Real data from Jan 1 through today; forecast for the rest of the year |
| Custom Oct 1 – Nov 15 (today = Oct 27) | Real data Oct 1–27; forecast Oct 28 – Nov 15 |
Use predefined ranges such as This Month or This Year for the most meaningful combined view.
AI summary
Section titled “AI summary”The AI summary is generated automatically using the LLM model configured in the Trendz-wide AI settings. To configure the summary for this card:
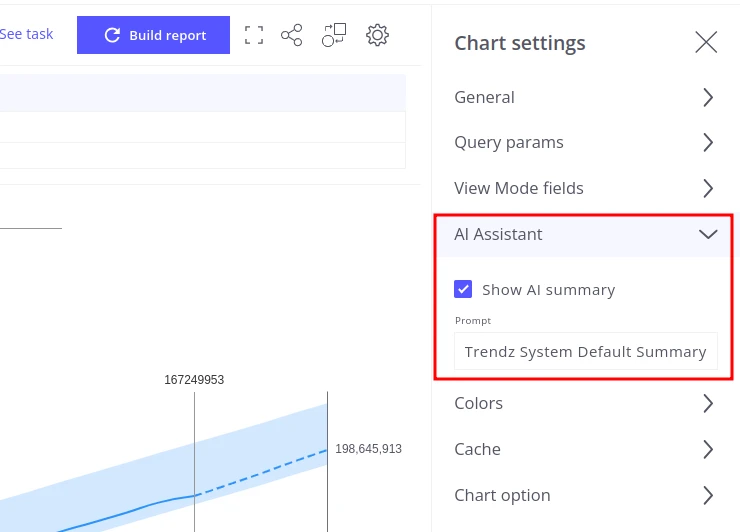
- Open Chart settings → AI Assistant.
- To hide the summary, uncheck Show AI summary.
- To change the analysis focus, select a different entry from the Prompt dropdown.
Custom prompts can be created for domain-specific use cases. See Trendz AI Prompts for details.
Value color threshold
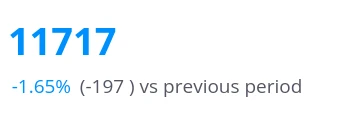
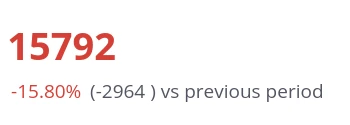
Section titled “Value color threshold”The cumulative value at the top of the card is color-coded based on its percentage change relative to the previous period:
| Color | Meaning | Default condition |
|---|---|---|
| Blue | Normal performance | Absolute change ≤ 10% |
| Red | Significant deviation | Absolute change > 10% |
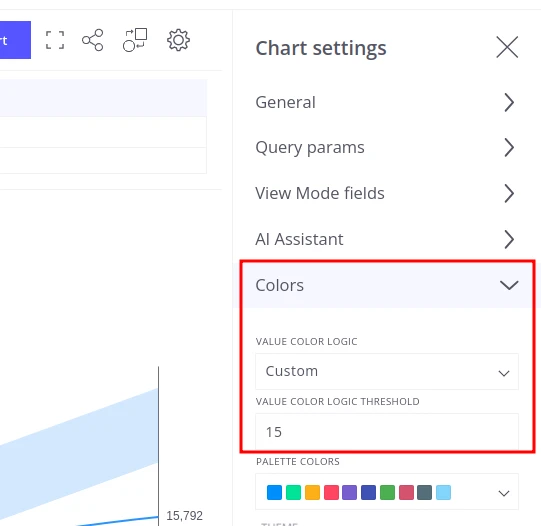
To customize the threshold, open Value Color Logic in the card settings:
| Option | Behavior |
|---|---|
| Default | 10% threshold for all color calculations |
| Custom | Set your own threshold percentage (e.g. 5% for sensitive alerts, 20% for coarser alerting) |
| Unset | Color-coding disabled; value always displays without highlighting |
Was this helpful?